

Performance analysis and knowledge-based quality assurance of critical organ auto-segmentation for pediatric craniospinal irradiation
- PMID: 38378834
- PMCID: PMC11310500
- DOI: 10.1038/s41598-024-55015-7
Performance analysis and knowledge-based quality assurance of critical organ auto-segmentation for pediatric craniospinal irradiation
Abstract
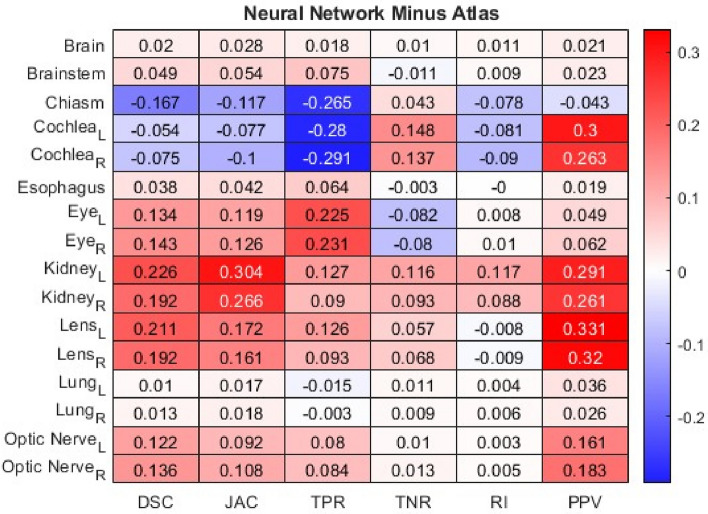
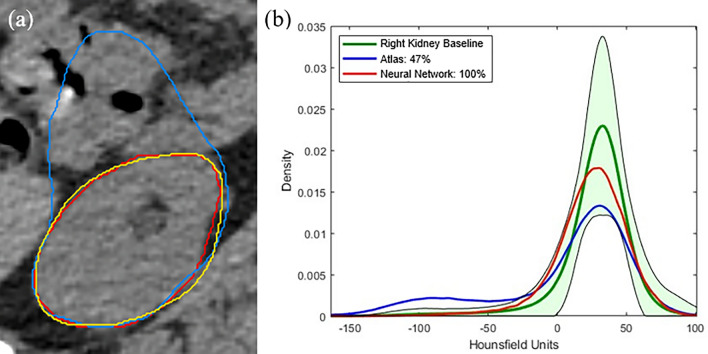
Craniospinal irradiation (CSI) is a vital therapeutic approach utilized for young patients suffering from central nervous system disorders such as medulloblastoma. The task of accurately outlining the treatment area is particularly time-consuming due to the presence of several sensitive organs at risk (OAR) that can be affected by radiation. This study aimed to assess two different methods for automating the segmentation process: an atlas technique and a deep learning neural network approach. Additionally, a novel method was devised to prospectively evaluate the accuracy of automated segmentation as a knowledge-based quality assurance (QA) tool. Involving a patient cohort of 100, ranging in ages from 2 to 25 years with a median age of 8, this study employed quantitative metrics centered around overlap and distance calculations to determine the most effective approach for practical clinical application. The contours generated by two distinct methods of atlas and neural network were compared to ground truth contours approved by a radiation oncologist, utilizing 13 distinct metrics. Furthermore, an innovative QA tool was conceptualized, designed for forthcoming cases based on the baseline dataset of 100 patient cases. The calculated metrics indicated that, in the majority of cases (60.58%), the neural network method demonstrated a notably higher alignment with the ground truth. Instances where no difference was observed accounted for 31.25%, while utilization of the atlas method represented 8.17%. The QA tool results showed that the two approaches achieved 100% agreement in 39.4% of instances for the atlas method and in 50.6% of instances for the neural network auto-segmentation. The results indicate that the neural network approach showcases superior performance, and its significantly closer physical alignment to ground truth contours in the majority of cases. The metrics derived from overlap and distance measurements have enabled clinicians to discern the optimal choice for practical clinical application.
© 2024. The Author(s).
Conflict of interest statement
The authors declare no competing interests.
Figures


References
-
- Young, A. V., Wortham, A., Wernick, I., Evans, A. & Ennis, R. D. Atlas-based segmentation improves consistency and decreases time required for contouring postoperative endometrial cancer nodal volumes. Int. J. Radiat. Oncol. Biol. Phys.79(3), 943–947. 10.1016/j.ijrobp.2010.04.063 (2011). 10.1016/j.ijrobp.2010.04.063 - DOI - PubMed
MeSH terms
Grants and funding
LinkOut - more resources
Full Text Sources
Medical
