Clinical Trial
. 2024 Feb 20;15(1):1533.
doi: 10.1038/s41467-024-45960-2.

Clinical and biomarker results from a phase II trial of combined cabozantinib and durvalumab in patients with chemotherapy-refractory colorectal cancer (CRC): CAMILLA CRC cohort

Affiliations
Clinical Trial

Clinical and biomarker results from a phase II trial of combined cabozantinib and durvalumab in patients with chemotherapy-refractory colorectal cancer (CRC): CAMILLA CRC cohort

Anwaar Saeed et al. Nat Commun. .

Abstract

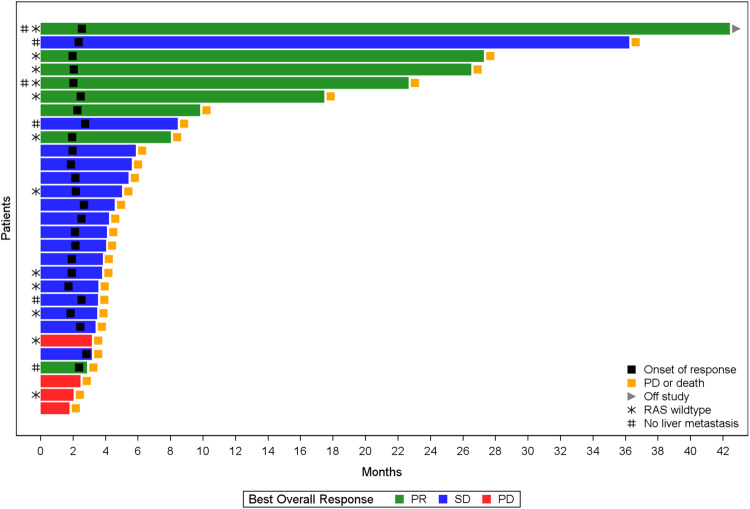
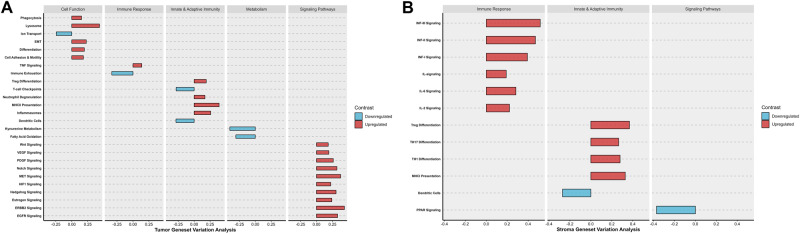
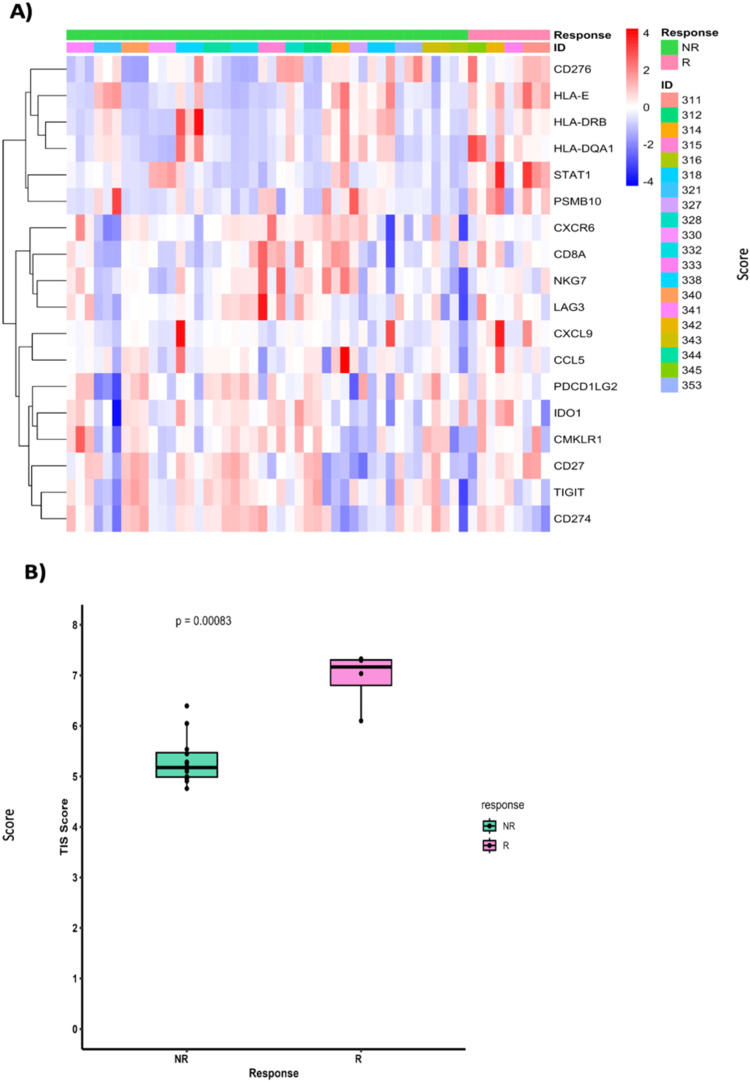
CAMILLA is a basket trial (NCT03539822) evaluating cabozantinib plus the ICI durvalumab in chemorefractory gastrointestinal cancer. Herein, are the phase II colorectal cohort results. 29 patients were evaluable. 100% had confirmed pMMR/MSS tumors. Primary endpoint was met with ORR of 27.6% (95% CI 12.7-47.2%). Secondary endpoints of 4-month PFS rate was 44.83% (95% CI 26.5-64.3%); and median OS was 9.1 months (95% CI 5.8-20.2). Grade≥3 TRAE occurred in 39%. In post-hoc analysis of patients with RAS wild type tumors, ORR was 50% and median PFS and OS were 6.3 and 21.5 months respectively. Exploratory spatial transcriptomic profiling of pretreatment tumors showed upregulation of VEGF and MET signaling, increased extracellular matrix activity and preexisting anti-tumor immune responses coexisting with immune suppressive features like T cell migration barriers in responders versus non-responders. Cabozantinib plus durvalumab demonstrated anti-tumor activity, manageable toxicity, and have led to the activation of the phase III STELLAR-303 trial.


Conflict of interest statement

A.S. reports a leadership role with Autem therapeutics, Exelixis, KAHR medical and Bristol-Myers Squibb; consulting or advisory board role with AstraZeneca, Bristol-Myers Squibb, Merck, Exelixis, Pfizer, Xilio therapeutics, Taiho, Amgen, Autem therapeutics, KAHR medical, and Daiichi Sankyo; institutional research funding from AstraZeneca, Bristol-Myers Squibb, Merck, Clovis, Exelixis, Actuate therapeutics, Incyte Corporation, Daiichi Sankyo, Five prime therapeutics, Amgen, Innovent biologics, Dragonfly therapeutics, Oxford Biotherapeutics, Arcus therapeutics, and KAHR medical; and participation as a data safety monitoring board chair for Arcus therapeutics. R.A. reports research grants (to institution) from AstraZeneca, Bayor, Merck, Bristol Myers Squibb, Exelixis, and Eureka Therapeutics and stock ownership in Actinium Pharmaceuticals and Seagen. A.K. reports research funding (to institution) from Astellas, Tesaro, and Bavarian Nordic. J.B. reports research grants (to institution) from Astellas, Chungchun Intellicrown, Impact Therapeutics, Poseida Therapeutics, Takeda Oncology, and Genome Co. and consultant fees (to institution) from Sanofi. S.W. reports stock/other ownership in Horizon Therapeutics, Iovance Biotherapeutics, and Merus and institutional research funding from Aleon Pharma, Astellas Pharma, Bayer Health, Bristol Myers Squibb, Daiichi Sankyo, EMD Serono, Merck Serono, Nektar, Novartis, Pharmacyclics, AbbVie, Regeneron, Rogosin Institute, Sanofi, Seagen, and Sotio. A.K.G. reports research funding from Predicine and VITRAC Therapeutics, is a co-founder of Sinochips Diagnostics, and serves as a scientific advisory board member to Biovica, Clara Biotech, and Sinochips Diagnostics. The remaining authors report no conflicts of interest.

Figures

Fig. 1
Fig. 1. Swimmer plot of individual patient responses.
Colors of bars represent best overall response (green, partial response; blue, stable disease; red, progressive disease). Black filled square marks the date of response onset; yellow filled square represents the date of progression or death; gray filled arrow denotes that the patient is currently active on study; star denotes a RAS gene wild-type patient; and # represents a patient with no liver metastasis.
Fig. 2
Fig. 2. Waterfall plot of individual patient responses.
Colors of bars represent best overall response (green, partial response; blue, stable disease; red, progressive disease). A star denotes a RAS wild-type patient and # represents a patient with no liver metastasis.
Fig. 3
Fig. 3. Regions of interest definition and GeoMx spatial transcriptomic analysis results in responders versus non-responders.
A Representation of immunofluorescent staining of one region of interest. Pan cytokeratin (green) was used to identify tumor epithelium for selection of the tumor epithelial compartment. Syto-13 (blue) was used to label nuclei and CD45 (red) was used to label leukocytes. Negative selection approach was used to identify the stroma compartment reflective of the tumor microenvironment that includes CD45 positive and pan-cytokeratin negative cells. B Heatmap showing the scaled Q3-normalized expression of the differentially expressed genes (DEGs) between responders (R) and non-responders (NR) in stroma compartment. Patients are depicted by key (ID). C Volcano plot for the DEGs in R versus NR in stroma compartment. Significant DEGs are labeled and shown in red, with log2FC > 1 and adjusted p-value < 0.05. NS non-significant. D Heatmap showing the scaled Q3-normalized expression of the DEGs between R and NR in tumor epithelial compartment. Patients are depicted by key (ID). E Volcano plot for the DEGs in R versus NR in tumor epithelial compartment. Significant DEGs are labeled and shown in red, with log2FC > 1 and adjusted p-value < 0.05. NS non-significant. The scaled bar (color key) in the heatmaps represents the scaled Q3-normalized expression of the identified DEGs. Volcano plots used generalized linear models to identify the differentially expressed genes between AOIs and p-values were corrected for multiple comparison using Benjamini and Hochberg method. All experiments have been repeated twice to ensure reproducibility.
Fig. 4
Fig. 4. Gene ontology analysis results in responders (R) versus non-responders (NR).
A Bar plots of selected significantly enriched gene ontology (GO) terms including enriched biological processes (BP), cellular components (CC) and molecular function (MF) in R versus NR in stroma compartment. B Bar plots of selected significant GO terms including BP, CC and MF, in R versus NR tumor epithelial compartment. P-values were corrected for multiple comparison using Benjamini and Hochberg method.
Fig. 5
Fig. 5. Gene Set Variation Analysis (GSVA) of significant differentially enriched pathways in responders versus non-responders.
The y-axis represents annotated gene sets from the Nanostring Cancer Transcriptome Atlas. The pathways are organized within modules of Cell Function, Metabolism, Immune Response, Innate and Adaptive Immunity and Signaling Pathways. The x-axis represents the fold change difference of differentially enriched pathways in responders in comparison to non-responders. Upregulated pathways are tinted in red and downregulated pathways are tinted in blue. A GSVA of tumor epithelial compartment showing significant differentially enriched pathways in responders. B GSVA of stroma compartment showing significant differentially enriched pathways in responders. Comparison between responders and non-responders was performed using a linear fit model from Limma with p-values corrected for multiple comparisons using BH method.
Fig. 6
Fig. 6. Cell type deconvolution by spatialDecon in responders versus non-responders.
A Heatmap of scaled cell abundance scores (scaled Beta values) in the tumor epithelial compartment. Patients are depicted by key (ID). Plasmacytoid Dendritic cells (pDCs), myeloid Dendritic cells (mDCs), conventional monocytes (monocytes. C, non-conventional/intermediate monocytes (monocytes NC.I). B Boxplots showing differences of cell infiltration between responders (R, n = 4) and non-responders (NR, n = 16) in tumor epithelial compartment. Statistical significance was tested using Wilcoxon’s rank sum test. C Heatmap of scaled cell abundance scores (scaled Beta values) in stroma compartment. Patients are depicted by Key (ID). D Boxplots showing differences of cell infiltration between responders (R, n = 4) and non-responders (NR, n = 16) in stroma compartment. Statistical significance was tested using Wilcoxon’s rank sum test. Box and whisker plots show all data points with median as center line with 25th and 75th percentiles. Two-sided Wilcoxon (Mann–Whitney U) test was performed.
Fig. 7
Fig. 7. T-cell inflamed gene expression signature (TIS) in responders versus non-responders.
A Heatmap of genes in T-cell inflamed gene expression signature representing the scaled expression of TIS genes. Patients are depicted by key (ID). B Boxplots showing differences in the TIS scores between responders and non-responders. The y-axis represents the TIS score. Statistical significance was tested using Wilcoxon’s rank sum test. Responders (R, n = 4), non-responders (NR, n = 16). Box and whisker plots show all data points with median as center line with 25th and 75th percentiles. Two-sided Wilcoxon (Mann–Whitney U) test was performed.

References

    1. Sung H, et al. Global cancer statistics 2020: GLOBOCAN estimates of incidence and mortality worldwide for 36 cancers in 185 countries. CA Cancer J. Clin. 2021;71:209–249. doi: 10.3322/caac.21660. - DOI - PubMed
    1. Diaz LA, Jr, et al. Pembrolizumab versus chemotherapy for microsatellite instability-high or mismatch repair-deficient metastatic colorectal cancer (KEYNOTE-177): final analysis of a randomised, open-label, phase 3 study. Lancet Oncol. 2022;23:659–670. doi: 10.1016/S1470-2045(22)00197-8. - DOI - PMC - PubMed
    1. André T, et al. Nivolumab plus low-dose ipilimumab in previously treated patients with microsatellite instability-high/mismatch repair-deficient metastatic colorectal cancer: 4-year follow-up from CheckMate 142. Ann. Oncol. 2022;33:1052–1060. doi: 10.1016/j.annonc.2022.06.008. - DOI - PubMed
    1. Khambata-Ford S, et al. Expression of epiregulin and amphiregulin and K-ras mutation status predict disease control in metastatic colorectal cancer patients treated with cetuximab. J. Clin. Oncol. 2007;25:3230–3237. doi: 10.1200/JCO.2006.10.5437. - DOI - PubMed
    1. Prager GW, et al. Trifluridine–tipiracil and bevacizumab in refractory metastatic colorectal cancer. N. Engl. J. Med. 2023;388:1657–1667. doi: 10.1056/NEJMoa2214963. - DOI - PubMed

Publication types

MeSH terms