. 2024 Mar;30(3):888-895.
doi: 10.1038/s41591-024-02810-4. Epub 2024 Feb 20.

Clinical surveillance systems obscure the true cholera infection burden in an endemic region

Affiliations

Clinical surveillance systems obscure the true cholera infection burden in an endemic region

Sonia T Hegde et al. Nat Med. 2024 Mar.

Erratum in

Abstract

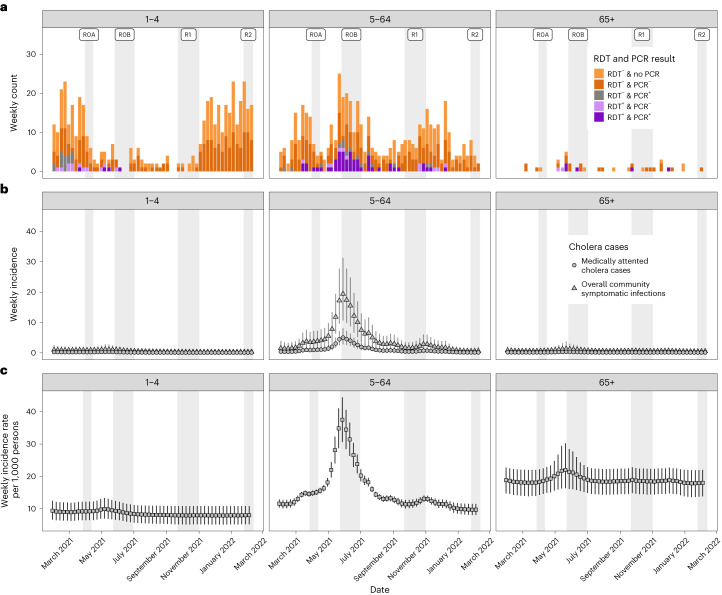
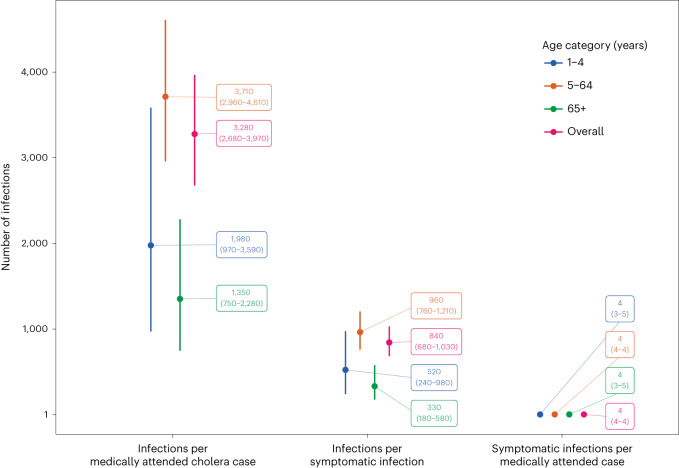
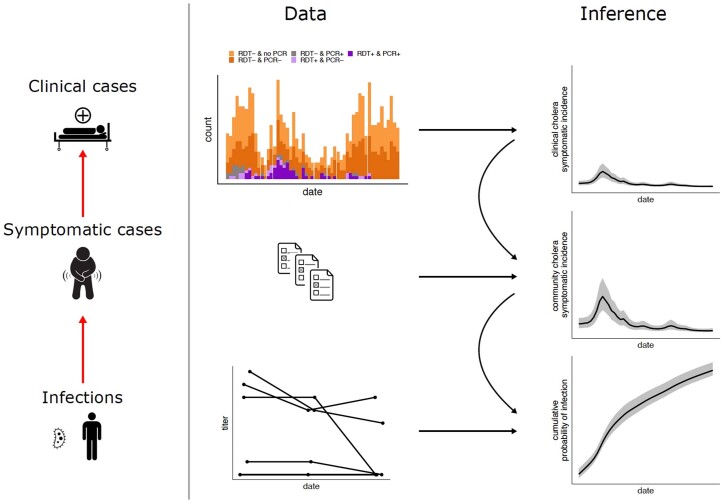
Our understanding of cholera transmission and burden largely relies on clinic-based surveillance, which can obscure trends, bias burden estimates and limit the impact of targeted cholera-prevention measures. Serological surveillance provides a complementary approach to monitoring infections, although the link between serologically derived infections and medically attended disease incidence-shaped by immunological, behavioral and clinical factors-remains poorly understood. We unravel this cascade in a cholera-endemic Bangladeshi community by integrating clinic-based surveillance, healthcare-seeking and longitudinal serological data through statistical modeling. Combining the serological trajectories with a reconstructed incidence timeline of symptomatic cholera, we estimated an annual Vibrio cholerae O1 infection incidence rate of 535 per 1,000 population (95% credible interval 514-556), with incidence increasing by age group. Clinic-based surveillance alone underestimated the number of infections and reported cases were not consistently correlated with infection timing. Of the infections, 4 in 3,280 resulted in symptoms, only 1 of which was reported through the surveillance system. These results impart insights into cholera transmission dynamics and burden in the epicenter of the seventh cholera pandemic, where >50% of our study population had an annual V. cholerae O1 infection, and emphasize the potential for a biased view of disease burden and infection risk when depending solely on clinical surveillance data.


Conflict of interest statement

The authors declare no competing interests.

Figures

Fig. 1
Fig. 1. Overview of conceptual model of the continuum between infections and medically attended cholera.
Key data sources used in the model are indicated on the right. The dashed area indicated by ‘medically attended suspected cholera’ represents those suspected cases that are false positive by cholera diagnostic testing and therefore captured by surveillance.
Fig. 2
Fig. 2. Weekly suspected cases, symptomatic infections and exposures/infections by age group.
a, The weekly number of suspected cases from Sitakunda colored by RDT and PCR results (culture results not shown). All suspected cases (n = 998) were tested by RDT but only positives and around half of the negatives were tested by PCR. b, The weekly estimates of the number of true cholera cases seeking care at study facilities (circles), with triangles representing the estimates of the true number of symptomatic cases both in facilities and in the community. c, Representation of estimates of the number of weekly infections that elicit an immunological boost, as inferred from longitudinal vibriocidal titers. Uncertainty is represented by vertical error bars across b and c giving the 95% CrIs from 5,000 HMC posterior draws. Here, RDT refers to the Cholkit rapid diagnostic test, R0A and R0B refer to the baseline round of the serosurvey from 27 March 2021 to 13 June 2021, which included an ∼1-month gap owing to a national COVID-19-related lockdown (R0A refers to pre-lockdown and R0B to post-lockdown); R1 refers to the first follow-up serosurvey from 21 September 2021 to 9 October 2021 and R2 to the second follow-up serosurvey from 25 January 2022 to 13 February 2022.
Fig. 3
Fig. 3. Estimates of ratios along the continuum between infections and reported medically attended cholera cases by age group (color).
Uncertainty is represented by vertical error bars giving the 95% CrIs from 5,000 HMC posterior draws, whereas the center gives the mean of the posterior draws. These ratios are derived from the three primary data sources used: clinic-based surveillance (n = 998), the healthcare-seeking survey (n = 2,481) and the serological cohort (n = 1,785).
Extended Data Fig. 1
Extended Data Fig. 1. Map of the study area.
Map of the enrolled households in the serosurvey in the Sitakunda sub-district (a), and the suspected (b) and confirmed (c) clinical V. cholerae cases by RDT test result by Union (the lowest administrative unit) in the Chattogram district of Bangladesh. Among the 2,176 suspected cases that visited the study clinical facilities during the study period, 99% (N = 2,158) were from or spent the last 7 days in the Chattogram district. Among the suspected cases from the Chattogram district (N = 2,158), 46% (N = 998) were from or spent the last 7 days in the subdistrict of Sitakunda.
Extended Data Fig. 2
Extended Data Fig. 2. Demographic pyramid of survey participants.
Demographic pyramid of survey participants (only those with three follow-up visits) (a) and of suspected (b) and RDT-confirmed (c) cases from clinical surveillance by age group and sex. The dots represent the underlying population distribution. The enrolled suspected and confirmed cholera cases in clinical surveillance roughly followed the age and sex distribution of the national population, though children less than five years old were overrepresented when compared to the population and those 5–19 years old were underrepresented.
Extended Data Fig. 3
Extended Data Fig. 3. Weekly estimates of the number of true cholera cases seeking care at the study health facilities.
The weekly estimates by age group of the number of true cholera cases seeking care at study facilities (circles) with triangles representing the estimates of the true number of symptomatic cases both in facilities and the community. Uncertainty is represented by vertical error bars across the middle and bottom rows giving the 95% credible intervals from 5,000 Hamiltonian Monte Carlo (HMC) posterior draws, while the center gives the mean value of the posterior draws.
Extended Data Fig. 4
Extended Data Fig. 4. Study aim and the modeling framework.
The analysis relies on the inference of seroincidence rates based on serial measurements of vibriocidal antibodies. In turn, this inference relies on estimates of the time-varying force of infection from Vibrio cholerae O1, which results in seroconversions in between the study rounds. The icons used in the first column on the left were designed by Freepik (www.freepik.com).
Extended Data Fig. 5
Extended Data Fig. 5. Posterior retrodictive checks of the clinical surveillance data.
This plot illustrates the observed data (red dots) and the predicted mean values and 95% prediction intervals in black (n = 998).
Extended Data Fig. 6
Extended Data Fig. 6. Clinical incidence model key parameter prior and posterior draws.
Histograms of the intercepts of cholera and non-cholera AWD daily incidence (on log scale) (a) and the histograms of test sensitivity and specificity (b).
Extended Data Fig. 7
Extended Data Fig. 7. Vibriocidal results from the serosurvey.
a. Density plot of Vibrio cholerae O1 Ogawa vibriocidal titers by serosurvey round where the dashed line indicates the population mean titer for the N = 1,785 individuals who provided serum samples for all three rounds of data collection. The rug plots below indicate the actual titer values measured. b. The trajectory of log2(vibriocidal titers) across serosurvey rounds grouped by those who seroconvert (≥2-fold rise in titer value across any two study visits) and those who remain stable or serorevert. The overall distribution of vibriocidal antibodies was similar across rounds of data collection, with 18.7% of participants having a titer ≥320 at baseline (during both enrollment periods; 17.6% during R0A and 19.1% during R0B), 21% during the first follow-up (R1), and 19.4% during the second follow-up (R2). Overall, 8.1% of participants had a ≥2-fold rise in vibriocidal titers across any two study visits including 14.9% among children 1–4 years old, 7.8%among those 5–64 years old and 8.6% among those 65 years and older. Four percent of individuals had a ≥2-fold rise in titers from enrollment to their first follow-up visit, and 4.2% had a ≥2-fold rise between the first follow-up and the final visit.
Extended Data Fig. 8
Extended Data Fig. 8. Posteriors of the antibody kinetic model.
Posteriors of vibriocidal (Ogawa) antibody kinetics model parameters from Jones et al..The random draws from this posterior distribution are shown.
Extended Data Fig. 9
Extended Data Fig. 9. Posterior retrodictive checks of serological trajectories.
This plot illustrates the titer trajectories for each participant classified by their most probable infection profile (panel/facet) along with the posterior probability of having that infection profile (color).
Extended Data Fig. 10
Extended Data Fig. 10. Seroincidence model key parameter prior and posterior draws.
The key parameter prior and posterior draws from the seroincidence model by model type (assuming a constant infection hazard rate versus time-varying infection hazard rate) and age group.

References

    1. Weill F-X, et al. Genomic insights into the 2016–2017 cholera epidemic in Yemen. Nature. 2019;565:230–233. doi: 10.1038/s41586-018-0818-3. - DOI - PMC - PubMed
    1. Weill F-X, et al. Genomic history of the seventh pandemic of cholera in Africa. Science. 2017;358:785–789. doi: 10.1126/science.aad5901. - DOI - PubMed
    1. Mutreja A, et al. Evidence for several waves of global transmission in the seventh cholera pandemic. Nature. 2011;477:462–465. doi: 10.1038/nature10392. - DOI - PMC - PubMed
    1. Sack RB, et al. A 4-year study of the epidemiology of Vibrio cholerae in four rural areas of Bangladesh. J. Infect. Dis. 2003;187:96–101. doi: 10.1086/345865. - DOI - PubMed
    1. Qadri F, et al. Efficacy of a single-dose regimen of inactivated whole-cell oral cholera vaccine: results from 2 years of follow-up of a randomised trial. Lancet Infect. Dis. 2018 doi: 10.1016/S1473-3099(18)30108-7. - DOI - PubMed