. 2024 Apr;27(4):656-665.
doi: 10.1038/s41593-024-01580-z. Epub 2024 Feb 20.

A phenotypic screening platform for identifying chemical modulators of astrocyte reactivity

Affiliations

A phenotypic screening platform for identifying chemical modulators of astrocyte reactivity

Benjamin L L Clayton et al. Nat Neurosci. 2024 Apr.

Abstract

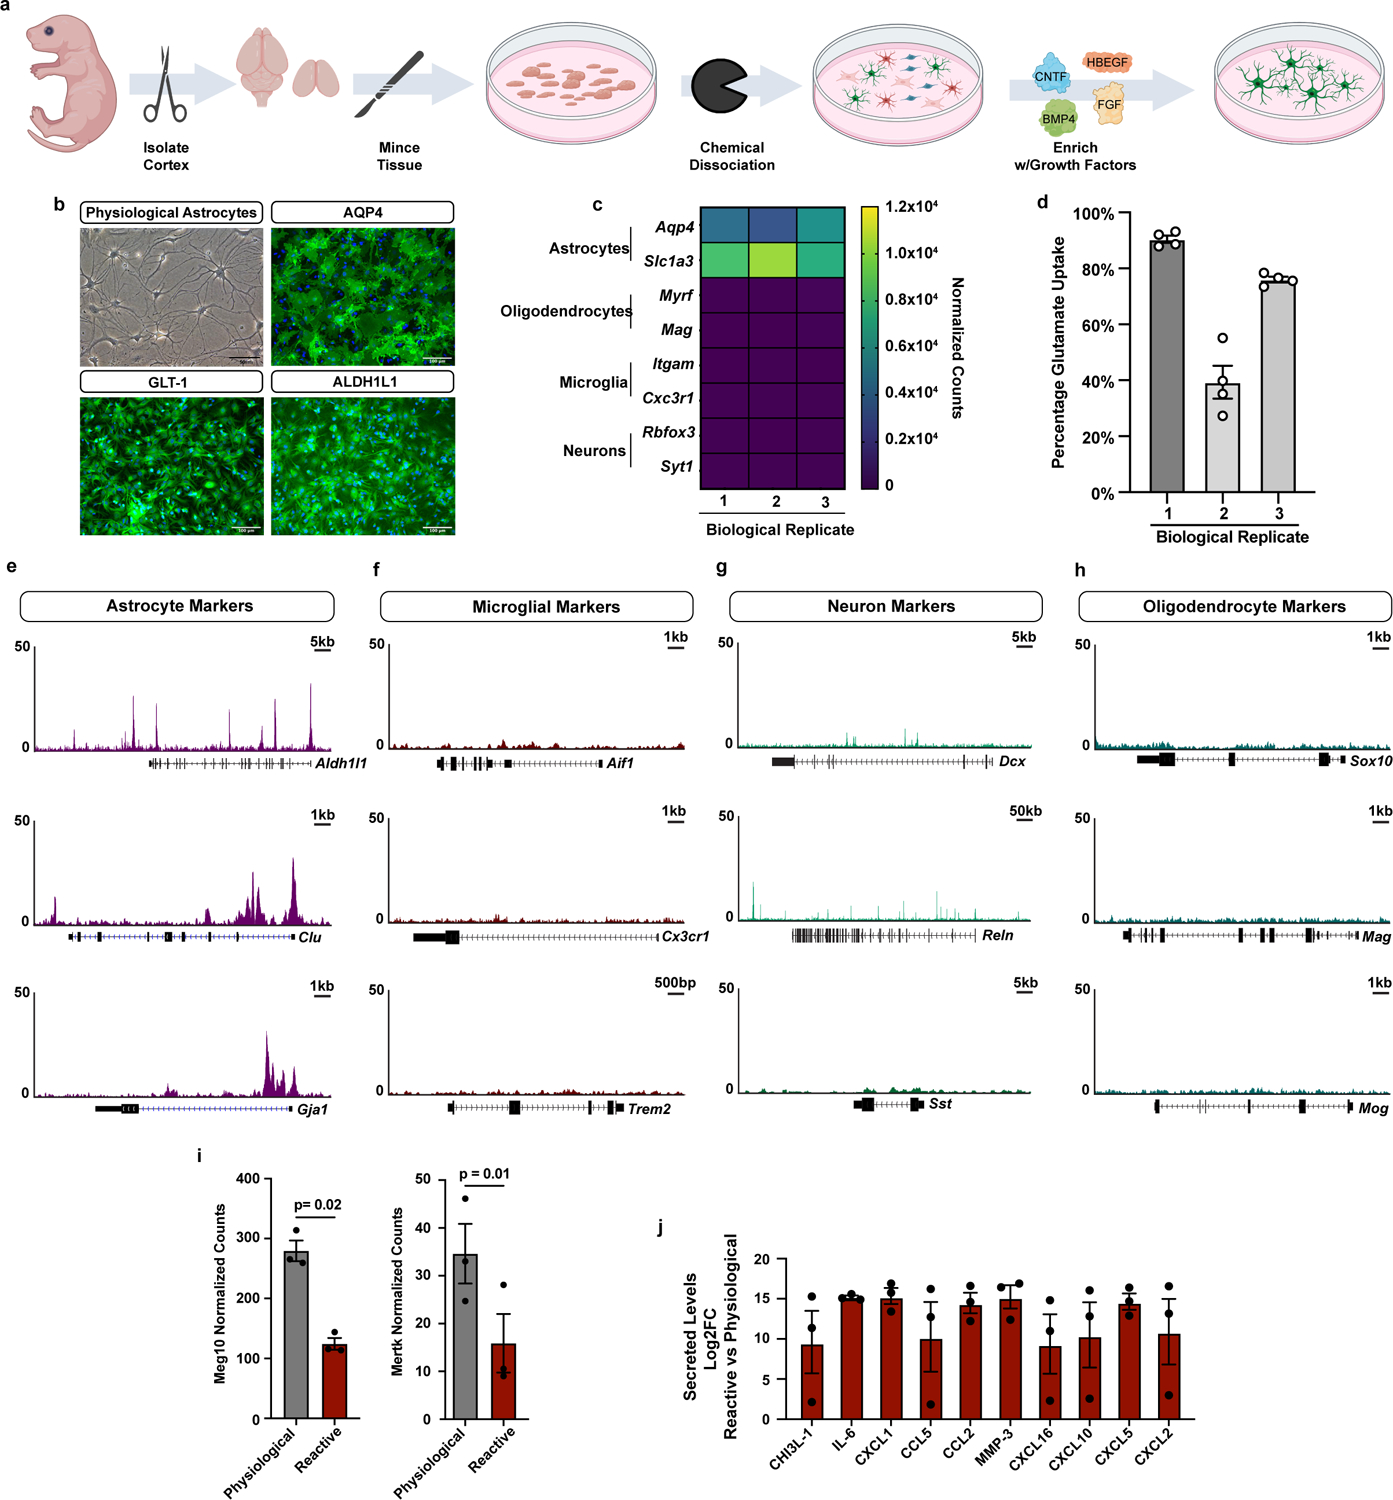
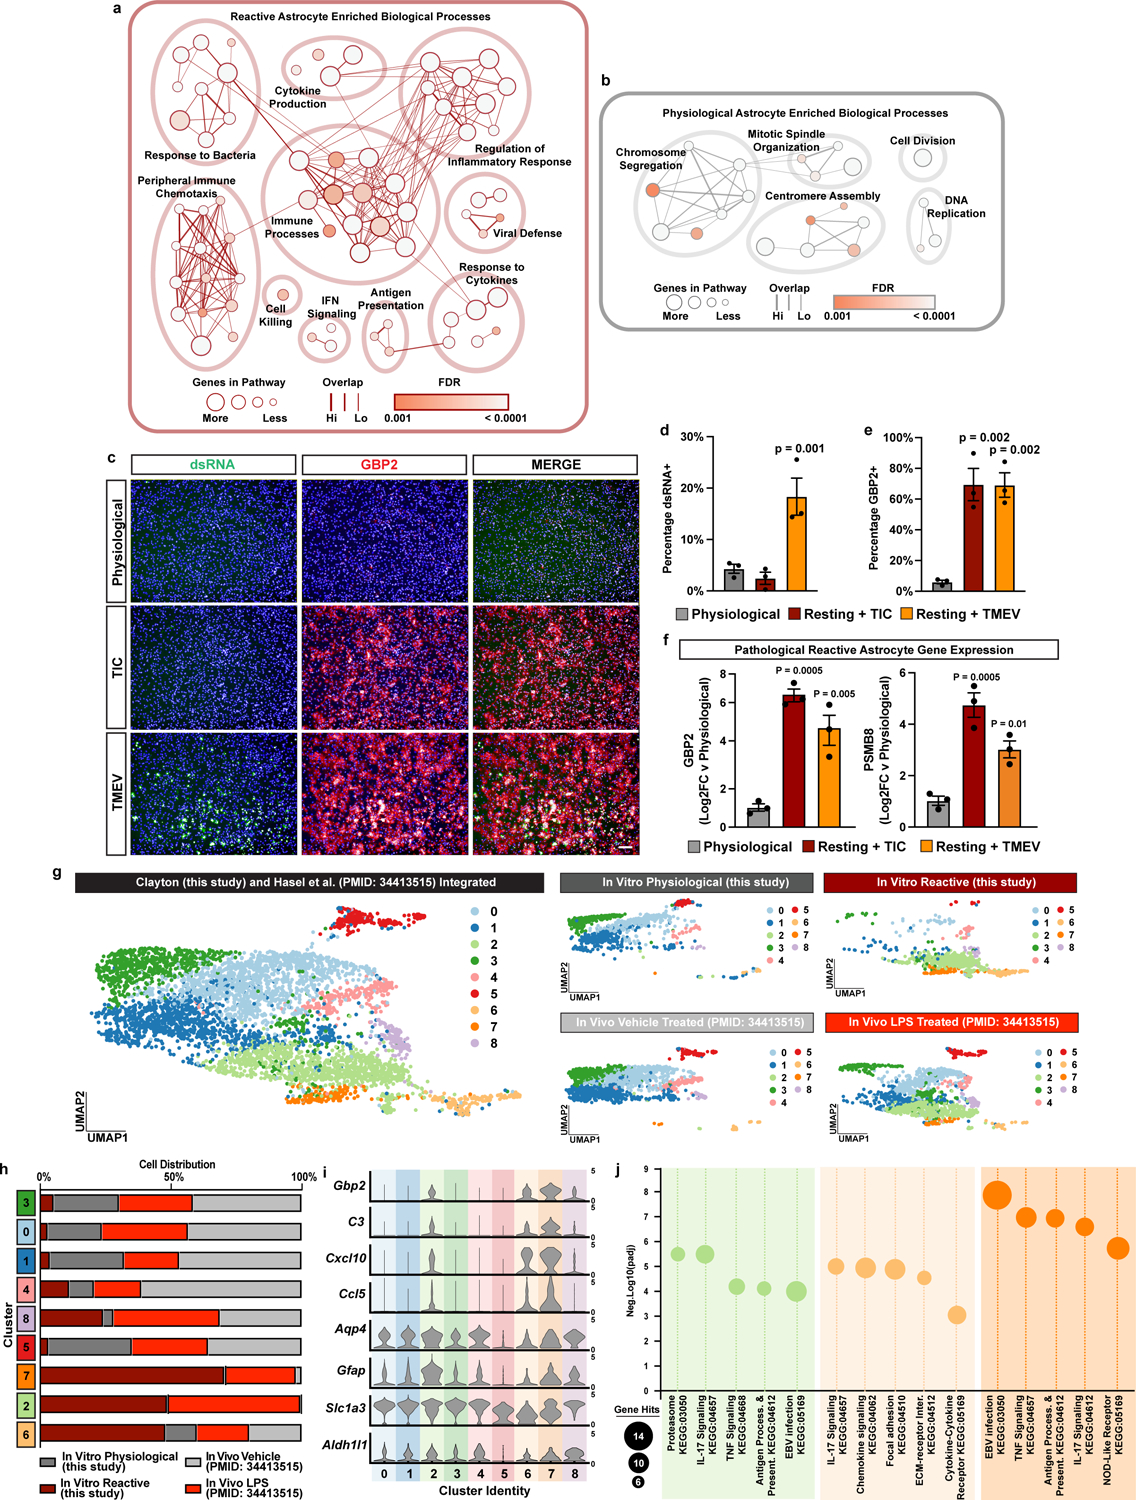
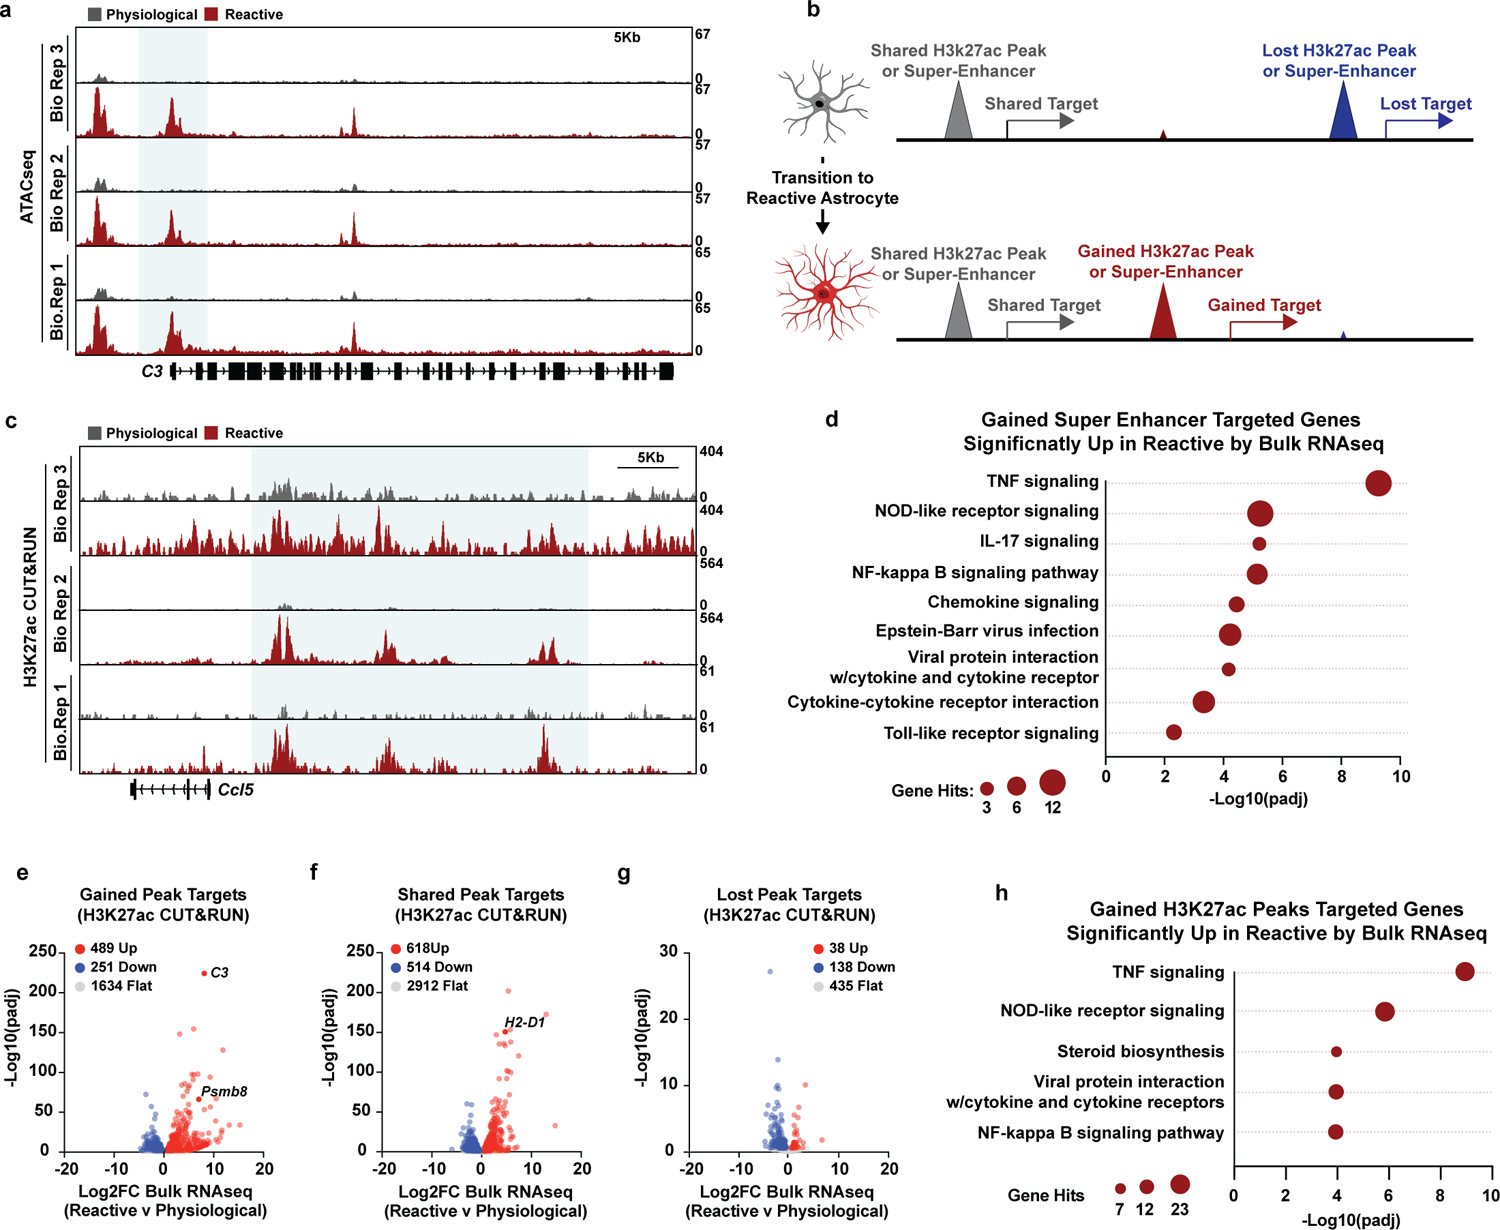
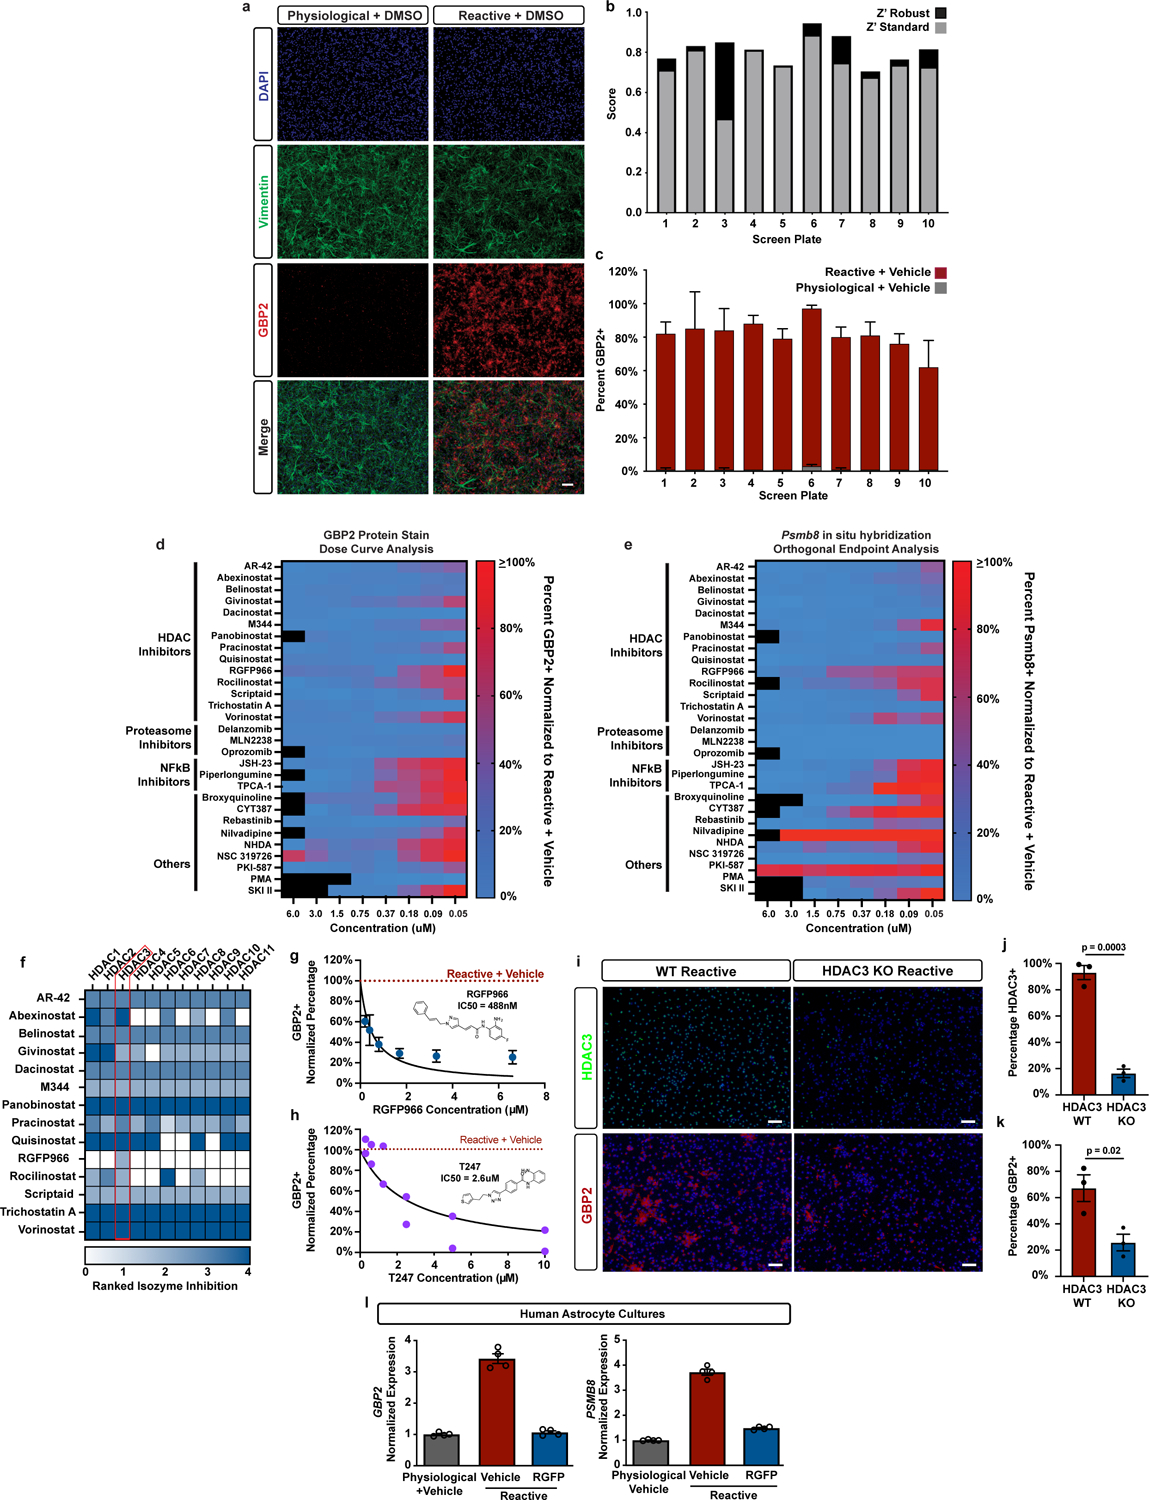
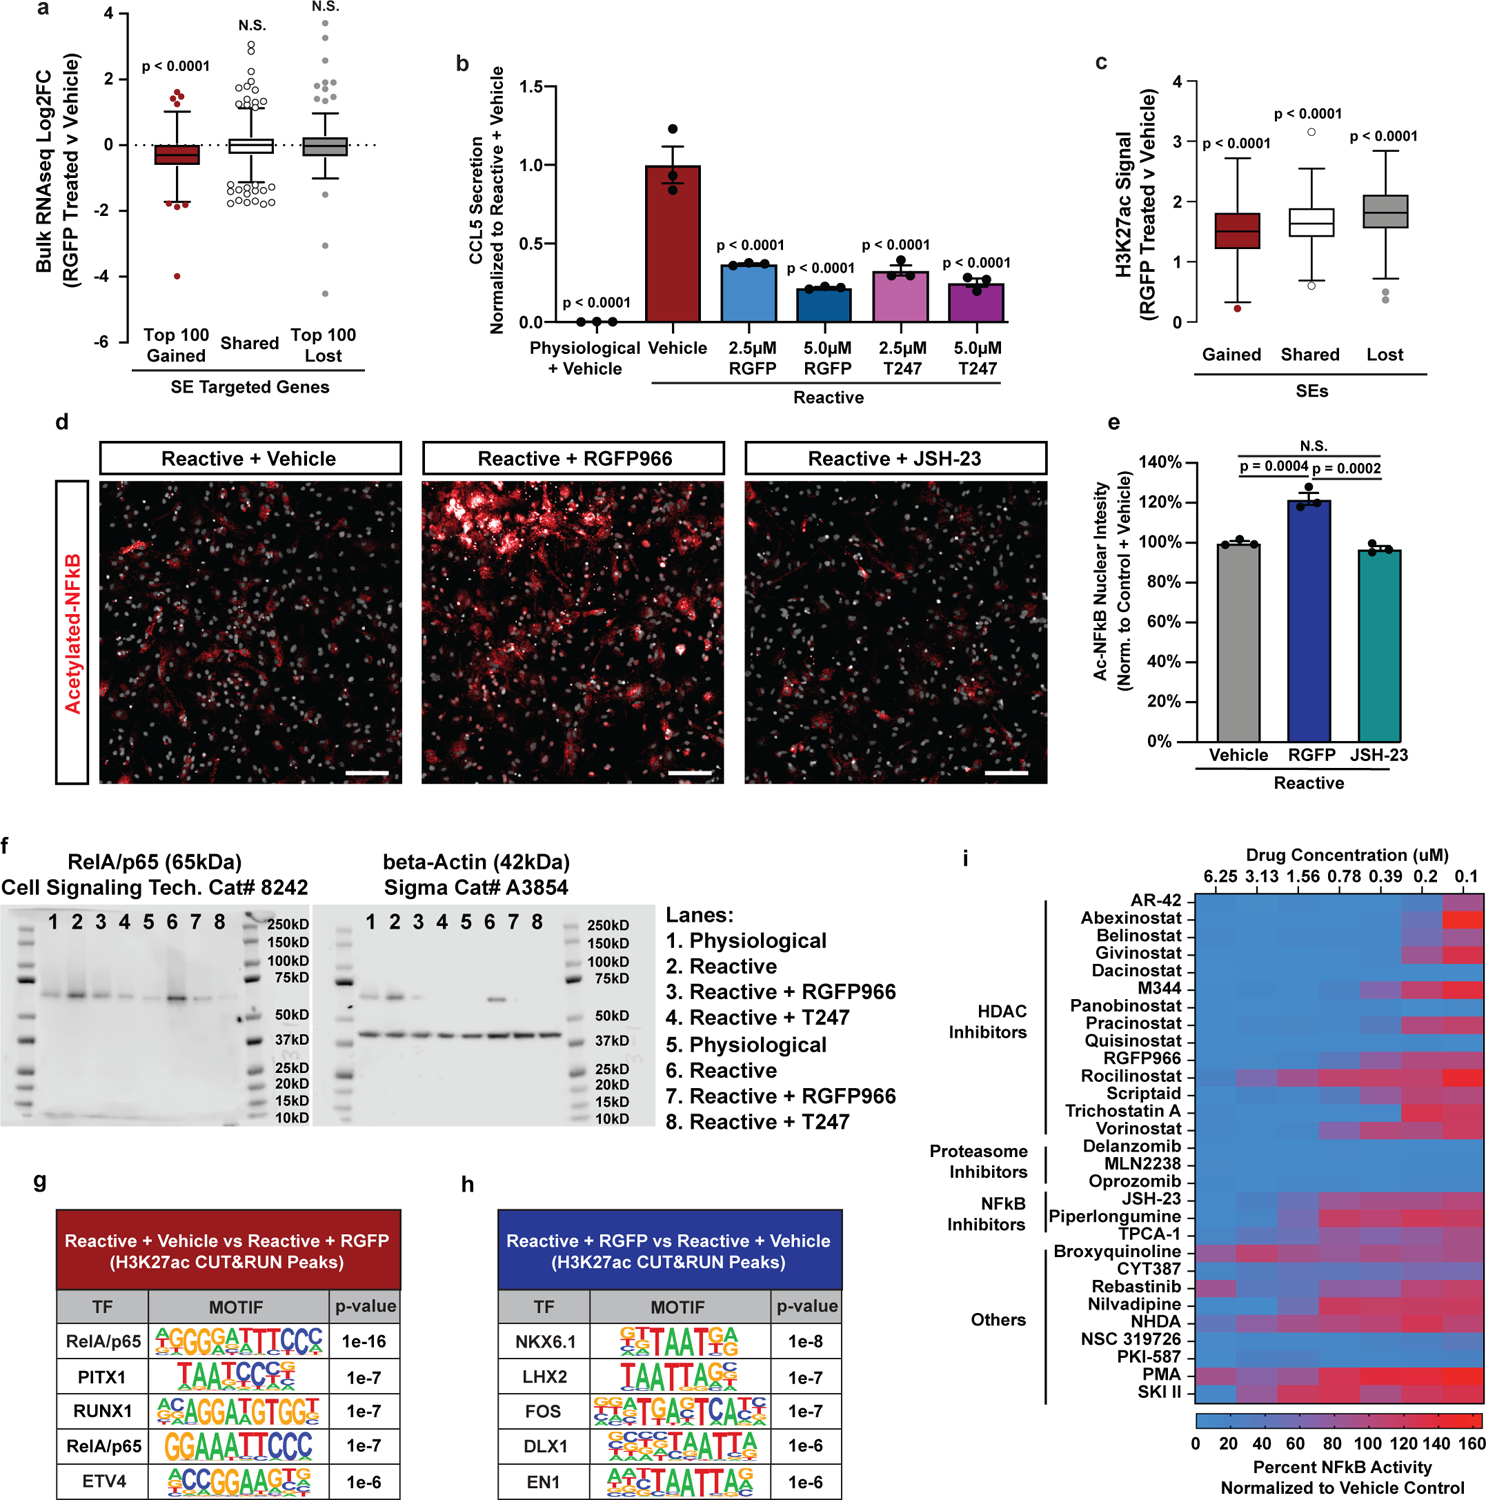
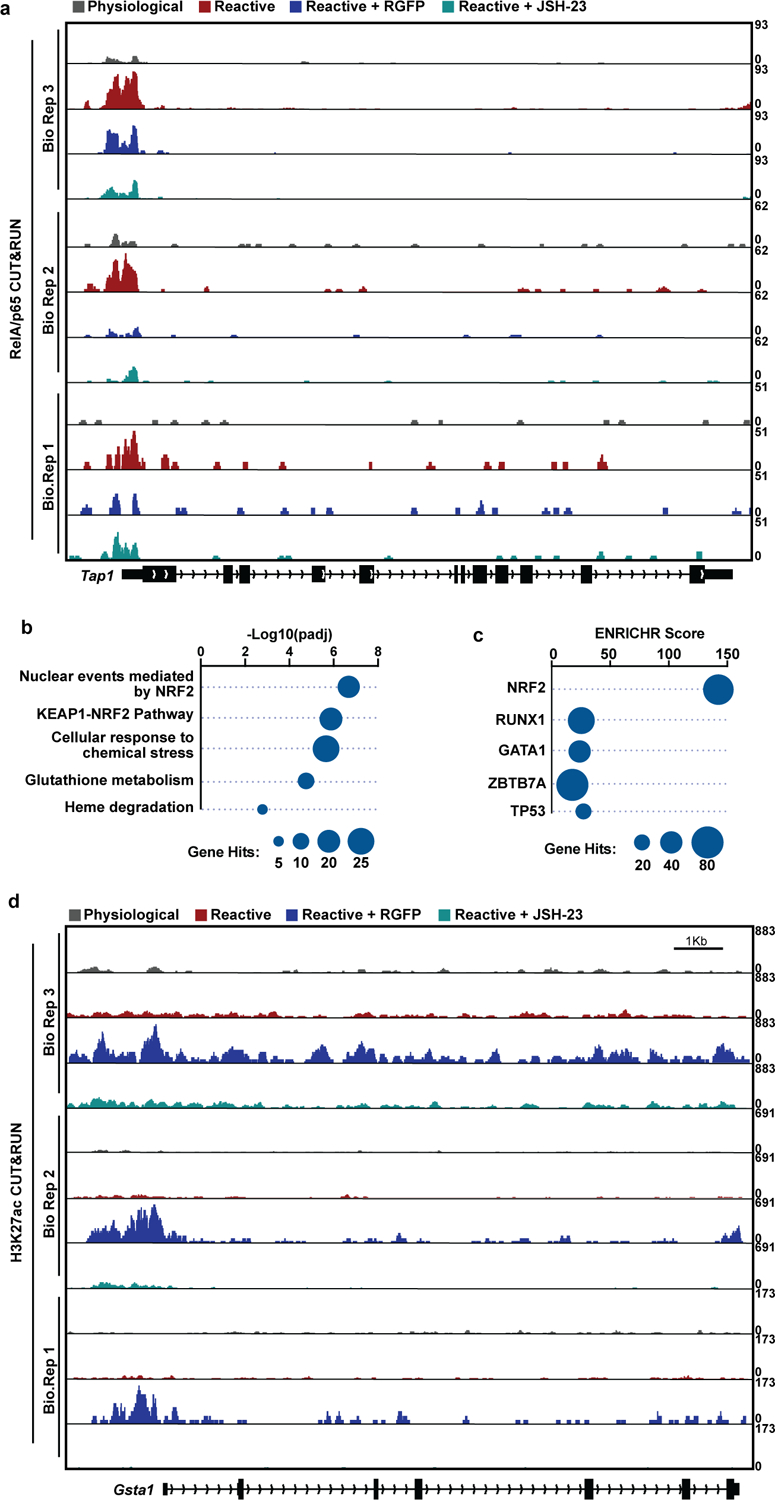
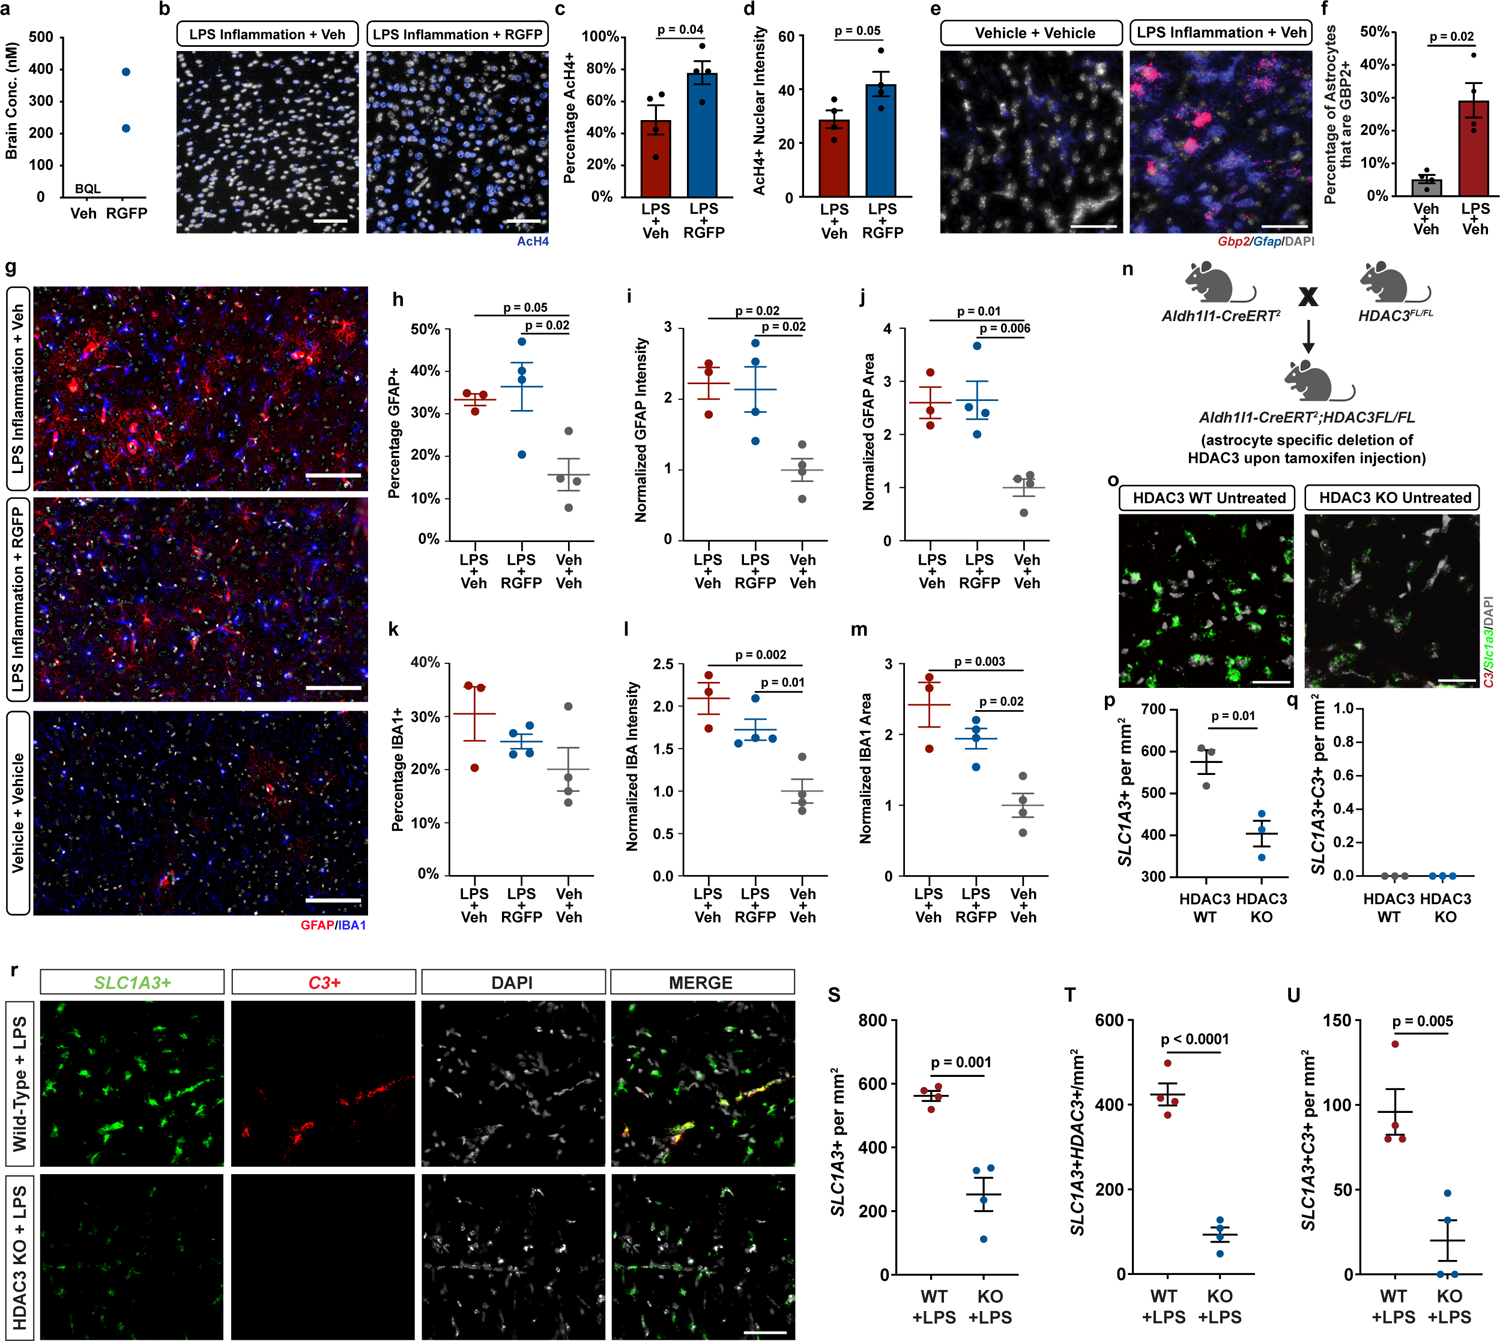
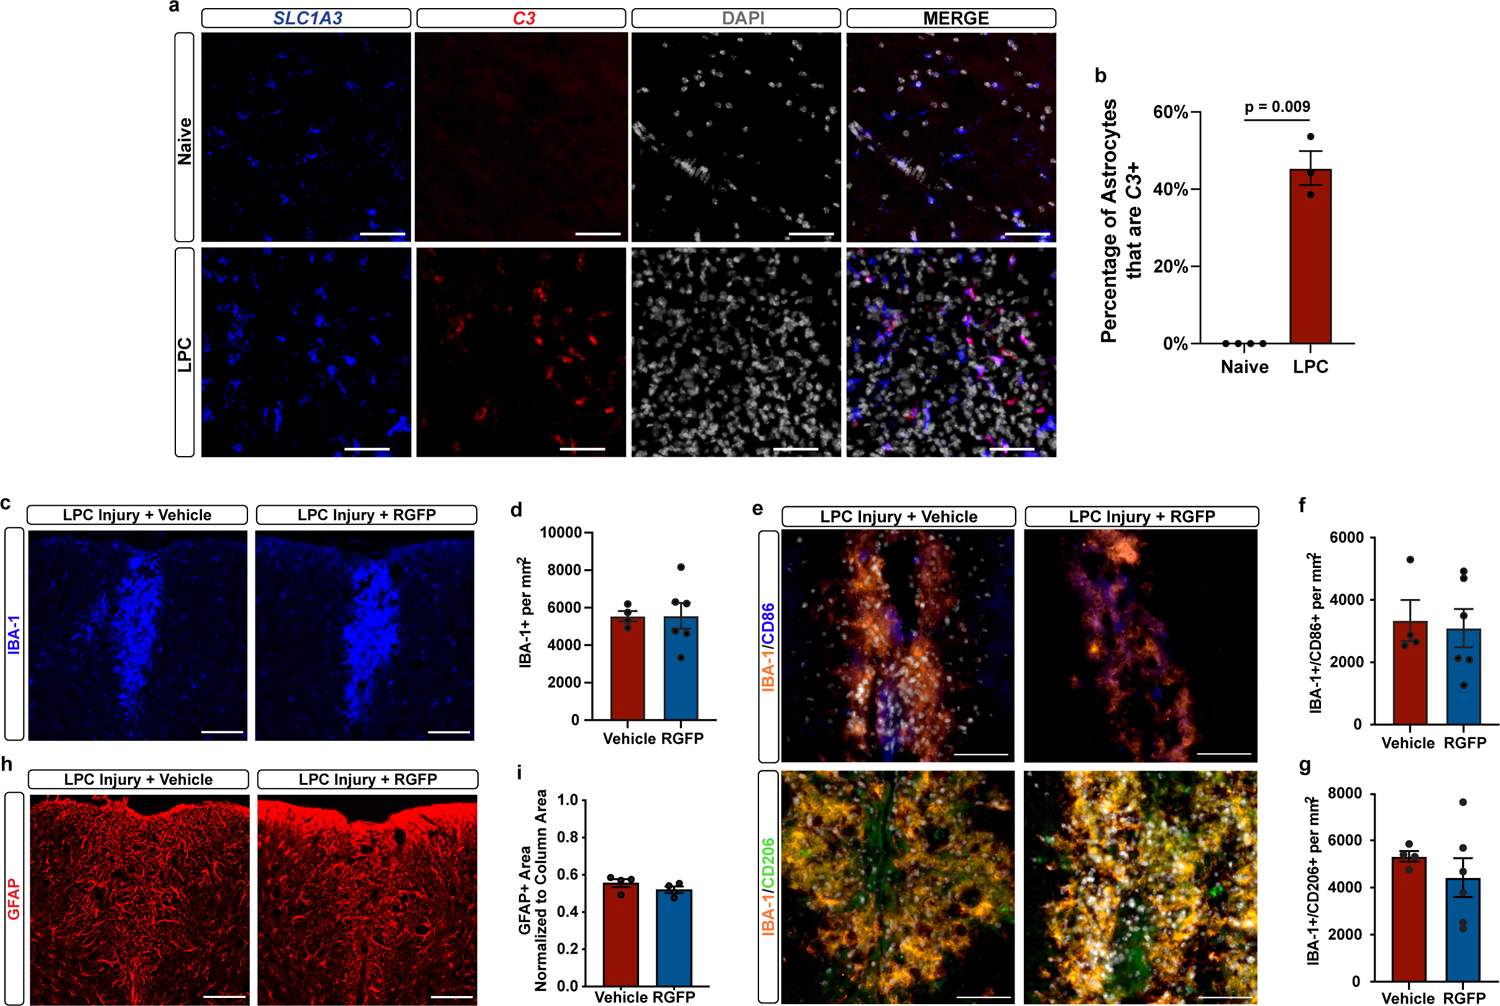
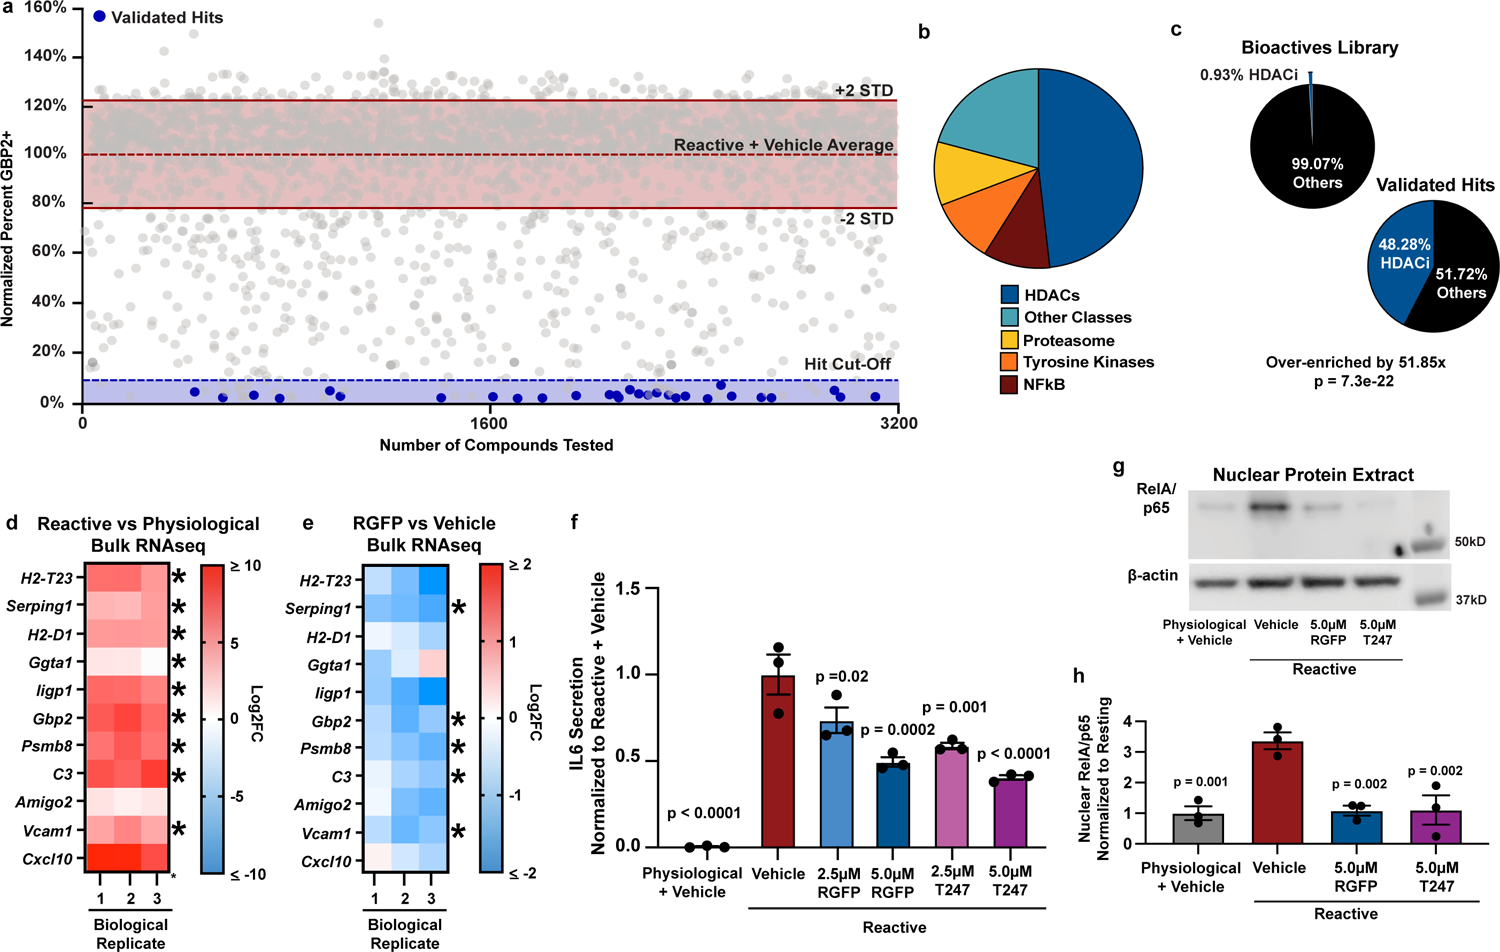
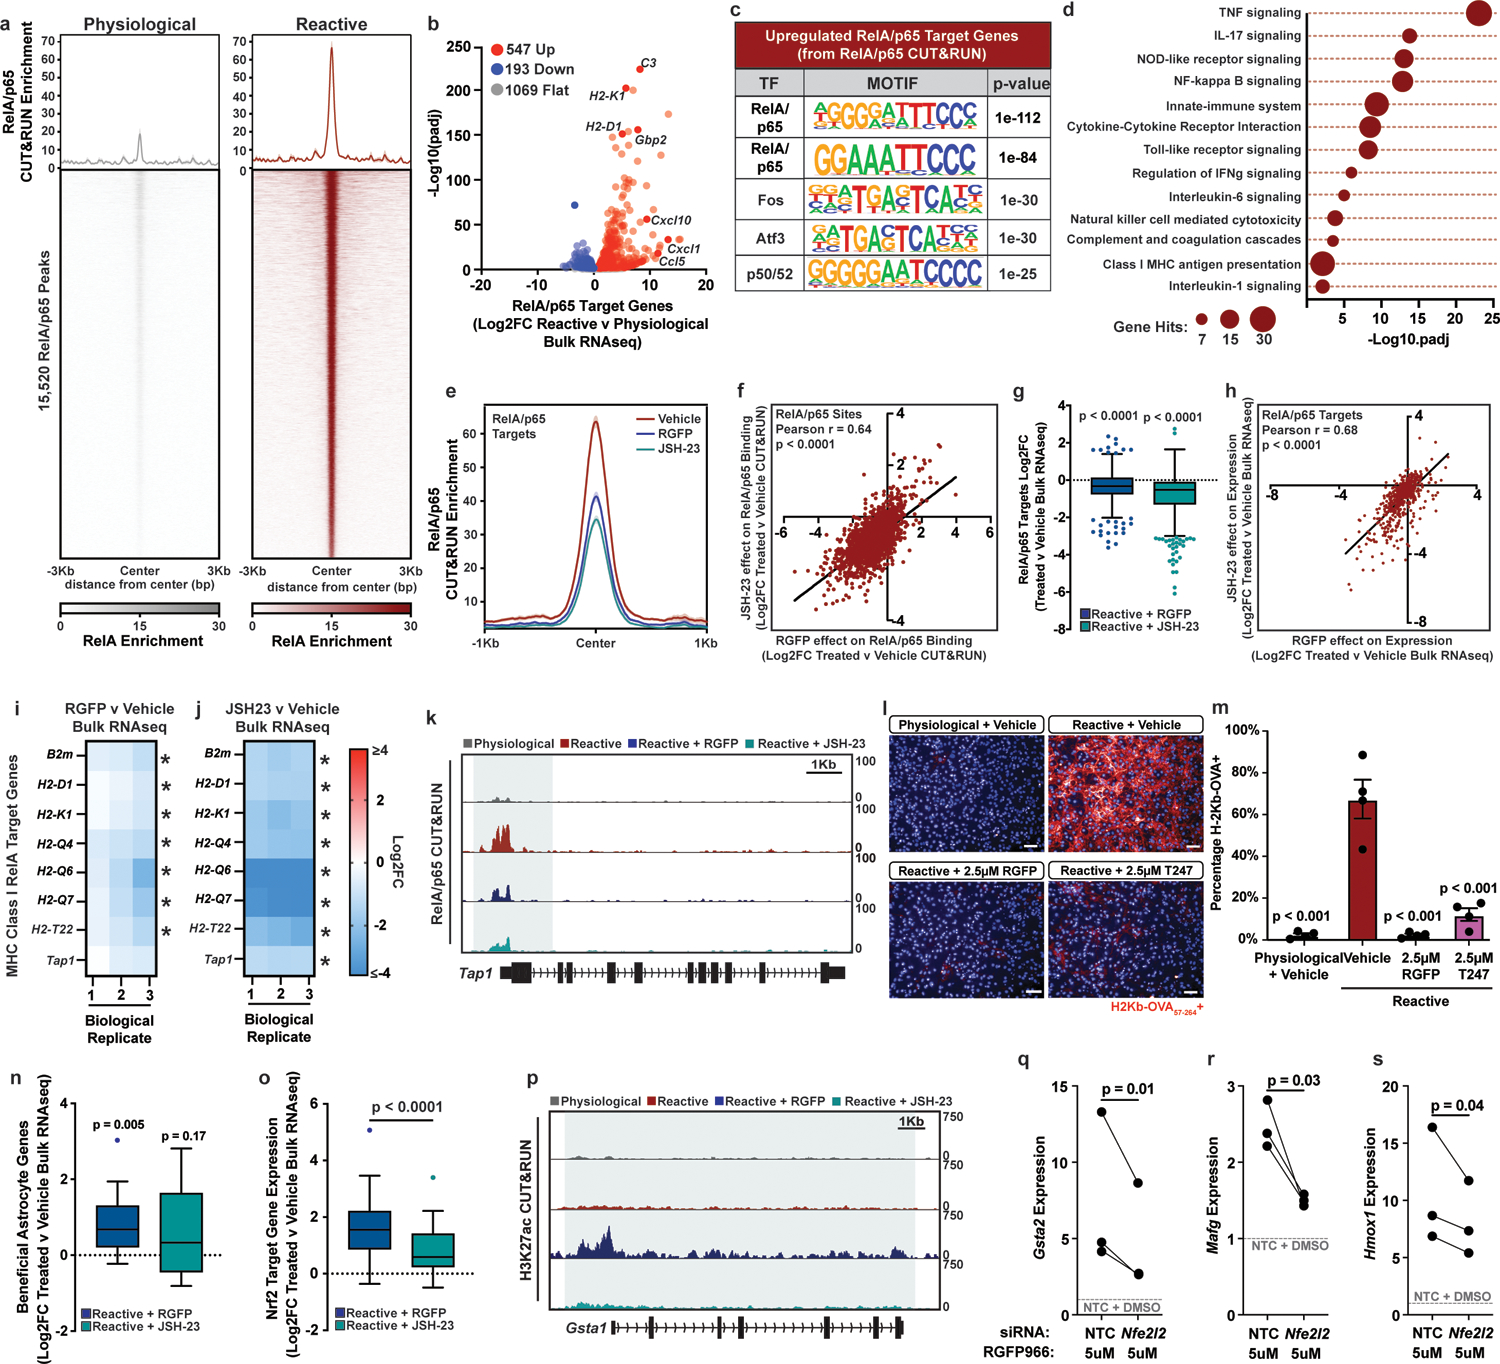
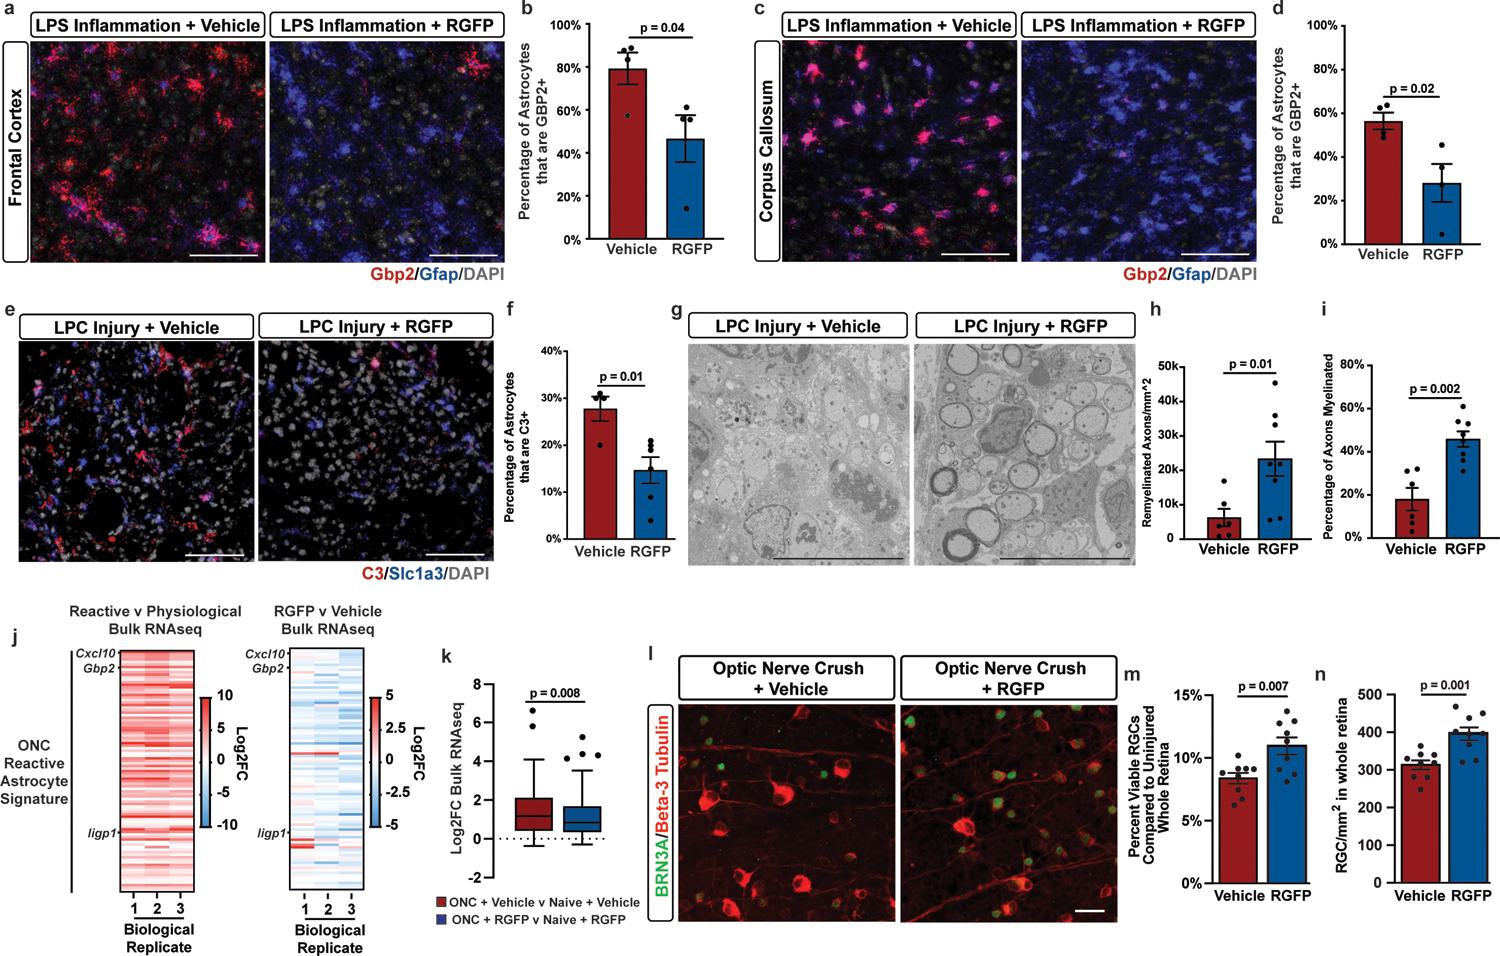
Disease, injury and aging induce pathological reactive astrocyte states that contribute to neurodegeneration. Modulating reactive astrocytes therefore represent an attractive therapeutic strategy. Here we describe the development of an astrocyte phenotypic screening platform for identifying chemical modulators of astrocyte reactivity. Leveraging this platform for chemical screening, we identify histone deacetylase 3 (HDAC3) inhibitors as effective suppressors of pathological astrocyte reactivity. We demonstrate that HDAC3 inhibition reduces molecular and functional characteristics of reactive astrocytes in vitro. Transcriptional and chromatin mapping studies show that HDAC3 inhibition disarms pathological astrocyte gene expression and function while promoting the expression of genes associated with beneficial astrocytes. Administration of RGFP966, a small molecule HDAC3 inhibitor, blocks reactive astrocyte formation and promotes neuroprotection in vivo in mice. Collectively, these results establish a platform for discovering modulators of reactive astrocyte states, inform the mechanisms that control astrocyte reactivity and demonstrate the therapeutic benefits of modulating astrocyte reactivity for neurodegenerative diseases.


Conflict of interest statement

Competing interests B.L.L.C. and P.J.T. are listed as inventors on pending patent claims filed by Case Western Reserve University covering methods and compositions for treating neurodegenerative disorders. All other authors declare no competing interests.

Figures

Extended Data Figure 1.
Extended Data Figure 1.. Purity and function of astrocyte cultures
a, Overview diagram of astrocyte isolation and enrichment protocol (images generated by BioRender). b, Phase contrast image showing prototypical astrocyte morphology from a single astrocyte culture. Scale bar is 50um. Immunofluorescence images showing expression of canonical astrocyte markers AQP4, GLT-1 (SLC1A2), and ALDH1L1 in a single astrocyte culture. Scale bar is 100um. c, Bulk RNAseq data showing high expression of astrocyte marker genes and no expression of marker genes for other CNS cell types. Data are from 3 biological replicates (independent astrocyte isolations). d, Glutamate uptake by physiological astrocytes in culture. Data presented as the mean ± s.e.m. for technical replicates (open circles) from 3 biological replicates (independent astrocyte isolations).e-h, ATACseq tracks at marker genes for CNS cell types. Chromatin is only open at astrocyte genes. i, Bulk RNAseq data showing decreased expression of Meg10 and Mertk in agreement with decreased phagocytosis of myelin debris by reactive astrocytes. Data presented as mean ± s.e.m. for n = 3 biological replicates. p-value generated by paired two-tailed t-test. j, The Log2 fold-change (Log2FC) of secreted cytokines in reactive vs physiological astrocytes conditioned media. Data presented as mean ± s.e.m for n = 3 biological replicates.
Extended Data Figure 2.
Extended Data Figure 2.. In vitro reactive astrocytes correspond to in vivo counterparts
a, Enrichment map of gene ontology terms for genes upregulated in reactive vs physiological astrocytes. b, Enrichment map of gene ontology terms for genes upregulated in physiological vs reactive astrocytes. c, Representative images of physiological astrocytes, astrocytes exposed to TIC cytokines, and astrocytes infected with TMEV and stained for double stranded RNA to show viral infection (dsRNA in green) and GBP2 (red). d, Quantification of the percentage of astrocytes that are positive for the viral marker dsRNA. Data presented as mean ± s.e.m for n = 3 biological replicates, with p-value calculated by a one-way ANOVA. e, Quantification of the percentage of astrocytes that are GBP2 positive. Data presented as mean ± s.e.m for n = 3 biological replicates, with p-value calculated by a one-way ANOVA with Dunnett correction for multiple comparisons. f, Quantitative PCR results comparing the expression of pathological reactive astrocyte markers Gbp2 and Psmb8 by physiological astrocytes, astrocytes exposed to TIC cytokines, and astrocytes infected with TMEV. p-value calculated by one-way ANOVA with Dunnett correction for multiple comparisons. g, UMAP plots from integrated single-cell RNAseq analysis of in vitro physiological and reactive astrocytes from this study with in vivo astrocytes from LPS or vehicle treated mice. h, Frequency of cells distributed across different astrocyte clusters. i, Expression of pathological reactive astrocyte genes and astrocyte marker genes in each single-cell cluster. j, Gene ontology results showing enriched terms for genes enriched in cluster 2, 6, and 7 that contain mainly astrocytes from reactive cultures and LPS treated mice. p-values generated by Benjamini-Hochberg false discovery rate.
Extended Data Figure 3.
Extended Data Figure 3.. Epigenomics of astrocyte reactivity
a, Biological (Bio) replicate ATACseq tracks for figure 2c. b, Depiction of gained, lost, and shared H3K27ac or super-enhancer peaks during the transition from physiological to reactive astrocytes. c, Biological replicate H3K27ac CUT&RUN tracks in figure 2i. d, Gene ontology analysis of genes targeted by gained super-enhancers in reactive astrocytes that are also upregulated in reactive astrocytes compared to physiological in bulk RNAseq analysis. p-values generated by Benjamini-Hochberg false discovery rate. e, Bulk RNAseq volcano plot of genes with a gained H3K27ac CUT&RUN peak (+/−5Kb of the transcription start site (TSS)) in reactive astrocytes. Log2FC and p-adj values were generated from bulk RNAseq analysis with DESEQ2 f, Bulk RNAseq volcano plot of genes with a shared H3K27ac CUT&RUN peak (+/−5Kb of the transcription start site (TSS)) in both reactive and physiological astrocytes. Log2FC and p-adj values were generated from bulk RNAseq analysis with DESEQ2 g, Bulk RNAseq volcano plot of genes with a lost H3K27ac CUT&RUN peak (+/−5Kb of the transcription start site (TSS)) in reactive astrocytes. Log2FC and p-adj values were generated from bulk RNAseq analysis with DESEQ2. h, Gene ontology analysis of genes targeted by gained H3K27ac CUT&RUN peak in reactive astrocytes that are also upregulated in reactive astrocytes compared to physiological in bulk RNAseq analysis. p-values generated by Benjamini-Hochberg false discovery rate.
Extended Data Figure 4.
Extended Data Figure 4.. High-throughput chemical screen quality control and validation of HDAC3
a, Example images of DMSO vehicle-treated reactive and physiological control wells from the phenotypic screen. Scale bar is 100um. b, Z-prime standard, and robust scores for primary screen plates. c, Percent GBP2 positive astrocytes in DMSO vehicle treated reactive and physiological control wells on each primary screen plate. Data as the mean ± s.e.m., n = 16 wells per group on each primary screen plate. d, Dose curve of primary screen hits. Data are percent of GBP2 positive cells normalized to DMSO vehicle treated reactive astrocyte control wells. n = 2 biological replicates (independent astrocyte isolations). Black data points represent toxic doses where total cell number decreased by >50% compared to vehicle treated reactive astrocyte control wells. e, Dose curve analysis of hits from primary screen with Psmb8 positivity by in situ hybridization as a secondary endpoint. Data are percent of Psmb8 mRNA positive normalized to DMSO vehicle treated reactive astrocyte control wells with an n = 1 biological replicate (independent astrocyte isolation). Black data points represent toxic doses where total cell number decreased by >50% compared to vehicle treated reactive astrocyte control wells. f, Ranked inhibition against each HDAC isozyme for validated HDAC inhibitors in the primary screen. Highlighted is HDAC as the only shared target between all HDAC inhibitor hits. Ranked efficiency was pulled from target data provided by Selleck Chemical. g, Dose curve and IC50 value for the HDAC3 specific inhibitor RGFP966 to block astrocyte reactivity with an n = 5 biological replicates. h, Dose curve and IC50 value for the HDAC3 specific inhibitor T247 to block astrocyte reactivity with an n = 2 biological replicates. i-k, Representative images and quantification of wild-type (WT) and HDAC3 knockout (KO) astrocyte cultures exposed to TIC cytokines. Scale bar is 100um. Data are mean ± s.e.m., n = 3 independent experiments, p-value by a paired t-test. l, GBP2 and PSMB8 qPCR results for human iPSC derived physiological or reactive astrocyte cultures treated with vehicle or 5uM RGFP966. Data are mean ± s.e.m., n = 4 technical replicates.
Extended Data Figure 5.
Extended Data Figure 5.. Histone acetylation does not predict HDAC3 inhibition induced gene expression changes in reactive astrocytes
a, Tukey box and whisker plot showing the average Log2 fold-change (Log2FC), from bulk RNAseq, of the top 100 upregulated genes targeted by gained super-enhancers, all genes targeted by shared super-enhancers, and the top 100 downregulated genes targeted by lost super-enhancers in pathological reactive astrocytes. Data are presented for n = 3 biological replicates. Two-tailed p-value is generated with a one-sample Wilcoxon Signed Ranked test comparing to a hypothetical median of Log2FC = 0 which would designate no difference in expression between reactive and physiological astrocytes. b, Quantification of CCL5 ELISAs performed on astrocyte conditioned media. Data presented as mean ± s.e.m for an n = 3 biological replicates with p-values compared to reactive plus vehicle control and calculated by one-way ANOVA with Dunnett correction for multiple comparisons. c, Tukey box and whisker plot showing the level of H3K27ac, from CUT&RUN, at gained, shared, and lost super-enhancer in reactive astrocytes treated with RGFP966. Data are presented for n = 3 biological replicates. Two-tailed p-value is generated with a one-sample Wilcoxon Signed Ranked test comparing to a hypothetical median of Log2FC = 0. d-e, Representative images and quantification of physiological astrocytes treated with vehicle, 5uM RGFP966, or 5uM JSH-23 and then stained for acetyl-RelA/p65 (K310). Scale bar is 100um. Data are mean ± s.e.m, n = 3 biological replicates, p-value by one-way ANOVA with Dunnett multiple comparison correction. f, Uncropped western blots for figure 3g. g, Transcription factor motifs enriched in H3K27ac CUT&RUN peaks from vehicle treated reactive astrocytes versus RGFP966 (RGFP) treated reactive astrocytes. p-values generated by HOMER. h, Transcription factor motifs enriched in H3K27ac CUT&RUN peaks from RGFP treated reactive astrocytes versus vehicle treated reactive astrocytes. p-values generated by HOMER. i, Normalized NFkB luciferase activity in Jurkat reporter cells treated with the validated hits from the primary drug screen. Data presented as percentage of NFkB activity from a single independent experiment.
Extended Data Figure 6.
Extended Data Figure 6.. HDAC3 inhibition modulates pro- and anti-inflammatory gene expression in reactive astrocytes
a, Biological (Bio) replicate tracks for RelA/p65 CUT&RUN in figure 4k. b, Enriched gene ontology terms for genes significantly upregulated in reactive astrocytes treated with RGFP. p-values generated by Benjamini-Hochberg false discovery rate. c, Enriched transcription factors targeting genes significantly upregulated in reactive astrocytes treated with RGFP. d, Biological replicate tracks for H3K27ac CUT&RUN in figure 4p.
Extended Data Figure 7.
Extended Data Figure 7.. In vivo pharmacology of RGFP966 and in vivo genetic validation of HDAC3 as a mediator of astrocyte reactivity
a, Brain concentration of RGFP966 (RGFP) 4hrs after treatment with vehicle (Veh) or 10mg/kg RGFP. Data presented as mean ± the range for n = 2 biological replicates (mice). Concentration of RGFP in brain from vehicle treated mice was below quantifiable levels (BQL). b-d, Representative images and quantification of immunohistochemistry for AcH4 in the cortex of mice treated with vehicle or 10mg/kg RGFP and then exposed to systemic LPS injections to induce neuroinflammation. Scale bar 100um. Data are mean ± s.e.m., n = 4 biological replicates (mice), p-value by unpaired two-tailed t-test e-f, Representative in situ hybridization images and quantification of untreated and LPS-exposed mice probed for the pan-reactive astrocyte marker Gfap (blue) and the reactive astrocyte marker Gbp2 (red) in the corpus callosum. Scale bar is 50um. Data are mean ± s.e.m., n = 4 biological replicates (mice), p-value by unpaired two-tailed t-test. g-m, Representative images and quantification of immunohistochemistry for GFAP (red) and IBA-1 (blue) in the cortex of mice treated with vehicle or 10mg/kg RGFP and exposed to systemic LPS or saline vehicle. Scale bar 100um. Data are mean ± s.e.m., n = 3 or 4 biological replicates (mice), p-value calculated by one-way ANOVA and Tukey multiple comparison correction. n, Diagram of astrocyte specific HDAC3 knockout mouse breeding. o-q, Representative in situ hybridization images and quantification of untreated wild-type (WT) and HDAC3 knockout (KO) mice and then probed for the pan-astrocyte marker Slc1a3 (green) and the reactive astrocyte marker C3 (red). Scale bar is 50um. Data are mean ± s.e.m., n = 3 biological replicates (mice), p-value by unpaired two-tailed t-test. r-u, Representative in situ hybridization images and quantification of wild-type and HDAC3 knockout (KO) mice exposed to systemic LPS and then probed for the pan-astrocyte marker Slc1a3 (green) and the reactive astrocyte marker C3 (red). Scale bar is 50um. Data are mean ± s.e.m., n = 4 biological replicates (mice), p-value by unpaired two-tailed t-test.
Extended Data Figure 8.
Extended Data Figure 8.. RGFP966 has no effect on generalized gliosis in the toxin-based injury model of LPC
a-b, Representative in situ hybridization images and quantification of naïve and LPC lesioned mice probed for the pan-astrocyte marker Slc1a3 (blue) and the reactive astrocyte marker C3 (red). Scale bar is 50um. Data are mean± s.e.m., n = 3 or 4 biological replicates (mice), p-value by unpaired two-tailed t-test. c-d, Representative images, and quantification of LPC lesions from vehicle or RGFP966 (RGFP) treated mice stained for IBA-1. Scale bar is 100um. Data are mean ± s.e.m., n = 4 biological replicates (mice). e-g, Representative images, and quantification of LPC lesions from RGFP966 or vehicle treated mice stained for IBA-1 (orange), CD86 (blue), and CD206 (green). Scale bar is 100um. Data are mean ± s.e.m., n = 4 or 6 biological replicates (mice). h-i, Representative images, and quantification of LPC lesion from vehicle or RGFP treated mice stained for GFAP. Scale bar is 100um. Data are mean ± s.e.m., n = 4 biological replicates (mice).
Extended Data Figure 9.
Extended Data Figure 9.. RGFP decreases gene expression associated with reactive astrocytes in ONC
a, Bulk RNAseq volcano plot of genes up and downregulated in ONC retina versus naïve retina. Log2FC and p-adj values were generated from bulk RNAseq analysis with DESEQ2. b, Gene ontology terms for enriched for genes upregulated in ONC retina versus naïve retina. p-values generated by Benjamini-Hochberg false discovery rate. c, Tukey box and whisker plot depicting how the expression of genes upregulated in ONC retina change between crushed and naïve retina in mice treated with vehicle and mice treated with 10mg/kg RGFP. Data are presented as Log2FC for n = 7 biological replicates. p-value generated by a paired two-tailed t-test. d, Tukey box and whisker plot depicting the Log2FC expression of ONC reactive astrocyte genes (same as in Figure 5k) between naïve retina treated with 10mg/kg RGFP and naïve retina treated with vehicle. Data are presented as Log2FC for n = 7 biological replicates. p-value generated with a one-sample Wilcoxon Signed Ranked test comparing to a hypothetical median of Log2FC = 0, which would designate no difference in expression. e-f, Representative images, and quantification of retinal ganglion cells (RGCs) double stained with BRN3A (green) and Beta-3 Tubulin (red) in retina from naive mice treated with vehicle or 10mg/kg RGFP966. Scale bar is 20um. Data are mean± s.e.m., n = 9 or 10 biological replicates (mice), p-value by unpaired two-tailed t-test.
Figure 1.
Figure 1.. A reactive astrocytes cellular platform.
a, UMAP plots of cell-type specific marker expression from single-cell RNAseq of primary physiological astrocytes. Data represents n = 1,558 cells. b, UMAP plot of physiological and pathological reactive astrocytes (abbreviated to reactive in figures) single-cell RNAseq. Additional UMAP plots showing expression levels for the pathological reactive astrocyte markers C3 and Gbp2. c-e, Representative images and quantification of in situ hybridization with probes against the pathological reactive astrocyte transcripts C3 and Serping1. Scale bar is 50um. Data as mean ± s.e.m, n = 3 biological replicates (independent astrocyte isolation), p-value by paired two-sided t-test. f-h, Gene set enrichment analysis (GSEA) comparing pathological reactive astrocytes to the top 100 genes upregulated in astrocytes from single nucleus RNAseq data from f, Alzheimer’s, g, Huntington’s, and h, Parkinson’s disease patient brain tissue. i-j, Representative images, and quantification of cultures exposed to the OVA257–264 peptide and then stained for MHC Class I bound to OVA257–264 (H-2Kb+OVA257–264) in red. Scale bar is 50um. Data as mean ± s.e.m, n = 3 biological replicates, p-value by paired two-sided t-test. k-l, Representative images, and quantification of astrocytes exposed to pHrodo-labelled myelin debris (orange) with cell bodies visualized using CMFDA (green). Scale bar is 50um. Data as mean ± s.e.m, n = 3 biological replicates, p-value by paired two-sided t-test. m-n, Representative images, and quantification of oligodendrocytes co-cultured with physiological or reactive astrocytes and stained for the mature oligodendrocyte marker O1 (green). Scale bar is 100um. Data as mean ± s.e.m, n = 3 biological replicates, p-value by paired two-sided t-test. o-p, Representative images of oligodendrocytes co-cultured with physiological or reactive astrocytes and stained for the mature oligodendrocyte marker MBP (red). Scale bar is 100um. Data as mean ± s.e.m, n = 3 biological replicates, p-value by paired two-sided t-test.
Figure 2.
Figure 2.. Extensive chromatin remodeling during astrocyte reactivity.
a, Aggregate heatmaps of ATAC enrichment at ATACseq peaks in physiological and reactive astrocytes. b, Bulk RNAseq volcano plot of genes with a gained ATAC peak (± 5Kb of the transcription start site (TSS)) in reactive astrocytes. Log2FC and adjusted p-values were calculated with DESeq2. c, Example track of the average ATAC signal at C3 in physiological and reactive astrocytes with a gained reactive ATAC peak shaded. d, Enriched terms from gene ontology analysis of genes targeted by a gained ATAC peak and with increased expression in reactive astrocytes. p-values generated by Benjamini-Hochberg false discovery rate. e, Transcription factor motifs enriched in gained ATAC peaks in reactive astrocytes. p-values for enriched motifs were generated by HOMER. f-g, Hockey stick plot depicting H3K27ac enrichment at enhancers (grey) and super-enhancers (black), and the nearest annotated target genes, in reactive astrocytes from two independent astrocyte isolations. Genes in black are targeted by shared super-enhancers, while Ccl5 in red is targeted by a gained super-enhancer. h, Example track of average H3K27ac CUT&RUN and ATAC signal at the gained super-enhancer target gene Ccl5 in physiological and reactive astrocytes. i, Tukey box and whisker plot showing the average Log2FC between pathological reactive and physiological astrocytes for genes targeted by gained, shared, and lost super-enhancers (SE) in pathological reactive astrocytes. Data are presented for n = 3 biological replicates. p-value is generated with a two-tailed one-sample Wilcoxon Signed Ranked test comparing to a hypothetical median of Log2FC = 0, which would designate no difference in expression between reactive and physiological astrocytes.
Figure 3.
Figure 3.. Phenotypic screen identifies HDAC3 as a regulator of pathological reactive astrocytes.
a, Scatter plot of primary screen results displayed as percent GBP2 positive, normalized to reactive astrocyte plus vehicle controls for all non-toxic chemicals. Validated hit chemicals colored in blue. The dashed blue line represents the hit cut-off at a ≥90% decrease in GBP2- positive astrocytes compared to reactive astrocyte plus vehicle controls. Dashed red line represents the average percent GBP2 positive for reactive astrocytes plus vehicle set at 100%. Solid lines represent +/− 2 standard deviations from the mean of reactive plus vehicle control wells. b, Pie chart depicting the chemical class breakdown of all 29 validated chemical hits. c, Pie charts depicting the frequency of HDAC inhibitor compounds enriched in primary screen validated hit list compared to the primary screen chemical library as a whole, showing that HDAC inhibitors are significantly enriched in the validated hit list. p-value generated by a two-tailed hypergeometric test. d-e, Heatmap of the Log2 fold-change (Log2FC) from bulk RNAseq analysis of reactive vs physiological, and RGFP966 (RGFP) vs vehicle (DMSO) treated reactive astrocytes. Red is upregulated and blue is downregulated. Data are presented as Log2FC for n = 3 biological replicates with asterisks denoting a p < 0.05 calculated by DESeq2. f, Quantification of IL6 ELISAs performed on astrocyte conditioned media. Data presented as mean ± s.e.m for an n = 3 biological replicates with significance calculated compared to reactive plus vehicle control. p-value generated by one-way ANOVA with Dunnett multiple comparison correction. g, Representative western blot image of nuclear protein extracts from physiological astrocytes, reactive astrocytes, and reactive astrocytes treated with either of the HDAC3 inhibitors RGFP966 or T247 probed for RelA/p65 and β-Actin. h, Quantification of experiments represented in g. Data are presented as mean ± s.e.m for an n = 3 biological replicates (independent astrocyte isolations). p-value generated by one-way ANOVA with Dunnett multiple comparison correction.
Figure 4.
Figure 4.. HDAC3 mediates a switch between pro-inflammatory and anti-inflammatory gene expression by decreasing RelA/p65 signaling.
a, Aggregate profile of RelA/p65 DNA binding in physiological and reactive astrocytes. b, Bulk RNAseq volcano plot of RelA/p65 target genes. Log2FC and p-adj values were generated with DESEQ2 with an n = 3 biological replicates (independent astrocyte isolations). c, Transcription factor motifs under RelA/p65 peaks at genes upregulated in reactive astrocytes. p-values generated by HOMER. d, Gene ontology for RelA/p65 target genes significantly upregulated in reactive astrocytes. p-values generated by Benjamini-Hochberg false discovery rate. e, Aggregate profile of RelA/p65 binding at RelA/p65 target genes in reactive astrocytes plus vehicle, RGFP966, or JSH-23. f, Correlation between RGFP966 and JSH-23 effect on RelA/p65 binding at RelA/p65 targets in reactive astrocytes. r and two-tailed p-value by Pearson correlation. g, Tukey box and whisker plots depicting RGFP966 and JSH-23 effect on expression of RelA/p65 target genes upregulated in reactive astrocytes. Data are Log2FC for n = 3 biological replicates. Two-tailed p-values by one-sample Wilcoxon Signed Ranked test. h, Correlation between RGFP966 and JSH-23 effect on expression of RelA/p65 target genes that are upregulated in reactive astrocytes. r and two-tailed p-value calculated by Pearson correlation. i-j, RGFP966 and JSH-23 effect on MHC Class I genes expression in reactive astrocytes. Data are Log2FC, n = 3 biological replicates, * p < 0.05 by DESeq2. k, Example CUT&RUN track of the RelA/p65 target gene Tap1. l-m, Representative images and quantification of astrocytes exposed to the OVA257–264 peptide and stained for MHC Class I bound to OVA257–264 (H-2Kb+OVA). Scale bar is 50μm. Data are mean ± s.e.m., n = 4 biological replicates, p-values by one-way ANOVA with Dunnett correction for multiple comparisons. n-o, Tukey box and whisker plot depicting RGFP966 and JSH-23 effect on beneficial astrocyte and NRF2 target gene expression in reactive astrocytes. Data are Log2FC, n = 3 biological replicates, p-values by one-sample Wilcoxon Signed Ranked test. p, Example CUT&RUN tracks of the NRF2 target gene Gsta1. q-s, qPCR showing expression of NRF2 genes Gsta2, Mafg, and Hmox1 in physiological astrocytes treated with RGFP966 and non-targeting control (NTC) or NRF2 (Nfe2l2) siRNAs. Data are mean ± s.e.m. n = 3 biological replicates, p-value by paired two-tailed t-test.
Figure. 5
Figure. 5. HDAC3 inhibition blocks reactive astrocyte formation in vivo and promotes neuroprotection.
a-d, Representative images and quantification of Gbp2 and Gfap in situ hybridization from the frontal cortex or corpus callosum of LPS exposed mice treated with vehicle or 10mg/kg RGFP. Scale bar is 100um. Data presented as mean ± s.e.m for n = 4 mice with p-value generated by unpaired two-tailed t-test. e-f, Representative images and quantification of the reactive astrocyte marker C3 and pan-astrocyte marker Slc1a3 in situ hybridization in the dorsal column of LPC lesioned mice at 12 days post lesion and treated with vehicle or 10mg/kg RGFP. Scale bar is 50um. Data are presented as the mean ± s.e.m for n = 4 or 6 mice. p-value generated by unpaired two-tailed t-test. g-i, Representative electron microscopy (EM) images and quantification of remyelinated axon density and percentage. Scale bar is 10um. Data is presented as mean ± s.e.m. for n = 6 or 8 mice with p-values generated by unpaired two tailed t-test. j, Heatmaps depicting Log2FC of a previously identified set of 100 reactive astrocyte genes in single-cell RNAseq analysis of ONC retina. k, Tukey box and whisker plot depicting the Log2FC of ONC reactive astrocyte genes in ONC versus naïve retina from mice treated with vehicle or 10mg/kg RGFP966. n = 7 mice with p-value generated by a paired two-tailed t-test. l-n, Representative images and quantification of RGCs stained with BRN3A and Beta-3 Tubulin in the retina from ONC mice treated with vehicle or 10mg/kg RGFP966. Scale bar is 20um. Data is presented as mean ± s.e.m for n = 9 or 10 mice per group with p-values generated by unpaired two-tailed t-test.

References

    1. Hasel P & Liddelow SA Astrocytes. Curr Biol 31, R326–R327 (2021). - PubMed
    1. Allen NJ & Eroglu C Cell Biology of Astrocyte-Synapse Interactions. Neuron 96, 697–708 (2017). - PMC - PubMed
    1. Nagai J, et al. Behaviorally consequential astrocytic regulation of neural circuits. Neuron 109, 576–596 (2021). - PMC - PubMed
    1. Guttenplan KA, et al. Neurotoxic reactive astrocytes induce cell death via saturated lipids. Nature (2021). - PubMed
    1. Di Giorgio FP, Carrasco MA, Siao MC, Maniatis T & Eggan K Non-cell autonomous effect of glia on motor neurons in an embryonic stem cell-based ALS model. Nat Neurosci 10, 608–614 (2007). - PMC - PubMed