. 2024 Mar;6(3):473-493.
doi: 10.1038/s42255-024-00987-z. Epub 2024 Feb 20.

Reciprocal activity of AgRP and POMC neurons governs coordinated control of feeding and metabolism

Affiliations

Reciprocal activity of AgRP and POMC neurons governs coordinated control of feeding and metabolism

Alain J De Solis et al. Nat Metab. 2024 Mar.

Abstract

Agouti-related peptide (AgRP)-expressing and proopiomelanocortin (POMC)-expressing neurons reciprocally regulate food intake. Here, we combine non-interacting recombinases to simultaneously express functionally opposing chemogenetic receptors in AgRP and POMC neurons for comparing metabolic responses in male and female mice with simultaneous activation of AgRP and inhibition of POMC neurons with isolated activation of AgRP neurons or isolated inhibition of POMC neurons. We show that food intake is regulated by the additive effect of AgRP neuron activation and POMC neuron inhibition, while systemic insulin sensitivity and gluconeogenesis are differentially modulated by isolated-versus-simultaneous regulation of AgRP and POMC neurons. We identify a neurocircuit engaging Npy1R-expressing neurons in the paraventricular nucleus of the hypothalamus, where activated AgRP neurons and inhibited POMC neurons cooperate to promote food consumption and activate Th+ neurons in the nucleus tractus solitarii. Collectively, these results unveil how food intake is precisely regulated by the simultaneous bidirectional interplay between AgRP and POMC neurocircuits.


Conflict of interest statement

J.C.B. is cofounder and shareholder of Cerapeutix and has received research funding through collaborations with Sanofi Aventis and Novo Nordisk, and consultancy fees from Eli Lilly and Company and Novo Nordisk, which did not affect the content of this article. The other authors declare no competing interests.

Figures
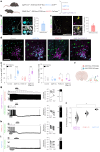
Fig. 1
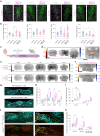
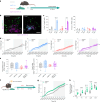
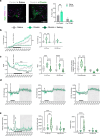
Fig. 1. Cre and Dre recombinases drive specific expression of opposite chemogenetic receptors in AgRP and POMC neurons.
a, Breeding strategy and experimental groups. b, Representative images and quantification of Cre-mediated hM3DGq-eGFP expression in AgRP neurons (n = 7 mice) c, Representative image and quantification of Dre-mediated hM4DGi-ZsGreen expression in POMC neurons (n = 7 mice). d, Representative images showing Fos (cyan) colocalization with AgRP+ (magenta) and POMC+ (green) neurons in experimental groups treated with CNO for 1 h. e, Quantification of percentage of AgRP+ and POMC+ neurons colocalized with Fos mRNA 1 h after vehicle or CNO injection. AgRP+ neurons: ***P = 0.0007 AgRP-Gq, ***P = 0.0001 AgRP-Gq;POMC-Gi, vehicle versus CNO; POMC+ neurons: *P = 0.0375 POMC-Gi, *P = 0.473 AgRP-Gq;POMC-Gi, vehicle versus CNO. Data are presented as the mean ± s.e.m. of the percentage of AgRP or POMC neurons in one ARC hemisection (n = 4 and 4 control mice; 4 and 5 AgRP-Gq mice; 4 and 5 POMC-Gi mice; 5 and 7 AgRP-Gq;POMC-Gi mice, vehicle versus CNO, respectively, for each group). Statistical significance was determined by two-way analysis of variance (ANOVA) followed by Bonferroni’s test. Box plots indicate the median ± minimum/maximum values and include data points of individual mice. Scale bar, 100 µm. f, Scheme of experimental design. gi, Perforated patch-clamp recordings and rate-histograms displaying the effects of 3 µM CNO on POMC-ZsGreen+ and AgRP-tdTomato+ neurons. Bar graphs represent the proportion of neurons classified as CNO responders at the individual-cell level (Methods): excited (exc, white), not responsive (nr, grey) and inhibited (inh, black). All recordings were performed in the presence of glutamate and GABA receptor blockers, except i. g, Recordings from AgRP-tdTomato+ neurons (upper) and from POMC-ZsGreen+ neurons (lower) from AgRP-Gq:POMC-Gi mice (n = 6 cells). h, Recordings from POMC-ZsGreen+ neurons from POMC-Gi mice (n = 11 cells). i, Recording from POMC-ZsGreen+ neurons from AgRP-Gq* mice (n = 10 cells) in the absence of synaptic blockers. The dashed line serves to emphasize the effect. j, Summarized effects of 3 µM CNO-mediated DREADD activation in POMC neurons. Data are displayed as the mean ± s.e.m. of changes in membrane potential calculated from all recordings shown in gi. All population responses measured in the respective experimental groups were statistically significant AgRP-Gq:POMC-Gi (−10.1 ± 2.9 mV, n = 6, P = 0.03, Wilcoxon matched-pairs signed-rank test), POMC-Gi (−5.6 ± 1.5 mV, n = 11, P = 0.004, two-tailed paired t-test) and AgRP-Gq (−1.6 ± 0.6 mV, n = 10, P = 0.03, two-tailed paired t-test). Comparison of the effect sizes between groups showed a significant difference in POMC neuron hyperpolarization between AgRP-Gq:POMC-Gi and AgRP-Gq* mice (P = 0.01; Kruskal–Wallis test with Dunn’s multiple-comparison test). Based on the observed data, the filled grey curves indicate the resampled distribution (5,000 bootstrap samples). Figure 1a,f created with BioRender.com. Source data
Fig. 2
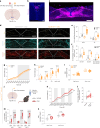
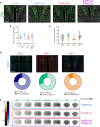
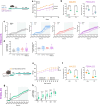
Fig. 2. Coordinated effect in the regulation of food intake from the interaction of AgRP and POMC neurocircuits.
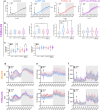
a, Cumulative food intake in male mice treated with vehicle and CNO in crossover experimental design. Dark cycle is indicated by the grey rectangle. ***P < 0.004 AgRP-Gq and ***P = 0.009 POMC-Gi, ****P < 0.0001 AgRP-Gq;POMC-Gi, vehicle versus CNO. b, Quantification of delta food intake (∆ = CNO − vehicle) during the indicated time intervals. Control versus AgRP-Gq: *P = 0.0292 (2 h) and *P = 0.0193 (4 h); control versus POMC-Gi: *P = 0.012 (4 h); control versus AgRP-Gq;POMC-Gi: ***P = 0.0003 (2 h), ****P < 0.0001 (4 h) and ***P = 0.0009 (light cycle) c, Average RER during light and dark cycles in male mice treated with vehicle or CNO. ****P < 0.0001, vehicle versus CNO. d, Quantification of carbohydrate and lipid utilization during light-cycle period by male mice treated with CNO and vehicle, calculated as: *P = 0.0359 for control, *P = 0.0121 for POMC-Gi, ****P < 0.001 for AgRP-Gq and AgRP-Gq;POMC-Gi groups, vehicle versus CNO. e, RER curves in male mice treated with CNO without access to food during the light cycle, following by refeeding at the beginning of the dark cycle. Black bar indicates the 4-h period after CNO injection. f, Average RER during the 4-h period. **P = 0.0021 and **P = 0.0067 for control versus AgRP-Gq and AgRP-Gq;POMC-Gi, respectively. g, Quantification of carbohydrate and lipid usage during the 4-h fasting period. Carbohydrates: *P = 0.0137 control versus AgRP-Gq;POMC-Gi; lipids: *P = 0.0222 control versus AgRP-Gq. h, Total activity counts during the 4-h period. *P = 0.026 and *P = 0.0259 for control versus AgRP-Gq and AgRP-Gq;POMC-Gi, respectively. Data represent the mean ± s.e.m. of the biological replicates for each group: ad: n = 11 control, 10 AgRP-Gq, 12 POMC-Gi and 13 AgRP-Gq;POMC-Gi male mice; ej: n = 7 control, 6 AgRP-Gq, 5 POMC-Gi and 8 AgRP-Gq;POMC-Gi male mice. Statistical significance was determined by two-way ANOVA followed by Bonferroni test for a and ce; and one-way ANOVA followed by Tukey’s multiple-comparison test for b and fh. Data from female mice are displayed in Extended Data Fig. 3. Source data
Fig. 3
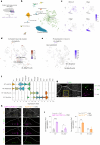
Fig. 3. Npy1R+ neurons in PVH respond to simultaneous neuronal input from AgRP and POMC neurons.
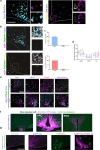
a, Representative images (a) and quantification of the percentage of Mc4r, Pdyn, Glp1r and Npy1r expressing-neurons in PVH area that colocalize with Fos mRNA in CNO-treated mice for 1 h (b). *P = 0.0442 AgRP-Gq versus POMC-Gi in MC4R+ analysis, *P = 0.0402 control versus AgRP-Gq;POMC-Gi in Npy1R+ analysis. c, Schematic of experimental protocol for unbiased whole-brain Fos analysis. d, Representative images from Fos volumetric comparison (n = 4 mice per group; Methods) between CNO-treated control versus AgRP-Gq mice, showing coronal, sagittal and transcranial sections. Insert shows a coronal section at the PVH area, with increased Fos signal in the thalamus (orange) area and decreased Fos signal in the periventricular area (blue). e, Representative coronal images of the Fos volumetric comparisons between AgRP-Gq versus AgRP-Gq;POMC-Gi mice (upper) and POMC-Gi versus AgRP-Gq;POMC-Gi group (lower). f, Detailed image of Fos volumetric analysis at the coronal DVC area for each previous comparison. g, Representative images of medial (mNTS) and posterior NTS/AP (pNTS) areas from the DVC complex. h, Quantification of Fos protein expression in the DVC area from CNO-treated mice for 1 h. **P = 0.005 AgRP-Gq;POMC-Gi versus rest of groups in the mNTS area, *P = 0.0385 AgRP-Gq;POMC-Gi versus control and AgRP-Gq group in the pNTS area; and *P = 0.0362 AgRP-Gq;POMC-Gi versus control in the AP area. i, Quantification of cells expressing Fos mRNA in pNTS and AP areas from CNO-treated mice for 1 h. *P = 0.0184 AgRP-Gq;POMC-Gi versus AgRP-Gq and POMC-Gi groups, ***P = 0.0004 AgRP-Gq;POMC-Gi versus control. j, Representative FISH images of the pNTS area showing the colocalization of Slc17a6 (blue) and Slc32a1 (red) markers in Fos+ (yellow) neurons. k, Quantification of Fos+ neurons that co-express Slc17a6, Slc32a1 or none of these genes in the pNTS area. *P = 0.0141 AgRP-Gq;POMC-Gi versus control and AgRP-Gq for Slc17a6, *P = 0.059 AgRP-Gq;POMC-Gi versus rest of the groups for Slc32a1. Data are the average ± s.e.m. of the percentage of positive cells per hemisection of PVH area in b; and the mean ± s.e.m. of total positive cells per hemisection of NTS area in h, i and k. Biological replicates are: b, n = 6 mice per group for MC4R+ and Npy1R+, and 5 for Pdyn+ and Glp1R+ analysis; ce, n = 4 mice per group; h, n = 5 control, 5 AgRP-Gq, 5 POMC-Gi and 6 AgRP-Gq;POMC-Gi mice; i and k, n = 4 control, 4 AgRP-Gq, 4 POMC-Gi and 5 AgRP-Gq;POMC-Gi mice. Box plots indicate the median ± minimum/maximum values and include data points of individual mice. Statistical significance was determined by one-way ANOVA followed by Tukey’s test for b, and two-way ANOVA followed by Sidak’s test for h, and Tukey’s test for i and k. White scale bar in a, g and j , 100 µm. Black scale bar in df, 1,500 µm. Figure 3c created with BioRender.com. IHC, immunohistochemistry; LSFM, light sheet fluorescence microscopy. Source data
Fig. 4
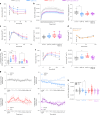
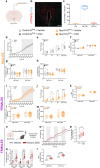
Fig. 4. Inhibition of Npy1RPVH neurons activates glutamatergic and GABAergic neurons at the NTS area and promotes food intake in male mice.
a, Schematic of AAV delivery into the PVH area of Npy1R-Cre+/− mice. b, Representative image of AAV-Flex-tdTomato injection site into the PVH area (n = 3 independent replicates). c, Image of posterior NTS/AP area showing axonal projections from Npy1RPVH-tdTomato+ neurons (n = 2 independent replicates). d, Representative FISH images of pNTS area showing the colocalization of Fos (yellow) and Slc17a6 (cyan) or Slc32a1 (red) markers in control-GiPVH and Npy1R-GiPVH mice treated with CNO for 1 h in the absence of food. e, Quantification of total Fos+ cells in the pNTS and AP areas in control-GiPVH (grey bars, n = 3 vehicle-treated and 6 CNO-treated mice) and Npy1R-GiPVH mice (orange bars, n = 5 vehicle-treated and 6 CNO-treated mice) after vehicle (open bars) or CNO injection (solid bars). **P = 0.022 and ****P < 0.001. f, Quantification of the total Fos+ cells that co-expressed Slc17a6 and Slc32a1 markers in pNTS area after vehicle or CNO injection. (n = 3 vehicle-treated and 6 CNO-treated control-GiPVH mice; and n = 5 vehicle-treated and 6 CNO-treated Npy1R-GiPVH mice). *P = 0.0164, **P = 0.0052 and ****P < 0.001. g, Cumulative food intake during 24 h in ad libitum-fed Npy1R-GiPVH mice treated with vehicle (open dots) and CNO (solid dots; n = 9 male mice), *P = 0.0253. h, Quantification of delta food intake (∆ = CNO − vehicle) at different intervals after vehicle or CNO injection in Npy1R-GiPVH mice (n = 9 male mice), *P = 0.013 and ****P < 0.001. i, Average of RER in light and dark cycles from Npy1R-GiPVH mice treated with vehicle or CNO (n = 9 male mice). j, Scheme of chronic CNO treatments in Npy1R-GiPVH mice. k, Cumulative food intake along 3 d in mice treated chronically with CNO or vehicle in drinking water (n = 10 male mice) **P = 0.0026. l, Percentage of body weight gain after 3 d chronic treatment with vehicle or CNO (n = 15 male mice), **P = 0.0016. m, Average of food intake during light and dark cycles along the 3-d chronic treatment with vehicle or CNO in drinking water (n = 10 male mice), **P = 0.0051, ****P < 0.001. n, Average respiratory coefficient (RER) from 3 d of chronic treatment during light and dark cycles (n = 10 male mice), ****P < 0.0001. Data are presented as the average ± s.e.m. for each biological replicate. Box plots indicate the median ± minimum/maximum and include data points of individual mice. Statistical significance was determined by a two-tailed paired t-test for l; two-way ANOVA followed by Tukey’s test for e, f and n; and Bonferroni’s test for gm. Scale bar, 100 µm. Figure 4a,j created with BioRender.com. Data from female mice are displayed in Extended Data Fig. 6. Source data
Fig. 5
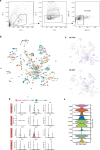
Fig. 5. Th+ neurons are activated in the posterior NTS area by the interplay of AgRP and POMC neurocircuits.
a, Schematic of the single-nucleus sequencing experiment from hindbrain samples. b, UMAP visualization of cell-type composition of hindbrain single-nucleus sequencing data (n = 2 control and 2 AgRP-Gq;POMC-Gi mice). c, UMAP showing the distribution of main cell-type markers. Colour corresponds to log-normalized expression d, UMAP highlighting the top activated (red) or inhibited (blue) neuronal clusters. Colour displays a score based on differential gene expression between AgRP-Gq:POMC-Gi and control mice of ten core IEGs (Methods). e, UMAP showing the expression of the Th gene in neuronal clusters. f, Violin plot of expression level of main marker genes associated with the selected Th+ and Dbh+ clusters. The asterisk denotes clusters with higher-ranking IEGs. g, Representative image showing the spatial distribution of neurons that express Th+, Dbh+ and Th+Dbh+ by mRNA FISH in the posterior NTS area (n = 3 mice per group). h, Representative images showing the distribution and colocalization of Fos+ (yellow) neurons that express Th+ (magenta) and Dbh+ (green) from AgRP-Gq;POMC-Gi and Npy1R-GiPVH mice treated with CNO for 1 h. i, Quantification of Fos+ colocalization with total Th+ and Th+Dbh+ neurons in posterior NTS from AgRP-Gq;POMC-Gi and Npy1R-GiPVH mice relative to their respective control (n = 3 mice per group), *P = 0.0448, **P = 0.0011 and ***P = 0.0004. Data represent the mean ± s.e.m. for each group and treatment. Statistical significance was determined by two-way ANOVA followed by Bonferroni’s multiple-comparison test. Scale bar, 100 µm. Figure 5a created with BioRender.com. Source data
Fig. 6
Fig. 6. Insulin sensitivity and liver SNA are controlled by the antagonistic interplay between the AgRP and POMC neurocircuits in male mice.
a, Insulin tolerance test performed in ad libitum-fed male mice treated with CNO for 1 h before insulin injections. *P = 0.0125 at 15 min and **P = 0.0094 at 30 min in AgRP-Gq versus control mice. b, Curves of 18FDG uptake in BAT tissue (right) from male mice treated with CNO for 1 h and AUC quantification of 18FDG uptake (left) during 10 min in BAT tissue from male mice. *P = 0.0234 AgRP-Gq versus control. c, Glucose tolerance test and quantification of AUC in 16-h-fasted male mice treated with CNO for 1 h before glucose injection. *P = 0.0309 at 90 min and **P = 0.0487 at 120 min in POMC-Gi versus control. d, Insulin tolerance test performed in ad libitum-fed male control-GiPVH (grey lines) and Npy1R-GiPVH (orange lines) male mice. e, Changes in glucose levels during 1 h after CNO injection in ad libitum-fed and 16-h fasted mice, *P = 0.0377 POMC-Gi versus control in fasting, **P = 0.0028 AgRP-Gq;POMC-Gi versus control and ****P < 0.0001 POMC-Gi versus control. f, Glucose levels and quantification of AUC during a pyruvate tolerance test performed in 16-h-fasted male mice after 1 h CNO injection. *P = 0.0418 POMC-Gi versus control, **P = 0.0021 AgRP-Gq versus control, and *P = 0.0199 POMC-Gi versus control in AUC. g, Changes in hepatic SNA after intravenous (i.v.) administration of vehicle or CNO (1 mg per kg body weight) in anaesthetized mice. Data are presented as the mean with 95% confidence interval. h, Quantification of the AUC of changes in liver SNA. *P = 0.0273 vehicle versus CNO in AgRP-Gq group. Data are presented as the average ± s.e.m. for each mouse, except on g. Box plots indicate the median ± minimum/maximum and include data points of individual mice. Biological replicates are: a, n = 20 control, 12 AgRP-Gq, 15 POMC-Gi and 13 AgRP-Gq;POMC-Gi male mice; b, n = 7 control, 9 AgRP-Gq, 12 POMC-Gi and 8 AgRP-Gq;POMC-Gi male mice; c, n = 16 control, 13 AgRP-Gq, 11 POMC-Gi and 14 AgRP-Gq;POMC-Gi male mice; d, n = 5 control-Gi and 9 Npy1R-Gi male mice; e, n = 13 control, 12 AgRP-Gq, 10 POMC-Gi and 11 AgRP-Gq;POMC-Gi male mice; f, n = 9 control, 8 AgRP-Gq, 10 POMC-Gi and 12 AgRP-Gq;POMC-Gi male mice; g and h: n = 9 control, 9 AgRP-Gq, 7 POMC-Gi and 5 AgRP-Gq;POMC-Gi mice. Statistical significance was determined by one-way ANOVA followed by Tukey’s multiple-comparison test for b, c and h; two-way ANOVA followed by Tukey’s multiple-comparison test for a, e and f, and by Bonferroni’s multiple-comparison test for c, d and g. Data from female mice are displayed in Extended Data Fig. 8. Source data
Fig. 7
Fig. 7. Obesity disrupts the coordinated regulation from AgRP and POMC neurocircuits over food intake and insulin sensitivity in male mice.
a, Scheme for HFD-induced obesity. b, Representative images of the ARC area from AgRP-Gq;POMC-Gi HFD-fed mice treated with vehicle or CNO showing the colocalization of Fos mRNA (cyan) with Agrp (magenta) and Pomc (green) neurons. c, Percentage of Fos colocalization on total AgRP (left) and POMC (right) neurons ***P = 0.0001 AgRP-Gq;POMC-Gi vehicle versus CNO; and ****P < 0.0001 AgRP-Gq vehicle versus CNO data represent the average ± s.e.m. of cell counts per hemisection from n = 3 mice for each group and treatment. d, Cumulative food intake curves from HFD-fed male mice treated with vehicle or CNO at the beginning of the light phase *P = 0.0362 for POMC-Gi, vehicle versus CNO, and **P = 0.0095 AgRP-Gq;POMC-Gi, vehicle versus CNO. e, Delta food intake (Δ = CNO – vehicle) for the 0–4-h interval and during the light cycle from HFD-fed male mice. f, Schematic of experimental design in Npy1R-GiPVH mice. g, Cumulative food intake curves from HFD-fed male Npy1R-GiPVH mice treated with vehicle or CNO, **P = 0.0024 vehicle versus CNO. h, Food intake at time intervals in HFD-fed Npy1R-Gi male mice, ****P < 0.0001 vehicle versus CNO. Data are represented as the average ± s.e.m. per mouse and treatment from the following biological replicates: d and e, n = 6 control, 6 AgRP-Gq, 6 POMC-Gi and 8 AgRP-Gq;POMC-Gi HFD-fed male mice; g and h, n = 9 HFD-fed Npy1R-Gi male mice. Box plots indicate the median ± minimum/maximum and include data points of individual mice. Statistical significance was determined by one-way ANOVA followed by Tukey’s test for e, two-way ANOVA followed by Sidak’s multiple-comparison test for c, d and h and Bonferroni’s test for g. Scale bar, 100 µm. Figure 7a,f created with BioRender.com. Data from female mice are displayed in Extended Data Fig. 9c,d. Source data
Extended Data Fig. 1
Extended Data Fig. 1. Selective expression of Cre- and Dre- recombinases in AgRP and POMC neurons.
a, Representative images of exclusive localization of Cre recombinase (magenta) on AgRP+ neurons (cyan) and Dre recombinase (green) on POMC+ neurons (yellow) (n = 4 mice). b, Representative images showing the expression of egfp (magenta) and Zsgreen (green) mRNA, attached markers of DREADDs hM3DGq and hM4DGi, respectively, together with Fos mRNA (cyan) in sections from CNO-treated AgRP-Gq;POMC-Gi mice (n = 7 mice/group). c, Quantification of the percentage of AgRP and POMC neurons that co-express egfp or Zsgreen markers, (n = 3 AgRP-Gq and 4 AgRP-Gq;POMC-Gi mice for upper panel, 3 POMC-Gi and 4 AgRP-Gq;POMC-Gi mice for lower panel). d, Quantification of total cell counts expressing Agrp, P or Fos mRNA from experimental groups in basal conditions. Boxplots indicate median ±min/max and include data points of individual mice. (n = 8 control, 10 AgRP-Gq, 11 POMC-Gi and 12 AgRP-Gq;POMC-Gi mice). e, Representative images from coronal ARC sections showing the colocalization of Agrp (magenta) and POMC (green) neurons with Fos (cyan) after experimental mice were injected with vehicle or CNO. f, Representative images showing the distribution AgRP-Tomato+ and POMC-ZsGreen+ axonal projections in the hypothalamus, ARC and PVH areas from AgRP-Gq;POMC-Gi mice bilaterally injected with AAV-flox-tdTomato + AAV-rox-Zsgreen. g, Representative images showing the selective recombination and expression of fluorescent proteins by AgRP and POMC neurons. Mice from all experimental groups were injected bilaterally with a mix of AAV-flox-tdTomato + AAV-frex-ZsGreen (n = 2 AgRP-Gq;POMC-Gi mice). Data represent the mean ± s.e.m for each group and treatment. Source data and further details of statistical analyses are provided as a Source Data file. Scale bar = 100 µm. Source data
Extended Data Fig. 2
Extended Data Fig. 2. Metabolic phenotyping of experimental mouse lines in basal conditions.
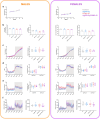
Data from males (left) and females (right) from the four experimental groups showing: a, Body weight curves between 12 and 18 weeks of age. b, Body weight composition. c, Daily basal food intake, in cumulative curve and daily average. d, Respiratory coefficient (RER) curves and averages for light and dark cycles. e, Energy expenditure (EE) curves and averages for the light and dark cycles f, Total activity counts across 24h and average of daily activity. Data is presented as mean ± s.e.m from the biological replicates in each group (control, AgRP-Gq, POMC-Gi and AgRP-Gq;POMC-Gi, respectively) in a (n = 18, 16, 19, 20 male mice and 16, 20, 20, 18 female mice), b (n = 10, 6, 7, 7 male mice and 7, 5, 5, 5 female mice), c–f (n = 10, 9, 11, 11 male mice and 11, 11, 10, 10 female mice). Boxplots indicate median ± min/max and include data points of individual mice entering the analysis. Statistical test: Mixed-effects model in a and d-, e-left panels, one-way ANOVA in b and c-, f-right panel, and two-way ANOVA in c-, f-left panels and, d,-,e-right panel. Source data and further details of statistical analyses are provided as a Source Data file. Source data
Extended Data Fig. 3
Extended Data Fig. 3. The cooperative regulation of food intake from the interplay of AgRP and POMC neurocircuits is also present in female mice.
a, Cumulative food intake for 24h in female mice treated with vehicle and CNO in a cross-over experimental design ***P = 0.0002 AgRP-Gq, **P = 0.0042 POMC-Gi and **P = 0.0031 AgRP-Gq;POMC-Gi, Veh vs. CNO, respectively. b, Quantification of delta food intake (∆ = CNO - Vehicle) during the indicated time intervals after CNO or vehicle injection in female mice 4h: **P = 0.0019 AgRP-Gq, *P = 0.0375 AgRP-Gq;POMC-Gi; Light cycle: ***P = 0.00008 AgRP-Gq, *P = 0.0269 POMC-Gi, **P = 0.0024 AgRP-Gq;POMC-Gi. c, Average of respiratory exchange ratio (RER) during light and dark cycles in female mice treated with vehicle or CNO.***P = 0.0002 AgRP-Gq, *P = 0.0113 AgRP-Gq;POMC-Gi, Veh vs. CNO. d, Curves depicting the changes in RER after injection of vehicle or CNO during the light cycle in male (upper) or female (lower) mice. e, Curves showing no differences in EE in experimental male and female mice treated with CNO or vehicle. f, Curves showing no changes between experimental groups in the total activity curves of male and female mice after CNO or vehicle injection. Data showed the mean ± s.e.m. for each group, with n = 11 control, 13 AgRP-Gq, 12 POMC-Gi and 12 AgRP-Gq;POMC-Gi female mice in a – c and lower panels d – f; and n = 11 control, 10 AgRP-Gq, 12 POMC-Gi, 13 AgRP-Gi;POMC-Gq male mice in upper panel d – f. Statistical test: 1-way ANOVA followed by Tukey multiple comparison test for b, c; 2-way ANOVA followed by Bonferroni′s multiple comparisons test for a, and 2-way ANOVA Mixed effects model for d – f. Source data and further details of statistical analyses are provided as a Source Data file. Source data
Extended Data Fig. 4
Extended Data Fig. 4. Metabolic effects of ghrelin injection in male control mice.
a, Representative images showing the colocalization of Fos mRNA in AgRP+ and POMC+ neurons from control mice treated with saline or ghrelin (left panel) for 1h; and quantification of the percentage of activated (Fos+) AgRP+ and POMC+ neurons after ghrelin injection (right panel) * P = 0.0081. b, left panel: Cumulative food intake of male control mice treated with saline or ghrelin in the presence or absence of food. ** P = 0.005; right panel: Total food intake during time intervals. **P = 0.0047 ***P = 0.0008. c, left panel: Respiratory coefficient during light cycle ***P = 0.0007, ****P < 0.0001, central panel: average of RER during indicated time intervals *** P = 0.0001, ****P < 0.0001, and right panel: average nutrient flux during the 4h after ghrelin injection **P = 0.0033, *** P = 0.0001. d, Average Energy expenditure (EE), VO2, and VCO2 measurements during 24h. e, left panel: Activity counts during 24h measurement. *P = 0.0144 fast vs. saline, central panel: average activity counts ***P = 0.0003, **P = .0035, and right panel: distance traveled during the time intervals. ****P < 0.0001. Data are indicated as mean ± s.e.m. of cell counts per ARC hemisection n = 5 saline- and 7 ghrelin-injected male control mice in a, and as mean ± s.e.m from n = 7 male control mice in b – e. Statistical analysis: 2-way ANOVA followed by Bonferroni’s multiple comparison in a, and Tukey’s multiple comparisons in b – e. Source data and further details of statistical analyses are provided as a Source Data file. Source data
Extended Data Fig. 5
Extended Data Fig. 5. Distribution of PVH neuronal subpopulations and unbiased analysis of activated areas resulting from activation of AgRP- and inhibition of POMC neurons.
a, Representative images showing the distribution of Fos+ cells in the PVH after CNO treatment of the four experimental groups. b, Quantification of total Fos+ cells/hemisection in PVH area from CNO-treated mice for 1h. c, Quantification of total cells expressing Mc4r, Pdyn, Glp1r and Npy1r genes per PVH/hemisection area. d, Anatomical distribution and composition of Npy1R subpopulations that coexpress M, Pdyn, Glp1r markers in the medial PVH area, and quantification of percentage of total Npy1R+ population that coexpress another marker. e, Representative images of coronal sections across the whole brain highlighting areas with higher (yellow-white areas) or lower (blue-white) probability of containing Fos+ cells resulting from the statistical comparison of volumetric Fos distribution between control mice versus AgRP-Gq (top row, blue), POMC-Gi (middle row, red) and AgRP-Gq;POMC-Gi mice (lower row, magenta) after CNO treatment for 1h. Data represent average ± s.e.m of total cell counts per hemisection, from n = 7 mice/group in b,c, and from n = 4 mice/group in d, e. Statistical test: ordinary one-way ANOVA test for b. Source data and further details of statistical analyses are provided as a Source Data file. Scale bar = 100 µm. Source data
Extended Data Fig. 6
Extended Data Fig. 6. Chemogenetic inhibition of Npy1RPVH neurons does not affect energy expenditure.
a, Scheme of AAV-flex-hM4DGi injection into PVH area of Npy1R-Cre+/− mice. b, Representative image of NPy1RPVH neurons that express hM4DGi-mCherry protein (red) showing almost no colocalization with Fos mRNA marker (blue) after CNO injection (3 mg/kg, 1h). c, Quantification of chemogenetic-induced silencing of mCherry-expressing Npy1R+ neurons in PVH area, and characterization of neurotransmitter nature by colocalization with Slc17a6+ or Slc32a1+ markers (n = 4 male mice). d, Cumulative food intake curves after vehicle or CNO injection in Control-GiPVH (Npy1R-Cre −/−) mice (n = 6 male mice) e, Food intake during the time intervals from Control-GiPVH Gi male mice (n = 6 male mice) treated with vehicle (open bars) or CNO (closed bars). f, Average RER during the light and dark cycles in Control-Gi and Npy1R-Gi mice (n = 6 and 9 male mice, respectively) treated with vehicle (open bars) or CNO (closed bars. g, Average of energy expenditure (EE) along the light and dark cycles in Control-Gi and Npy1R-Gi mice (n = 6 and 9 male mice, respectively) treated with vehicle (open bars) or CNO (closed bars). h, Average of activity counts during the light and dark cycles in Control-Gi and Npy1R-Gi mice (n = 6 and 9 male mice, respectively) treated with vehicle (open bars) or CNO (closed bars). i, Cumulative food intake curves after vehicle or CNO injection from female Npy1R-Gi mice treated with vehicle (open dots) or CNO (closed dots) (n = 6 female mice), *P = 0.0364 Veh. Vs. CNO. j, Food intake during the time intervals from Npy1R-Gi female mice (n = 6 female mice) treated with vehicle (open bars) or CNO (closed bars); *P = 0.102, **P = 0.0034 and ****P < 0.001 Veh vs. CNO. k, Average of respiratory coefficients (RER) for light and dark cycle from female Npy1R-Gi mice treated with vehicle (open bars) or CNO (closed bars) (n = 6 female mice). l, Average of energy expenditure (EE) for light and dark cycle from female Npy1R-Gi mice treated with vehicle (open bars) or CNO (closed bars) (n = 6 female mice). m, Average of activity counts during light and dark cycle from female Npy1R-Gi mice treated with vehicle (open bars) or CNO (closed bars). n, Scheme of the experimental design. o, Cumulative food intake along 3 d of chronic treatment with vehicle (grey lines) or CNO (red lines) in drinking water for Npy1R-Gi female mice (n = 12 mice) ****P < 0.0001. p, Percentage of body weight gain after 3 d with chronic treatment with vehicle or CNO in female Npy1R-Gi mice (n = 12 female mice) *P = 0.0102. q, Average of food intake during light and dark cycles along the 3-day chronic treatment with vehicle or CNO in drinking water (n = 12 female Npy1R-Gq mice) *P = 0.0251 and **P = 0.0019. r, Average respiratory coefficient (RER) from 3 d of chronic treatment during light and dark cycles in female Npy1R-Gi mice (n = 12 female mice). ****P < 0.0001. Data represent average ± s.e.m of the biological replicates. Boxplots indicate median ±min/max and include data points of individual mice entering the analysis. Statistical test: two tailed paired T-test for p, 2-way ANOVA for d – r; followed by Bonferroni’s test for I, k, o and r; and Sidak’s test for j, l, m and q. Source data and further details of statistical analyses are provided as a Source Data file. White scale bar = 100 µm in a, d. Black scale bar = 1500 µm in e. Created with BioRender.com. Source data
Extended Data Fig. 7
Extended Data Fig. 7. Identification of activated neuronal cells in the NTS/AP area using sc-seq data.
a, Examplary gating strategy for sorting by flow cytometry: Nuclei determined by side scatter area (SSC-A) vs. forward scatter area (FSC-A). Singlets determined by FSC-A vs. forward scatter width (FSC-W). 2n nuclei determined by DRAQ5 fluorescence (DRAQ5 width vs. DRAQ5 area). b, UMAP showing the distribution of the 136 neuronal cluster, of a total of 186 clusters across all cell type. c, UMAP showing the distribution of glutamatergic and GABAergic neuronal clusters based on Slc17a6 and Slc32a1 gene expression, respectively. d, Violin-plots showing the expression of IEGs of the four neuronal cluster selected based on their high score in the activated IEGS analysis. (Gem*) denotes significant difference of expression between AgRP-Gq;POMC-Gi + CNO (red violins) vs. Control + CNO (green violins) comparison. e, Expression of main marker genes in the individual nuclei from Cluster 82. Source data and further details of statistical analyses are provided as a Source Data file. Source data
Extended Data Fig. 8
Extended Data Fig. 8. Female mice data and extended data for glucose homeostasis assessment.
a, Insulin tolerance test (ITT) performed in ad-libitum fed CNO-treated female mice for 1h before insulin injections. b, Glucose levels during ITT experiment relative to basal glucose levels prior to insulin injection. Letters indicate statistical significance between experimental groups: (a) AgRP-Gq vs. control, **** P < 0.001 15 min, ***P = 0.0001 30 min; (b) POMC-Gi vs. control, *P = 0.0131 60 min; and (c) AgRP-Gq;POMC-Gi vs. control, *P = 0.0133 30 min, *P = 0.0224 60 min. c, Glucose tolerance test (GTT) in 16h fasted CNO-treated female mice for 1h before glucose injection. d, Delta glucose levels in 60 min after CNO injection in female mice in ad libitum fed or 16h fast condition. e, Complete curves of glucose levels during ITT in ad libitum fed male mice. *P = 0.006815min and *P = 0.004930 min, AgRP-Gq vs. control. f, Glucose levels during ITT experiment relative to basal glucose levels prior to insulin injection. (a) AgRP-Gq vs. control, **P = 0.0076 15 min and **P = 0.0030 30 min; (b) POMC-Gi vs. control, *P = 0.041 60 min. g, Complete glucose levels curves during ITT protocol in ad libitum fed male mice treated with vehicle prior to insulin injection. h, Complete curves of glucose levels during an GTT protocol in 16h fasted CNO-treated for 1h male mice. (b) POMC-Gq vs. control, *P = 0.013 60 min, **P = 0.0034 90 min and ** P = 0.006 120 min; (c) AgRP-Gq;POMC-Gi vs. control, *P = 0.0107 90 min and * P = 0.0263 at 120 min. i, Glucose excursion induced by vehicle injection in ad libitum fed male mice j, Glucose excursion induced by CNO injection in ad libitum fed male mice. (a) AgRP-Gq vs. control, *P = 0.34 180 min; (b) POMC-Gi vs. control, **P = 0.0013 60 min, *P = 0.022 180 min; and (c) AgRP-Gq;POMC-Gi vs. control, **P = 0.0083 180 min. k, Changes in glucose levels in 60 min intervals after CNO injection in ad libitum fed male mice. ***P = 0.0008 POMC-Gi vs. control. l, Expression of gluconeogenic enzymes G6P and Pck1 from liver extracts from CNO-treated male mice for 1h. **P = 0.0055 POMC-Gi vs. control, *P = 0.0139 AgRP-Gq;POMC-Gi vs. control. m, Glucose levels during ITT in ad libitum fed Control-GiPVH (grey lines) and Npy1R-GiPVH (orange lines) male mice treated with vehicle (dashed lines) or CNO (solid lines) 1h prior to insulin injection. n, Glucose excursion during GTT protocol in 16h fasted male Control-Gi and Npy1R-Gi mice treated with vehicle (dashed lines) or CNO (solid lines). Data are indicated as mean ± s.e.m. from the following biological replicates for Control, AgRP-Gq, POMC-Gi and AgRP-Gq;POMC-Gi groups, respectively: a, b (n = 17, 13, 15, 13 female mice), c (n = 16, 15, 14, 12 female mice), d (n = 10, 13, 10, 12 female mice), e, f (n = 20, 12, 15, 13 male mice), g (n = 5, 4, 7, 9 male mice), h (n = 16, 13, 10, 14 male mice), i (n = 8, 7, 8, 8 male mice), j (n = 14, 12, 10, 12 male mice), k (n = 14, 12, 10, 12 male mice), l (n = 10, 12, 11, 7 male mice), m and n (n = 5 control-Gi and 9 Npy1R-Gi male mice). Boxplots indicate median ± min/max and include data points of individual mice entering the analysis. Statistical test: 2-way ANOVA followed by Tukey’s multiple a – n, except ordinary one-way ANOVA for l. Letters indicate statistical significance between: (a) Control vs. AgRP-Gq; (b) Control vs. POMC-Gi; (c) Control vs. AgRP-Gq;POMC-Gi. Source data and further details of statistical analyses are provided as a Source Data file. Source data
Extended Data Fig. 9
Extended Data Fig. 9. Female and extended data for impact of HFD-induced obesity on food intake modulated by reciprocal interplay between AgRP and POMC neurons.
a, Body weight curves during HFD exposition in males and females, and comparison with normal body weight curves in normal chow diet (NCD) fed mice. ****P < 0.0001. Mice from the four experimental groups were pooled together. (n = 8 mice/group, diet and sex, 2 mice per each experimental group). b, Body composition changes in 16weeks old male and female mice fed with NCD or HFD. Mice from the four experimental groups were pooled in balanced ratios (n = 16 male and 14 female mice/diet). c, Cumulative food intake curves from HFD-fed female mice treated with vehicle or CNO at the beginning of the light phase. Vehicle vs. CNO: **P = 0.0094 control, *P = 0.0278 AgRP-Gq, **P = 0.0061 POMC-Gi, *P = 0.0278 AgRP-Gq;POMC-Gi. (n = 7 control, 7 AgRP-Gq, 9 POMC-Gi, 6 AgRP-Gq;POMC-Gi female mice) d, Delta food intake (Δ = CNO – vehicle) for the 0–4h interval and the light cycle interval in HFD-fed female mice. (n = 7 control, 7 AgRP-Gq, 9 POMC-Gi, 6 AgRP-Gq;POMC-Gi female mice). e, Body weight curves during HFD exposition in male and female Npy1R-Gi mice, and comparison with normal body weight curves in NCD fed mice. *P = 0.0384 male mice, and **P = 0.0089 female mice (n = 6 mice/sex and diet). f, Body composition changes in 16 weeks old male and female Npy1R-Gi mice treated with NCD or HFD. Males: **P = 0.0085 lean mass, and P = 0.0069 fat mas. Females: *P = 0.0285 lean and *P = 0.013 fat mass. (n = 5 NCD- and 6 HFD-fed male mice, 7 NCD- and 6 HFD-fed female mice) g, Cumulative food intake curves from HFD-fed Npy1R-GiPVH female mice and treated with vehicle (grey lines) or CNO (green curves) at the beginning of the light cycle ** P = 0.093. (n = 10 female mice). h, Food intake at time intervals in HFD-fed Npy1R-GiPVH female mice. **P = 0.0012 at 2h, and ****P < 0.0001 at 4h, 8h and light cycle interval. Data represents mean ± s.e.m for each experimental group mice. Boxplots indicate median ±min/max and include data points of individual mice entering the analysis Statistical test: ordinary one-way ANOVA in d; 2-way ANOVA Mixed-effects model in a, e; 2-way ANOVA followed by Tukey′s multiple comparisons test in b; and Bonferroni’s test in c, g, and Sidak’s test in f and h. Source data and further details of statistical analyses are provided as a Source Data file. Created with BioRender.com. Source data

Similar articles

Cited by

References

    1. Myers MG, Olson DP. Central nervous system control of metabolism. Nature. 2012;491:357–363. - PubMed
    1. Saper, C. B. & Lowell, B. B. The hypothalamus. Curr. Biol.10.1016/j.cub.2014.10.023 (2014). - PubMed
    1. Timper K, Brüning JC. Hypothalamic circuits regulating appetite and energy homeostasis: pathways to obesity. Dis. Model. Mech. 2017;10:679–689. - PMC - PubMed
    1. Thorp AA, Schlaich MP. Relevance of sympathetic nervous system activation in obesity and metabolic syndrome. J. Diabetes Res. 2015;2015:341583. - PMC - PubMed
    1. Atasoy D, Betley JN, Su HH, Sternson SM. Deconstruction of a neural circuit for hunger. Nature. 2012;488:172–177. - PMC - PubMed

Substances