. 2024 Mar;26(3):478-489.
doi: 10.1038/s41556-024-01358-2. Epub 2024 Feb 20.

Multimodal and spatially resolved profiling identifies distinct patterns of T cell infiltration in nodal B cell lymphoma entities

Affiliations

Multimodal and spatially resolved profiling identifies distinct patterns of T cell infiltration in nodal B cell lymphoma entities

Tobias Roider et al. Nat Cell Biol. 2024 Mar.

Abstract

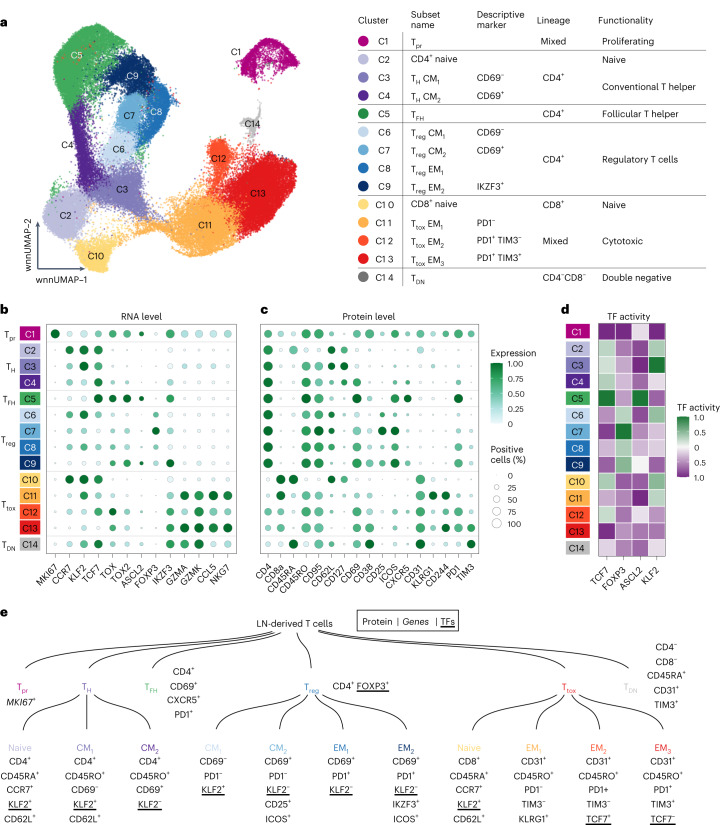
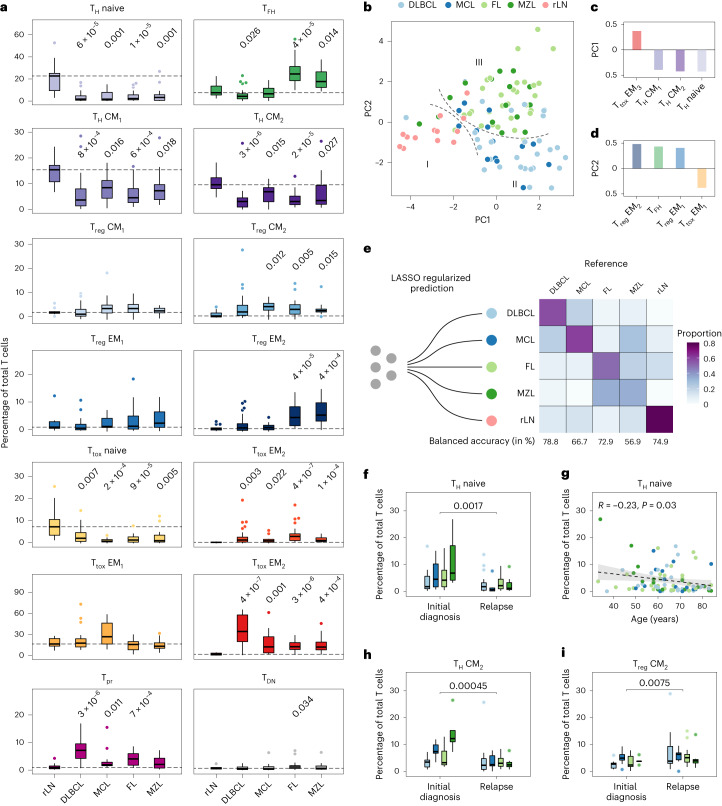
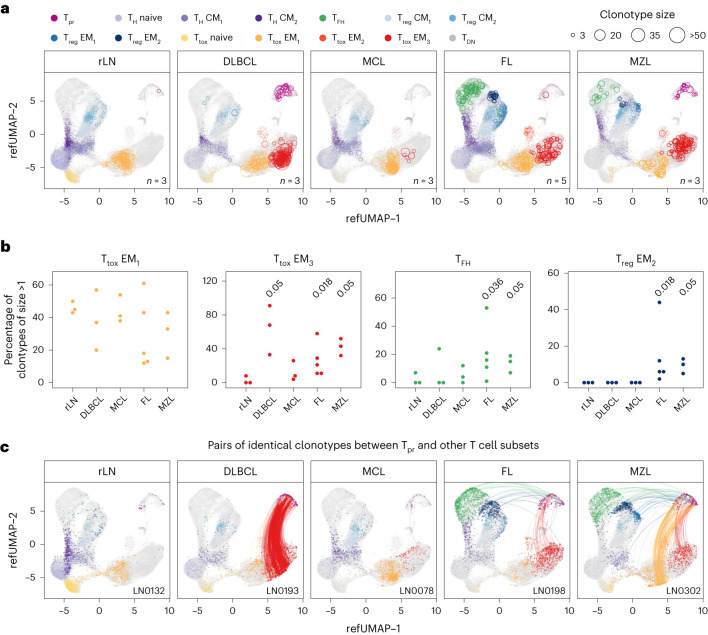
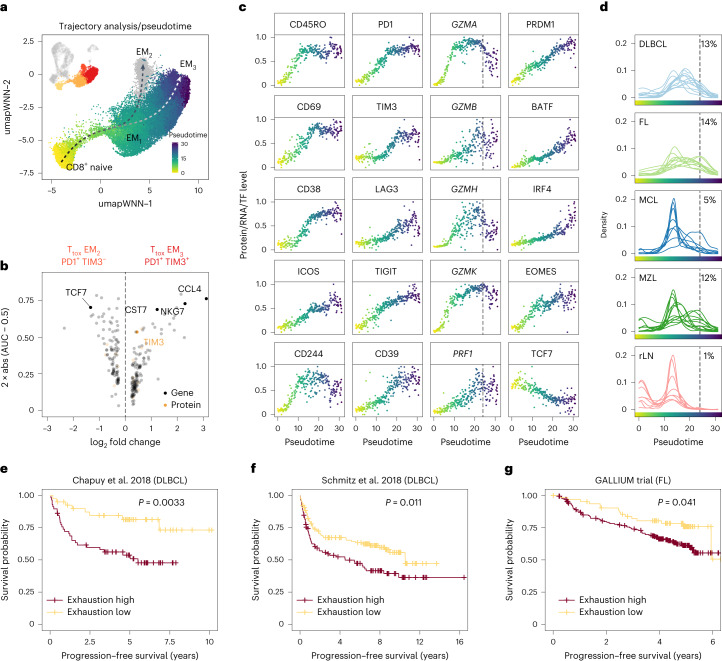
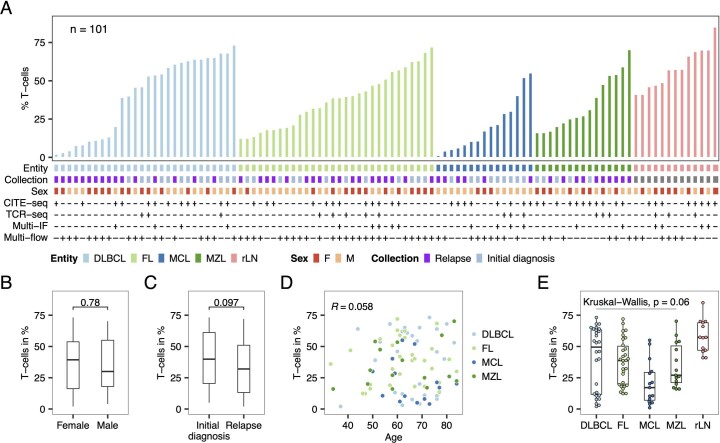
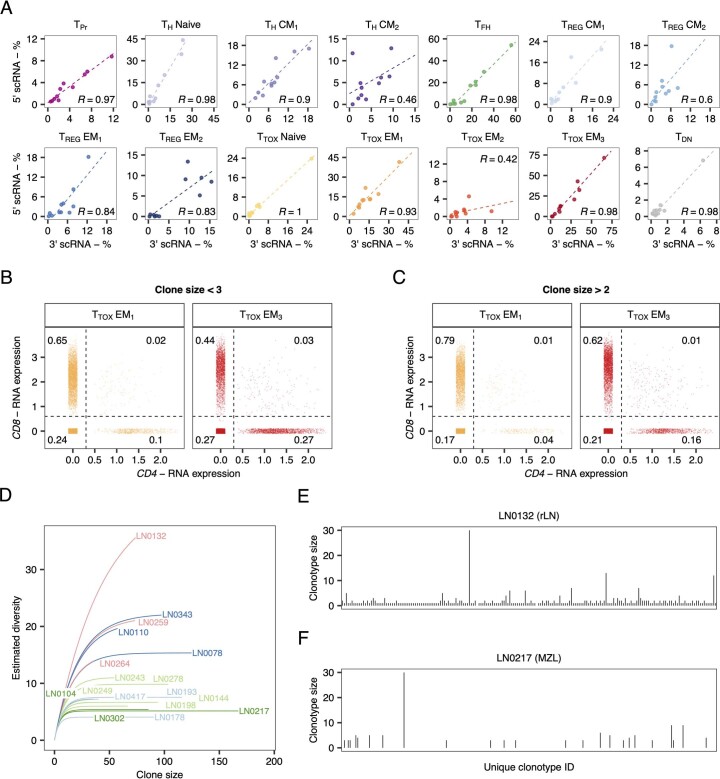
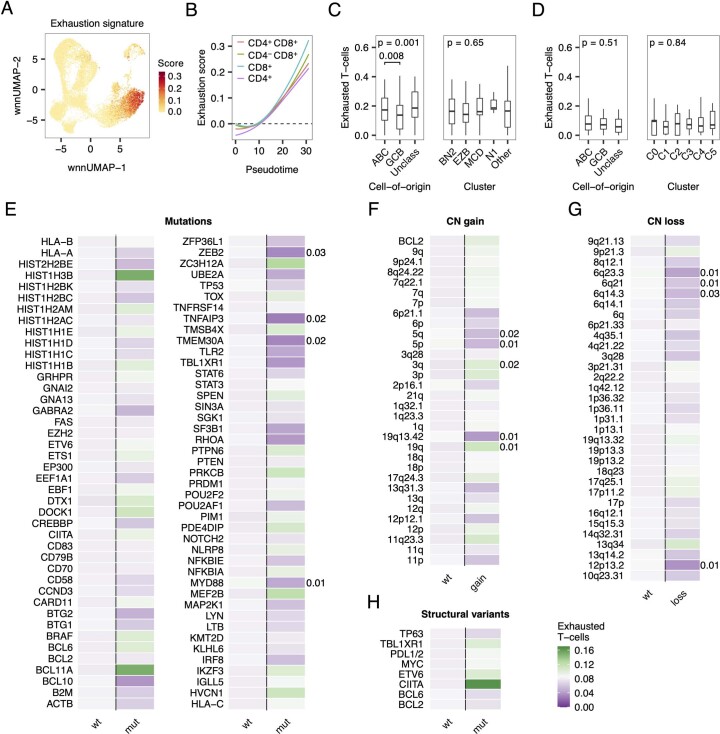
The redirection of T cells has emerged as an attractive therapeutic principle in B cell non-Hodgkin lymphoma (B-NHL). However, a detailed characterization of lymphoma-infiltrating T cells across B-NHL entities is missing. Here we present an in-depth T cell reference map of nodal B-NHL, based on cellular indexing of transcriptomes and epitopes, T cell receptor sequencing, flow cytometry and multiplexed immunofluorescence applied to 101 lymph nodes from patients with diffuse large B cell, mantle cell, follicular or marginal zone lymphoma, and from healthy controls. This multimodal resource revealed quantitative and spatial aberrations of the T cell microenvironment across and within B-NHL entities. Quantitative differences in PD1+ TCF7- cytotoxic T cells, T follicular helper cells or IKZF3+ regulatory T cells were linked to their clonal expansion. The abundance of PD1+ TCF7- cytotoxic T cells was associated with poor survival. Our study portrays lymphoma-infiltrating T cells with unprecedented comprehensiveness and provides a unique resource for the investigation of lymphoma biology and prognosis.


Conflict of interest statement

C.M.S. is a scientific advisor to, has stock options in and has received research funding from Enable Medicine, Inc. G.P.N. is a co-founder and stockholder of Akoya Biosciences, Inc. and inventor on patent US9909167 (On-slide staining by primer extension). The remaining authors declare no competing interests.

Figures

Fig. 1
Fig. 1. LN-derived T cells can be divided into 14 multimodally defined subsets.
a, CITE-seq data from 51 primary LN patient samples were integrated and jointly visualized using UMAP. Cells were coloured with respect to their cluster on the basis of a shared nearest neighbour-based algorithm. The adjacent table summarizes all clusters including used subset names, lineages and functionality. b,c, Dot plot showing the expression of important marker genes and proteins to identify all T cell subsets. Size and colour of the dots indicate the percentage of positive cells and scaled gene/protein expression, respectively. Values were scaled between 0 and 1. d, Heatmap showing the inferred activity of selected transcription factors (TFs), as indicated. y axis is identical to b and c. Values were scaled between −1 and 1. e, Dendrogram summarizing the 14 multimodally defined T cell subsets including most important and interpretable marker genes, proteins and transcription factors. Source data
Fig. 2
Fig. 2. Multicolour flow cytometry reproduces multimodally defined T cell subsets.
a, Most important features to distinguish multimodally defined T cell subsets using a gradient boosting classifier. Only features that are routinely accessible by flow cytometry were considered for the model. b, Percentages of all T cell subsets determined by flow cytometry (x axis) and CITE-seq (y axis) were correlated for n = 13 biologically independent samples. x axis title indicates the applied gating strategy. The symbol ‘U’ indicates merging of two populations. Pearson’s correlation coefficient is given for each panel (R). Source data
Fig. 3
Fig. 3. Nodal B-NHL entities have characteristic quantitative patterns of T cell infiltration.
a, T cell subset proportions determined by CITE-seq or flow cytometry are illustrated in box plots (n = 101 biologically independent patient samples). Outliers are shown as individual dots. Each entity and subset were tested versus tumour-free samples (rLN) using a two-sided Wilcoxon test. P values were corrected for multiple testing using the Benjamini–Hochberg procedure. Only P values ≤0.05 are shown. Dashed lines indicate the median of rLN. bd, PCA based on the subset and overall T cell proportions (b) including the top four loadings of PC1 (c) and PC2 (d) are shown. Dashed lines (b) highlight three groups (I–III) of samples. e, Confusion matrix based on a LASSO-regularized multinomial logistic regression model and estimated classification accuracy using leaving-one-out cross-validation based on subset and overall T cell proportions. fi, Patient characteristics were evaluated in a multivariate model regarding their effect on the proportions of all 14 T cell subsets. Shown are the four most significant associations. P values and/or correlation coefficients were calculated using a two-sided Wilcoxon test (f, h and i) or Pearson’s linear correlation (g). Box plots or dots are coloured by entity as in b and e. The error band in g indicates the 95% confidence interval. Box plots: centre line, median; box limits, first and third quartile; whiskers, 1.5× interquartile range. Source data
Fig. 4
Fig. 4. Entity-specific T cell compositions result from differential clonal expansion of CD4+ and CD8+ T cell subsets.
a,b, 5′ scRNA alongside full-length TCR repertoire data were mapped to the CITE-seq reference dataset. In grey, all cells with 5′ scRNA data are shown, whereas coloured cells belong to samples derived from specific entities (a) or samples (b), as indicated. The number of biologically independent samples is indicated in each panel. In a, circles represent the number of cells with identical TCR clonotype within the same subpopulation. To avoid overplotting, a maximum of 30 circles per sample and T cell subset is shown. In b, the percentage of clonally expanded T cells per patient and T cell subset, as indicated, was quantified and compared with tumour-free samples. Each entity and subset were tested versus tumour-free samples (rLN) using a one-sided Wilcoxon test. Only P values ≤0.05 are shown. c, Mapped cells from five representative samples. Lines connect all proliferating cells with any other cell given that both have identical TCR clonotypes. Source data
Fig. 5
Fig. 5. PD1+ TCF7 cytotoxic T cells converge into terminally exhausted T cells with variable proportions within and across entities.
a, Combined trajectory and pseudotime analysis were performed using CITE-seq expression profiles of Ttox cells starting from naive CD8+ T cells. Arrows illustrate trajectories, while cells are coloured by pseudotime. b, Volcano plot illustrating differentially expressed genes and proteins between PD1+ TIM3+ Ttox EM3 cells and PD1+ TIM3 Ttox EM2 cells. c, Protein expression (first and second column), gene expression (third column) or inferred transcription factor activity (fourth column) are illustrated along binned pseudotime, as shown in a. Values were scaled between 0 and 1. Dashed lines indicate threshold when T cells were considered terminally exhausted. d, Shown is the density of cells for each single patient along pseudotime. Number indicates median percentage of terminally exhausted T cells across all LN patient samples for each entity. eg, Bulk RNA-seq data from patients with DLBCL (e and f) and FL (g) were deconvoluted on the basis of a gene expression signature of terminally exhausted T cells. Kaplan–Meier plots with P values of corresponding log-rank test. AUC, area under the curve. Source data
Fig. 6
Fig. 6. IKZF3+ Treg EM2 cells are clonally related to TFH cells and associated with grading of FL.
a, Proportions of Treg EM2 cells and TFH cells determined by CITE-seq are illustrated as box plots (n = 51 biologically independent patient samples). All entities were tested for significance using a two-sided Wilcoxon test with rLN as reference. Only P values ≤0.05 are shown. b, Dot plot showing the expression of important phenotypic proteins. Size and colour of the dots indicate the percentage of positive cells and scaled protein expression, respectively. Values were scaled between 0 and 1. c, Volcano plot illustrating differentially expressed genes between Treg EM2 cells and EM1 cells. d, 5′ scRNA alongside full-length TCR repertoire data were mapped to the CITE-seq reference data. Lines connect all Treg EM2 cells with any other cell given that both T cells have the same TCR clonotype. Percentages indicate shares of overlapping clonotypes for TFH cells, Tpr cells and Ttox cells. Analysis is based on n = 17 biologically independent patient samples. e,f, Proportions of Treg EM2 cells (e) and TFH cells (f) determined by CITE-seq are shown in dependence of tumour grading in FL (1/2 versus 3A). Differences were tested for significance using a two-sided Wilcoxon test. Shown are n = 12 biologically independent patient samples. Box plots: centre line, median; box limits, first and third quartile; whiskers, 1.5× interquartile range. Source data
Fig. 7
Fig. 7. B-NHL disrupts the healthy LN architecture and generates entity-specific microenvironmental patterns.
a,b, Each cell of a representative tumour-free LN-derived tissue core (rLN) is coloured by its subpopulation (a) or neighbourhood (b). c, Neighbourhoods shown in b were subjected to PCA. The top four loadings of components 1 and 2 are shown as vectors. d, Representative LN-derived tissue cores infiltrated by DLBCL, MCL or FL. Each cell is coloured by subpopulation or neighbourhood. e, Heatmap illustrating the mean and column-wise scaled abundance of subpopulations per neighbourhood across the complete mIF dataset. f, Box plots showing the proportions of selected neighbourhoods of each tissue core. Each entity and neighbourhood were tested versus rLN using the two-sided Wilcoxon test. P values were corrected for multiple testing using the Benjamini–Hochberg procedure. Only P values ≤0.05 are shown. Dashed lines indicate the median of tumour-free LNs (rLN). g, Bar plots showing percentages of cells that were located closest to B cells. DC, dendritic cells. Error bars represent s.e.m. For illustration purposes the B cell bar is not shown completely but indicated as number. In eg, N = 19 biologically independent samples are shown. Source data
Extended Data Fig. 1
Extended Data Fig. 1. Basic patient characteristics.
a) Overview showing entity, pre-treatment status, sex, assay availability and the overall T-cell proportion of a total 101 lymph node samples used in this study. b-e) Box or scatter plots illustrating the associations of patient characteristics in n = 101 biologically independent patient samples with the overall T-cell proportion determined by flow cytometry. P values and/or correlation coefficients were calculated using the two-sided Wilcoxon-test (B, C), Pearson’s linear correlation (D) or Kruskal-Wallis-test (E). Box plots: centre line, median; box limits, first and third quartile; whiskers, 1.5 x interquartile range. Source data
Extended Data Fig. 2
Extended Data Fig. 2. Confusion tables comparing flow cytometry and CITE-seq.
a-b) Gradient boosting classifiers were trained and tested to evaluate whether T-cell subsets identified by CITE-seq can be predicted on basis of surface markers (A) or surface markers and differentially expressed intracellular markers accessible by flow cytometry (B, FoxP3, IKZF3, Ki67). Shown is the proportion of correctly predicted cells per T-cell subset across the complete CITE-seq data set (n = 51 bvles). TPr: Proliferating T-cells. TH: Helper T-cells. TFH: Follicular helper T-cells. TREG: Regulatory T-cells. TTOX: Cytotoxic T-cells. TDN: Double negative T-cells. CM: Central memory. EM: Effector memory. Source data
Extended Data Fig. 3
Extended Data Fig. 3. Overall frequencies of T-cell subsets determined by CITE-seq or flow cytometry.
Overall frequencies of T-cell subsets determined by CITE-seq or flow cytometry are illustrated in box plots (n = 101). Outliers are shown as individual dots. Each entity and subset were tested versus rLN using a two-sided Wilcoxon-test. P values were corrected for multiple testing using the Benjamini-Hochberg procedure. Only p values ≤ 0.05 are shown. Dashed lines indicate the median of rLN. rLN: Tumor-free lymph nodes. TPr: Proliferating T-cells. TH: Helper T-cells. Box plots: centre line, median; box limits, first and third quartile; whiskers, 1.5 x interquartile range. TFH: Follicular helper T-cells. TREG: Regulatory T-cells. TTOX: Cytotoxic T-cells. TDN: Double negative T-cells. CM: Central memory. EM: Effector memory. Source data
Extended Data Fig. 4
Extended Data Fig. 4. Multinomial and multivariate models to explain varying T-cell subset proportions.
a) Beta coefficients derived from a LASSO-regularized multinomial regression model predicting rLN, MZL, FL, MCL, or DLBCL based on the subset and overall T-cell proportions. b) Multivariate linear models were fit using sex, age, treatment status, COO (only DLBCL) as covariates, and the proportion of each T-cell subset as dependent variable in a two-sided fashion. Models were fit for the total dataset and for each entity separately, as indicated. Diameter and color of the dots indicate –log10 p value and size of the coefficient, respectively. P values were corrected using the Benjamini-Hochberg procedure and significant p values are indicated by +/−. A-B) Analysis is based on n = 101 biologically independent samples. TPr: Proliferating T-cells. TH: Helper T-cells. TFH: Follicular helper T-cells. TREG: Regulatory T-cells. TTOX: Cytotoxic T-cells. TDN: Double negative T-cells. CM: Central memory. EM: Effector memory. COO: Cell-of-origin. Source data
Extended Data Fig. 5
Extended Data Fig. 5. 5′ scRNA alongside full-length TCR sequencing and TCR diversity.
5′ scRNA alongside full-length TCR repertoire data from n = 17 biologically independent lymph node samples were mapped to the CITE-seq reference data. a) T-cell subset proportions determined by 5′ scRNA or CITE-seq reference data were correlated across 17 patient samples and 14 multimodally defined T-cell subsets. R values represent Pearson’s linear correlation coefficients. b-c) CD4 and CD8 gene expression of TTOX EM1 and TTOX EM3 cells with clone size samller (B) or greater / equal 3 (C). Dots are jittered in x and y direction. Numbers indicate proportions of CD4+, CD8+, CD4+ CD8+, or CD4CD8 T-cells. d) TCR diversity was esimated for each LN patient sample using a rarefraction analysis (D). e-f) TCR diversity is exemplarily illustrated showing the 10 % most abundant clonotypes per sample. TPr: Proliferating T-cells. TH: Helper T-cells. TFH: Follicular helper T-cells. TREG: Regulatory T-cells. TTOX: Cytotoxic T-cells. TDN: Double negative T-cells. CM: Central memory. EM: Effector memory. TCR: T-cell receptor. Source data
Extended Data Fig. 6
Extended Data Fig. 6. T-cell exhaustion associated with genetic features.
a) An exhaustion score was calculated based on a transcriptional signature of terminally exhaustion T-cells (see Method section for details) and then projected onto the reference UMAP plot. b) Locally estimated scatterplot smoothing (loess) of pseudotime versus exhaustion score (as shown in panel A) separately for CD4+, CD8+, CD4+CD8+, and CD4CD8 TTOX cells. c-h) Bulk RNA-seq data from DLBCL patients from the Schmitz et al. cohort (C, n = 190) or the Chapuy et al. cohort (D-H, n = 137) were deconvoluted based on a gene expression signature of terminally exhausted T-cells. Box plots (C-D) show associations between T-cell exhaustion and cell-of-origin or genetic subtypes. Conditions were tested for significance using the Kruskal-Wallis-test. Wilcoxon-test was used as post-hoc test (C). Heatmaps (E-H) illustrate the mean estimated proportion of exhausted T-cells for somatic variants (E), amplifications (F), deletions (G), or structural variants (H), as indicated, based on deconvoluation of the bulk RNA-seq of the Chapuy et al. cohort (n = 137). Conditions were tested for significance using the two-sided Wilcoxon-test and corrected for multiple testing using the Benjamini-Hochberg procedure. After correction, all p values were > 0.05. To highlight the strongest differences, uncorrected p values ≤ 0.05 are shown to the right of each panel. Box plots: centre line, median; box limits, first and third quartile; whiskers, 1.5 x interquartile range. ABC: Activated B-cell subtype. GCB: Germinal center B-cell subtype. CN: Copy number. Source data
Extended Data Fig. 7
Extended Data Fig. 7. TREG EM2 express IKZF3 at protein level and have no impact on overall survival in FL.
a) Representative pseudocolor and density plots showing the IKZF3 (Aiolos) protein expression in CD4+ FoxP3+ cells determined by flow cytometry. Numbers indicate percentage of positive cells based on gates as inidicated. Grey shaded histogramm represent fluorescence-minus-one control. b) IKZF3 protein expression in FoxP3+ T-cells determined by flow cytometry in n = 24 biologically independent B-cell lymphoma patient samples. Each entity was tested versus tumour-free samples (rLN) using the two-sided Wilcoxon-test. Only p values ≤ 0.05 are shown. c) 5′ scRNA alongside full-length TCR repertoire data from 11 biologically independent samples were mapped to the CITE-seq reference data. Lines connect all TREG CM1, TREG CM2 or TREG EM1 cells with any other cell given that both T-cells have the same TCR clonotype. d-e) Bulk RNA-seq data from patients with FL were deconvoluted based on gene expression signature of TREG EM2 (D) or TFH cells (E). Kaplan-Meier plots with p values of corresponding log-rank test. Box plots: centre line, median; box limits, first and third quartile; whiskers, 1.5 x interquartile range. TCR: T-cell receptor. TPr: Proliferating T-cells. TH: Helper T-cells. TFH: Follicular helper T-cells. TREG: Regulatory T-cells. TTOX: Cytotoxic T-cells. TDN: Double negative T-cells. CM: Central memory. EM: Effector memory. Source data
Extended Data Fig. 8
Extended Data Fig. 8. Profiles of cell types and T-cell subpopulations identified by multiplexed immunofluorescence.
a-b) Overview of T-cell subsets (A) and other cell types (B) identified by highly multiplexed immunofluorescence including their marker profiles. c) Heatmap illustrating the mean expression of key marker proteins that were used to annotate the 18 cell types and T-cell subsets using highly multiplexed immunofluorescence. Expression values were scaled between 0 and 1. d) Shown are the absolute numbers of T-cells per subset, tissue core, and patient. A maximum number of two cores per patient were imaged. e) The low-granularity T-cell subpopulations detected by multiplexed immunofluorescence were aligned with the 14 high-granularity T-cell subsets identified by CITE-seq. Shown is the correlation of proportions for each of the T-cell subpopulations across n = 19 biologically indepdendent LN samples that were analyzed by both approaches. Pearson’s correlation coefficient is given for each panel (R). mIF: Multiplexed immunofluorescence. TPr: Proliferating T-cells. TH: Helper T-cells. TFH: Follicular helper T-cells. TREG: Regulatory T-cells. TTOX: Cytotoxic T-cells. CM: Central memory. EM: Effector memory. FDC: Follicular dendritic cells. Source data
Extended Data Fig. 9
Extended Data Fig. 9. Representative lymph node tissue cores colored by T-cell subpopulation or non T-cell cell types.
Shown are five representative LN tissue cores for all entities investigated. Each cell was colored by T-cell subsets or non T-cell cell types as indicated. FDC: Follicular dendritic cell. TPr: Proliferating T-cells. TH: Helper T-cells. TFH: Follicular helper T-cells. TREG: Regulatory T-cells. TTOX: Cytotoxic T-cells. FDC: Follicular dendritic cells. Source data
Extended Data Fig. 10
Extended Data Fig. 10. Qualitative and quantitative patterns of cellular neighbourhoods.
a–e) Representative lymph node-derived tissue cores from three or two different patients per entity. Each cell was colored according to its neighbourhood. F) Box plots showing the proportions of selected neighborhoods of each tissue core across n = 19 biologically indepdent samples. Each entity and neighborhood was tested versus rLN using the two-sided Wilcoxon-test. P values were corrected for multiple testing using the Benjamini-Hochberg procedure. Only p values ≤ 0.05 are shown. Dashed lines indidcate the median of rLN. Box plots: centre line, median; box limits, first and third quartile; whiskers, 1.5 x interquartile range. rLN: Tumor-free lymph node. TPr: Proliferating T-cells. TFH: Follicular helper T-cells. TREG: Regulatory T-cells. TTOX: Cytotoxic T-cells. FDC: Follicular dendritic cells. Source data

References

    1. Bea S, et al. Landscape of somatic mutations and clonal evolution in mantle cell lymphoma. Proc. Natl Acad. Sci. USA. 2013;110:18250–18255. doi: 10.1073/pnas.1314608110. - DOI - PMC - PubMed
    1. Chapuy B, et al. Molecular subtypes of diffuse large B cell lymphoma are associated with distinct pathogenic mechanisms and outcomes. Nat. Med. 2018;24:679–690. doi: 10.1038/s41591-018-0016-8. - DOI - PMC - PubMed
    1. Okosun J, et al. Integrated genomic analysis identifies recurrent mutations and evolution patterns driving the initiation and progression of follicular lymphoma. Nat. Genet. 2014;46:176–181. doi: 10.1038/ng.2856. - DOI - PMC - PubMed
    1. Schmitz R, et al. Genetics and pathogenesis of diffuse large B-cell lymphoma. N. Engl. J. Med. 2018;378:1396–1407. doi: 10.1056/NEJMoa1801445. - DOI - PMC - PubMed
    1. Spina V, et al. The genetics of nodal marginal zone lymphoma. Blood. 2016;128:1362–1373. doi: 10.1182/blood-2016-02-696757. - DOI - PMC - PubMed

MeSH terms

Substances