

The distinct development of stimulus and response serial dependence
- PMID: 38379075
- PMCID: PMC11543724
- DOI: 10.3758/s13423-024-02474-8
The distinct development of stimulus and response serial dependence
Abstract
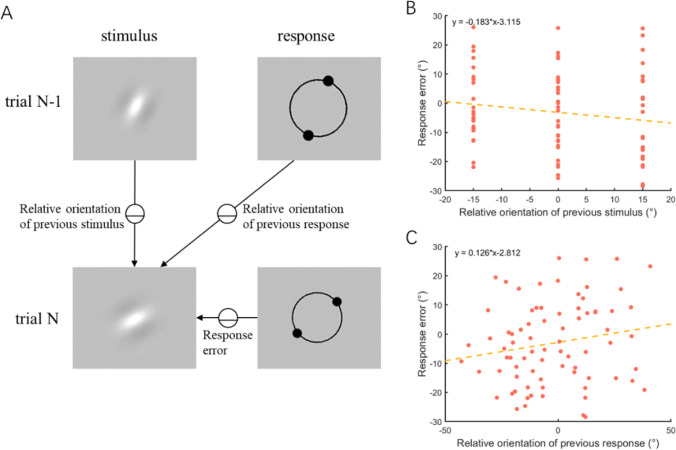
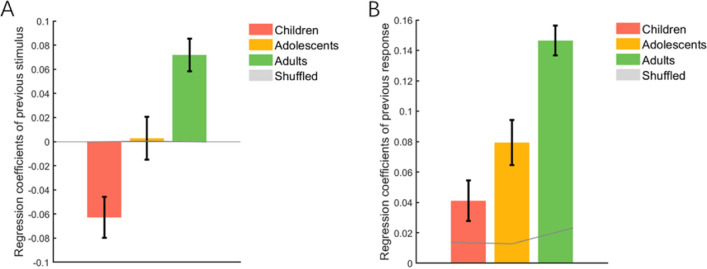
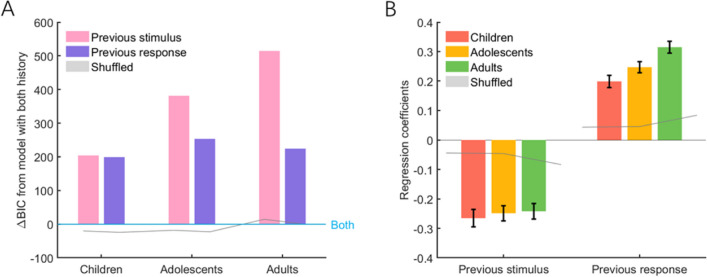
Serial dependence (SD) is a phenomenon wherein current perceptions are biased by the previous stimulus and response. This helps to attenuate perceptual noise and variability in sensory input and facilitates stable ongoing perceptions of the environment. However, little is known about the developmental trajectory of SD. This study investigates how the stimulus and response biases of the SD effect develop across three age groups. Conventional analyses, in which previous stimulus and response biases were assessed separately, revealed significant changes in the biases over time. Previous stimulus bias shifted from repulsion to attraction, while previous response bias evolved from attraction to greater attraction. However, there was a strong correlation between stimulus and response orientations. Therefore, a generalized linear mixed-effects (GLME) analysis that simultaneously considered both previous stimulus and response, outperformed separate analyses. This revealed that previous stimulus and response resulted in two distinct biases with different developmental trajectories. The repulsion bias of previous stimulus remained relatively stable across all age groups, whereas the attraction bias of previous response was significantly stronger in adults than in children and adolescents. These findings demonstrate that the repulsion bias towards preceding stimuli is established early in the developing brain (at least by around 10 years old), while the attraction bias towards responses is not fully developed until adulthood. Our findings provide new insights into the development of the SD phenomenon and how humans integrate two opposing mechanisms into their perceptual responses to external input during development.
Keywords: Attractive bias; Development; Perception; Repulsive bias; Serial dependence.
© 2024. The Author(s).
Conflict of interest statement
The authors report no financial interests or potential conflicts of interest.
Figures


Similar articles
-
Characterizing serial dependence as an attraction to prior response.J Vis. 2024 Sep 3;24(9):16. doi: 10.1167/jov.24.9.16. J Vis. 2024. PMID: 39325435 Free PMC article.
-
The role of feature-based attention in visual serial dependence.J Vis. 2019 Nov 1;19(13):21. doi: 10.1167/19.13.21. J Vis. 2019. PMID: 31770772
-
Attractive and repulsive effects of sensory history concurrently shape visual perception.BMC Biol. 2022 Nov 7;20(1):247. doi: 10.1186/s12915-022-01444-7. BMC Biol. 2022. PMID: 36345010 Free PMC article.
-
Individual difference in serial dependence results from opposite influences of perceptual choices and motor responses.J Vis. 2020 Aug 3;20(8):2. doi: 10.1167/jov.20.8.2. J Vis. 2020. PMID: 32744618 Free PMC article.
-
Effects of satisfying and violating expectations on serial dependence.J Vis. 2023 Feb 1;23(2):6. doi: 10.1167/jov.23.2.6. J Vis. 2023. PMID: 36753122 Free PMC article.
Cited by
-
Opposing serial effects of stimulus and choice in speech perception scale with context variability.iScience. 2024 Jul 30;27(9):110611. doi: 10.1016/j.isci.2024.110611. eCollection 2024 Sep 20. iScience. 2024. PMID: 39252961 Free PMC article.
-
Characterizing serial dependence as an attraction to prior response.J Vis. 2024 Sep 3;24(9):16. doi: 10.1167/jov.24.9.16. J Vis. 2024. PMID: 39325435 Free PMC article.
References
-
- Barbosa, J., Stein, H., Martinez, R. L., Galan-Gadea, A., Li, S., Dalmau, J., Adam, K. C. S., Valls-Solé, J., Constantinidis, C., & Compte, A. (2020). Interplay between persistent activity and activity-silent dynamics in the prefrontal cortex underlies serial biases in working memory. Nature Neuroscience,23(8), 1016–1024. 10.1038/s41593-020-0644-4 - PMC - PubMed
-
- Blankenstein, N. E., Crone, E. A., van den Bos, W., & van Duijvenvoorde, A. C. K. (2016). Dealing with uncertainty: Testing risk- and ambiguity-attitude across adolescence. Developmental Neuropsychology,41(1/2), 77–92. 10.1080/87565641.2016.1158265 - PubMed
MeSH terms
LinkOut - more resources
Full Text Sources
Medical
