. 2024 Feb 20;7(1):208.
doi: 10.1038/s42003-024-05823-4.

Downregulation of praja2 restrains endocytosis and boosts tyrosine kinase receptors in kidney cancer

Affiliations

Downregulation of praja2 restrains endocytosis and boosts tyrosine kinase receptors in kidney cancer

Laura Rinaldi et al. Commun Biol. .

Abstract

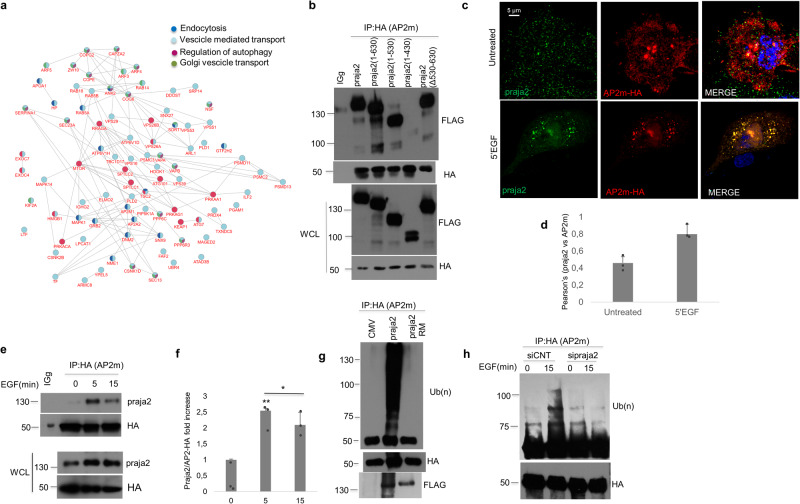
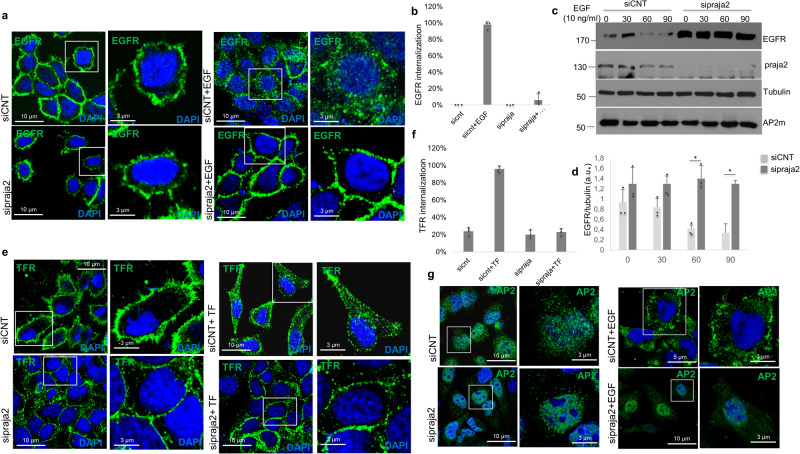
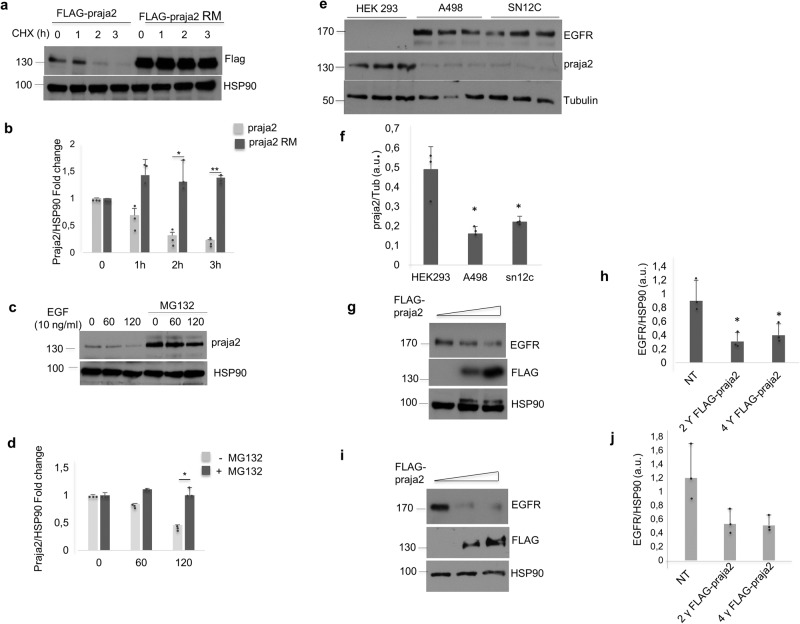
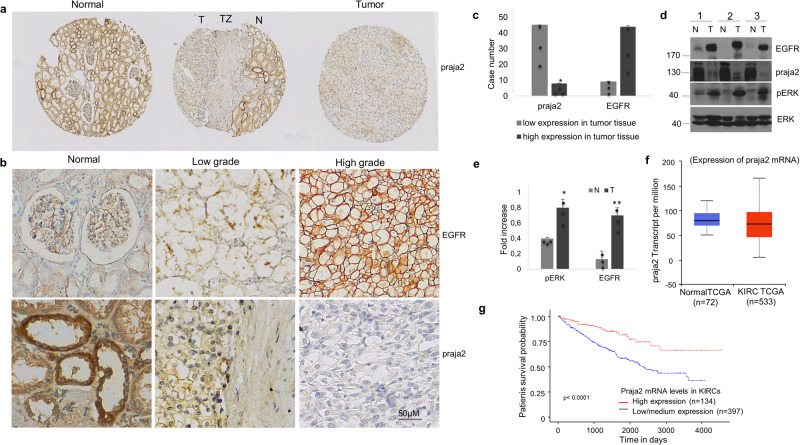
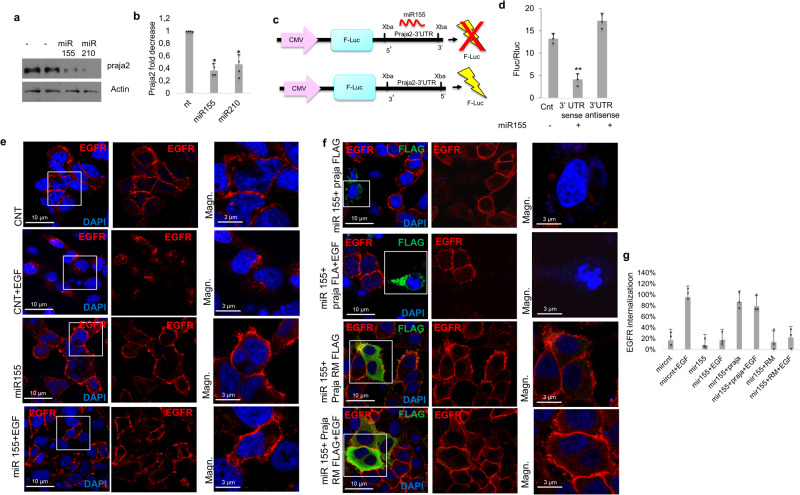
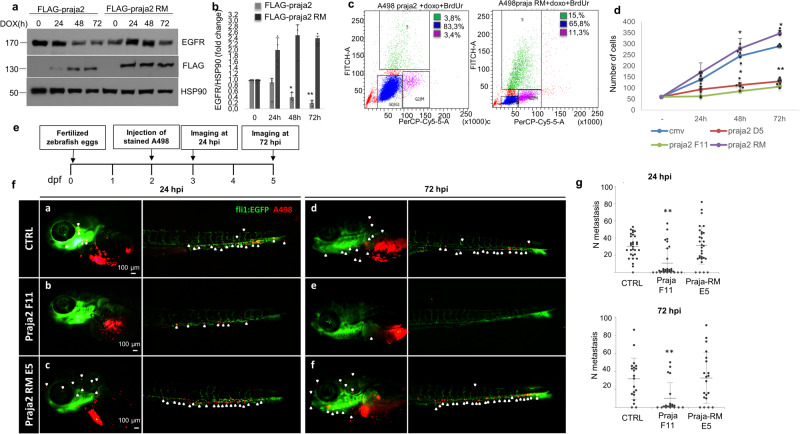
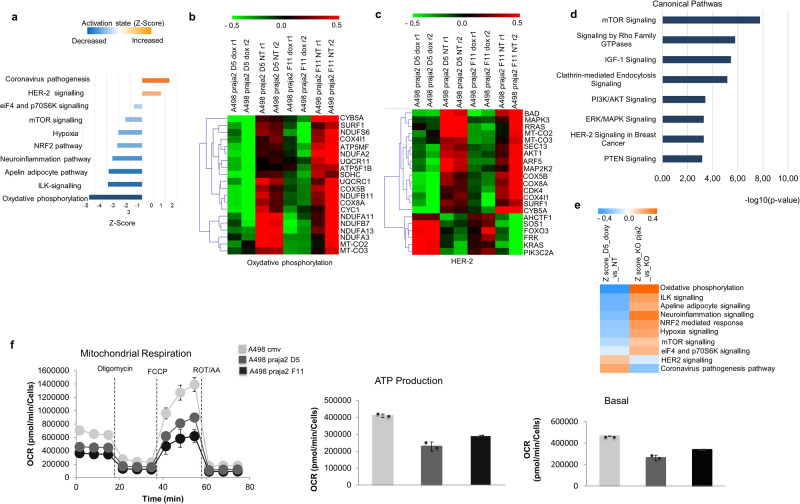
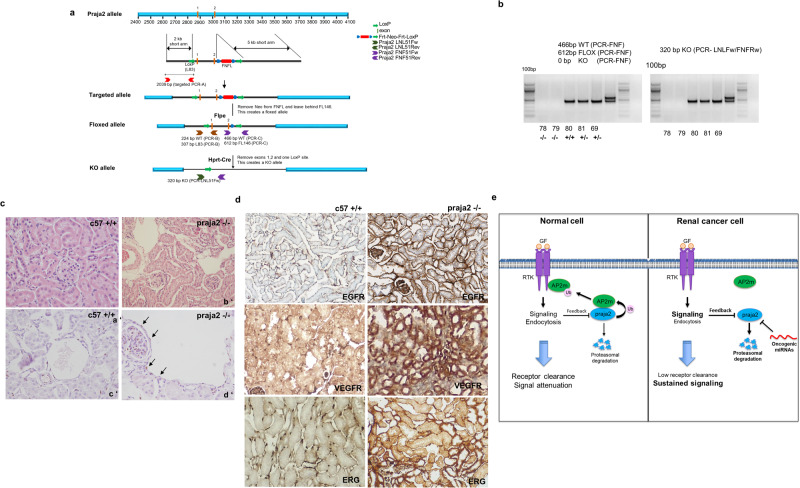
Clear cell renal cell carcinoma (ccRCC) is the most common kidney cancer in the adult population. Late diagnosis, resistance to therapeutics and recurrence of metastatic lesions account for the highest mortality rate among kidney cancer patients. Identifying novel biomarkers for early cancer detection and elucidating the mechanisms underlying ccRCC will provide clues to treat this aggressive malignant tumor. Here, we report that the ubiquitin ligase praja2 forms a complex with-and ubiquitylates the AP2 adapter complex, contributing to receptor endocytosis and clearance. In human RCC tissues and cells, downregulation of praja2 by oncogenic miRNAs (oncomiRs) and the proteasome markedly impairs endocytosis and clearance of the epidermal growth factor receptor (EGFR), and amplifies downstream mitogenic and proliferative signaling. Restoring praja2 levels in RCC cells downregulates EGFR, rewires cancer cell metabolism and ultimately inhibits tumor cell growth and metastasis. Accordingly, genetic ablation of praja2 in mice upregulates RTKs (i.e. EGFR and VEGFR) and induces epithelial and vascular alterations in the kidney tissue.In summary, our findings identify a regulatory loop between oncomiRs and the ubiquitin proteasome system that finely controls RTKs endocytosis and clearance, positively impacting mitogenic signaling and kidney cancer growth.


Conflict of interest statement

The authors declare no competing interests.

Figures

Fig. 1
Fig. 1. Praja2 interacts with- and ubiquitinates AP2m subunit.
a Subnetwork of the praja2 protein-protein interactome (PPI) associated with autophagy and endocytosis. After experimentally defining the full praja2 PPI network (n = 724) using the inBio Discover Web tool, a functional enrichment analysis was performed focusing specifically on terms associated with autophagy and endocytosis, thus identifying a subgroup of proteins (n = 87) whose activities also included more specific functions related to Golgi vesicle transport. b Co-immunoprecipitation of AP2m-HA and FLAG-praja2 from HEK293 cell lysates expressing praja2 wild-type and deletion mutants (1-630; 1-530; 1-430; ∆530-630). The immunoprecipitation (Ip) was performed using anti-HA antibody or control IgG. c HK-2 cells, left untreated or treated with EGF, were PFA-fixed and immunostained for praja2 and AP2m. Representative confocal images are shown. Scale bar (5 µM). d Pearson’s coefficient and quantitative analysis of the experiments shown in (c). A mean value of three independent experiments ± SD is shown. *P = 0.014. e HeLa cells were transiently transfected with AP2m-HA, starved overnight, treated with EGF (10 ng/µl) for the indicated time points, and lysed. Lysates were immunoprecipitated with anti-HA antibody. Precipitates and an aliquot of lysates were immunoblotted with anti-praja2 and anti-HA antibodies. f Quantitative analysis of the experiments shown in (e). A mean value of three independent experiments ± SD is shown. Student’s t-test, **P = 0.004; *P = 0.01. g Immunoprecipitation of AP2m-HA from HEK293 cell lysates expressing AP2m-HA, Myc-ubiquitin, and FLAG-praja2 or FLAG-praja2RM (inactive mutant). Precipitates were immunoblotted with anti-Myc (ubiquitinated AP2m) and anti-HA antibodies. FLAG-praja2 expression was revealed from total lysates. h Lysates from HeLa cells transiently transfected with Myc-ubiquitin, AP2m-HA, and siRNAs (control or targeting praja2), left untreated or stimulated with EGF (10 ng/µl) for 15 min, were subjected to immunoprecipitation with anti-HA antibody. Precipitates were immunoblotted with anti-HA and anti-Myc antibodies.
Fig. 2
Fig. 2. Praja2 is required for receptor endocytosis.
a HeLa cells were transfected with siRNAs (control or targeting praja2), serum-deprived overnight, and treated with EGF (10 ng/µl) for 90 min. Cells were PFA-fixed and immunostained with anti-EGFR antibody (green) and DAPI (blue). Representative confocal images are shown. Scale bar is indicated. b Quantitative analysis of experiment shown in (b). A mean value of three independent experiments ± SD is shown. c Same as in (a), with the exception that cells were lysed and immunoblotted for EGFR, praja2, and α-tubulin. d Quantitative analysis of experiment shown in (b). A mean value of three independent experiments ± SD is shown. Student’s t-test *P = 0.02 for 60 min, *P = 0.014 for 90 min time point. e HeLa cells were transfected with siRNAs (control or targeting praja2), serum-deprived overnight, and treated with transferrin (Tf, 2 µg/ml) for 60 min. Cells were PFA-fixed and immunostained with anti-TfR antibody (green) and DAPI (blue). Representative confocal images are shown. Scale bar is indicated. f Quantitative analysis of experiment shown in (b). A mean value of three independent experiments ± SD is shown. g HeLa cells were transfected with siRNAs (control or targeting praja2), serum-deprived overnight, and treated with EGF (10 ng/µl) for 5 min. Cells were PFA-fixed and immunostained with anti-AP2m antibody (green) and DAPI (blue). Representative confocal images are shown. Scale bar is indicated.
Fig. 3
Fig. 3. EGF induces proteasomal degradation of praja2.
a HeLa cells transiently transfected with FLAG-praja2 (either wild type or ring mutant RM) vector were treated with cycloheximide (10 µM) and harvested at the indicated time points. Total lysates were immunoblotted with anti-FLAG. HSP90 was used as loading control. b Quantitative analysis of the experiments shown in a. A mean value of three independent experiments ± SD is presented. Student’s t-test, *P = 0.02; **P = 0.001. c HeLa cells were serum-deprived overnight and stimulated with EGF (10 ng/ml) in the presence of the protein synthesis inhibitor cycloheximide (10 μM). Where indicated, cells were pre-treated with the proteasome inhibitor MG132 (10 µM). Cells were harvested at the indicated time points and lysed. Lysates were immunoblotted for praja2 and HSP90. d Quantitative analysis of the experiments shown in (c). A mean value of three independent experiments ± SD is shown. Student’s t-test *P = 0.039. e Immunoblot analysis of praja2 and EGFR in HEK293 cells and in two different kidney cancer human cell lines (A-498 and SN12C). Tubulin was used as loading control. f Quantitative analysis of the experiment shown in (e). A mean value of three independent experiments ± SD is shown. Student’s t-test for A-498 *P = 0.02; for SN12C *P = 0.047 (g) A-498 cells were transiently transfected with increasing amount of FLAG-praja2. Cells were harvested 24 h after transfection and lysed. Lysates were immunoblotted with anti-FLAG and anti-EGFR antibodies. h Quantitative analysis of experiment shown in (g). A mean value of three independent experiments ± SD is shown; Student’s t-test for 2ϒ*P = 0.02; Student’s t-test for 4ϒ *P = 0.04. i CaKi-1 cells were transiently transfected with increasing amount of FLAG-praja2. Cells were harvested 24 h after transfection and lysed. Lysates were immunoblotted with anti-FLAG and anti-EGFR antibodies. j Quantitative analysis of experiment shown in (i). A mean value of three independent experiments ± SD is shown.
Fig. 4
Fig. 4. Loss of praja2 in high-grade kidney cancer.
a Immunohistochemistry analysis of praja2 in normal renal tissue and renal tumor lesions. The middle section shows immunostaining for praja2 at the transition zone (TZ) between normal (N) and tumoral (T) areas. Magnification 40×. b Immunohistochemistry analysis for praja2 and EGFR. Normal tissue, low-grade tumor, and high-grade tumor are shown. EGFR expression is low in normal renal tissue and increased in clear cell renal cell carcinomas in a variable manner (upper panels). Inversely, praja2 expression is high in normal tissue and strongly decreased in tumors (lower panels). c Quantitative analysis of experiment shown in (b). d Immunoblot analysis of praja2, EGFR, and phosphorylated ERK1/2 in total lysates prepared from ccRCC human tissues. e Quantitative analysis of experiment shown in (d). A mean value of three experiments ± SD is presented. Student’s t-test for EGFR, *P = 0.002; Student’s t-test for pERK1/2 *P = 0.014 (f) Boxplot showing relative expression (RNA transcript per million) of praja2 in normal samples and in primary lesions of kidney renal clear carcinoma (KIRC). UALCAN Database and Statistical Analysis Student’s t-test were used (P ≤ 0.01). g Kaplan–Meier plots showing the association between praja2 mRNA levels and patient survival (log-rank test, P ≤ 1e-4).
Fig. 5
Fig. 5. Downregulation of praja2 by oncogenic miRNAs.
a Immunoblot analysis of HEK293 cells, transiently transfected with hsa-miR-155 and has-miR-210. Actin was used as loading control. b Quantitative analysis of the experiments shown in (a). A mean value of three independent experiments ± SD is presented. Student’s t-test for hsa-miR-155 *P = 0.01; hsa-miR-210 *P = 0.013. c Schematic representation of the experiment shown in (d). d Relative luciferase activity and HEK293 cells transiently transfected with has-miR-155 oligonucleotides and, as control, a non-targeting scrambled oligonucleotide. The relative activity of firefly luciferase expression was standardized to a transfection control using Renilla luciferase. A mean value of three independent experiments ± SD is presented. Student’s t-test **0.0018. e HEK293 cells were transfected with, hsa-miR-155 or a scrambled oligonucleotide, serum-deprived overnight and treated with EGF (10 ng/µl) for 90 min. Cells were PFA-fixed and immunostained with anti-EGFR antibody (red) and DAPI (blue). Representative confocal images are shown. Scale bar is indicated. f Same as in (e), with the exception that a vector encoding for FLAG-praja2 (either wild type or RING mutant) was included in the transfection mixture. Representative confocal images are shown. Scale bar is indicated. g Quantitative analysis of the experiments shown in (f). The data are expressed as a mean value ± SD of internalized EGFR. About 50 cells for each experimental group of four independent experiments were analyzed.
Fig. 6
Fig. 6. Praja2 inhibits the growth and invasiveness of RCC cells.
a A-498 cells stably transfected with doxycycline-inducible vectors encoding for FLAG-praja2 or FLAG-praja2RM, were treated with doxycycline and harvested at the indicated timepoints. Lysates were immunoblotted with anti-FLAG and anti-EGFR antibodies. b Quantitative analysis of the experiments shown in (a). A mean value of three independent experiments ± SD is presented. Student’s t-test **P = 0.0013; *P = 0.014. c FACS analysis of A-498 cells stably transfected with FLAG-praja2 or FLAG-praja2RM were treated with doxycycline for 48 h. Cell cycle distribution (G0/G1, S, and G2/M) is indicated as percentage of total cells scored. d A-498 cells stably transfected with FLAG-praja2 (two independent clones, D5 and F11), FLAG-praja2RM or empty vector (CMV) were seeded in multi-well plates and treated with doxycycline. Following the treatment, cells were collected and counted at different timepoints. A mean value of three independent experiments is shown. Student’s t-test *P = 0.017 for FLAG-praja2 48 h; **P = 0.6e-3 for FLAG-praja2 72 h; *P = 0.01 for FLAG-praja2RM 48 h and 72 h; e Schematic view of the zebrafish model used in this study. f A-498-CMV, A-498-praja2, and A-498-praja2RM cells were injected into the perivitelline space (PVS) at 48 h post-fertilization (hpf) Tg(fli1:EGFP) zebrafish larvae. Cells were fluorescently labeled with CM-DiI (red) tracker and zebrafish tumor xenograft were analyzed at 24 h and 72 h post-injection (hpi) (a′, b′ and d′, e′ respectively). The metastatic cancer cells are indicated in zebrafish head and tail with white arrows. A representative image is shown. g Metastases in each zebrafish were counted 24 and 72 hpi. Distribution of animal with metastasis was presented as a dot blot. Student’s t-test for 24 h, **P = 0.003; Student’s t-test for 72 h, **P = 0.013.
Fig. 7
Fig. 7. Praja2 induces a transcriptional reprogramming in RCC cells.
a Histogram showing activation state (Z-score values) of the canonical pathway statistically significant (P = < 0.05) involving the differentially expressed RNA transcripts, as computed by the IPA tool. b, c Heatmaps summarizing the expression values of the differentially expressed transcripts involved in the molecular signature of the indicated pathways, as computed with IPA, in two different clones of A-498 cells stably expressing praja2 (D5 and F11). The analysis was conducted in cells treated with doxycycline versus untreated cells. Data are shown as normalized expression values in log2 scale and centered on the median value. d Functional enrichment analysis enriched by IPA of the differentially expressed RNA transcripts identified in the dataset KO praja2 vs WT. Only pathways with P ≤ 0.05 were considered for the further analysis. e Heatmap showing the activation state, measured as Z-score values, of the canonical pathways statistically significant (P ≤ 0.05), involving differentially expressed RNA transcripts in Doxy vs NT and KO praja2 vs WT sets, respectively. f Real-time oxygen consumption rate (OCR) of the two different clones of A-498 cells stably expressing FLAG-praja2 (D5 and F11) compared to cells expressing empty vector was measured at 37 °C using a Seahorse XF Analyzer (Seahorse Bioscience, North Billerica, MA, USA). Cells were plated into specific cell culture microplates (Agilent, USA) at the concentration of 3 × 104 cells/well, and cultured for the last 12 h in DMEM, 10% FBS, in the presence of doxycycline. OCR was measured in XF media (non-buffered DMEM medium, containing 10 mM glucose, 2 mM L-glutamine, and 1 mM sodium pyruvate) under basal condition and after the sequential addition of 1.5 µM oligomycin, 2 µM FCCP, and rotenone + antimycin (0.5 µM all) (all from Agilent). Indices of mitochondrial respiratory function were calculated from OCR profile: basal OCR (before addition of oligomycin), maximal respiration (calculated as the difference of FCCP rate and antimycin + rotenone rate) and ATP production (calculated as the difference between basal OCR and oligomycin-induced OCR). Reported data are the mean values ± S.E.M. of four measurements deriving from two independent experiments.
Fig. 8
Fig. 8. Upregulation of RTKs in praja2 knockout (KO) mouse kidneys.
a Schematic view of the targeted genomic locus of mouse praja2. Following deletion of the Neo Cassette by Flpe and Exon 1 and 2 by Hprt-Cre recombinases, respectively, the constitutive praja2 KO mouse line was obtained. b The offsprings from praja2+/− intercrosses were genotyped by PCR analysis of tail DNA. Bands corresponding to wild type (466 bp) and KO (320 bp) alleles were obtained using the couples of primers FNFFw/FNFRw and LNLFw/FNFRw, respectively. c Histological examination of kidney samples: hematoxylin/eosin (H/E) (a′, b′) and ERG-immunolabeled nuclei of endothelial cells (c′, d′) are shown. Magnification 40X. Wild-type kidney samples (a′–c′) show unremarkable histopathological changes. In praja2 KO kidneys (b′–d′), a prominent, ectatic dilatation of vessels bound only by a very slender and flattened endothelium was evident. Vascular enlargement and ectasia are bordered by ERG-immunolabeled nuclei (arrows) consisting of endothelium (d′). d Immunohistochemistry analysis for EGFR, VEGFR, and ERG in renal tissues from control (c57, left panels) and praja2 KO mice (79, right panels). Magnification 106×. e Growth factor binding to its cognate receptor (receptor tyrosine kinase, RTK) at cell membrane induces receptor activation and signaling. Ubiquitylation of the adapter protein AP2m1 by praja2 regulates receptor endocytosis and clearance, thus attenuating the mitogenic cascade. Downregulation of praja2 in clear cell carcinoma by oncogenic miRNAs and the proteasome impairs endocytosis and supports RTK signaling and cancer cell growth.

References

    1. D’Avella C, Abbosh P, Pal SK, Geynisman DM. Mutations in renal cell carcinoma. Urol. Oncol. 2020;38:763–773. doi: 10.1016/j.urolonc.2018.10.027. - DOI - PubMed
    1. Zarrabi K, Paroya A, Wu S. Emerging therapeutic agents for genitourinary cancers. J. Hematol. Oncol. 2019;12:89. doi: 10.1186/s13045-019-0780-z. - DOI - PMC - PubMed
    1. Moch H, Cubilla AL, Humphrey PA, Reuter VE, Ulbright TM. The 2016 WHO classification of tumours of the urinary system and male genital organs-part A: renal, penile, and testicular tumours. Eur. Urol. 2016;70:93–105. doi: 10.1016/j.eururo.2016.02.029. - DOI - PubMed
    1. Parker AS, et al. Loss of expression of von Hippel-Lindau tumor suppressor protein associated with improved survival in patients with early-stage clear cell renal cell carcinoma. Urology. 2005;65:1090–1095. doi: 10.1016/j.urology.2004.12.040. - DOI - PubMed
    1. Bissler JJ, Christopher Kingswood J. Renal manifestation of tuberous sclerosis complex. Am. J. Med. Genet. C Semin. Med. Genet. 2018;178:338–347. doi: 10.1002/ajmg.c.31654. - DOI - PubMed

Publication types