. 2024 Feb 14:35:346-361.
doi: 10.1016/j.bioactmat.2024.02.011. eCollection 2024 May.

Piezoelectric hydrogel for treatment of periodontitis through bioenergetic activation

Affiliations

Piezoelectric hydrogel for treatment of periodontitis through bioenergetic activation

Xin Liu et al. Bioact Mater. .

Abstract

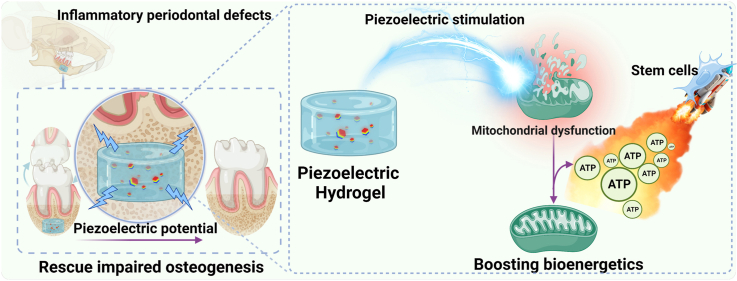
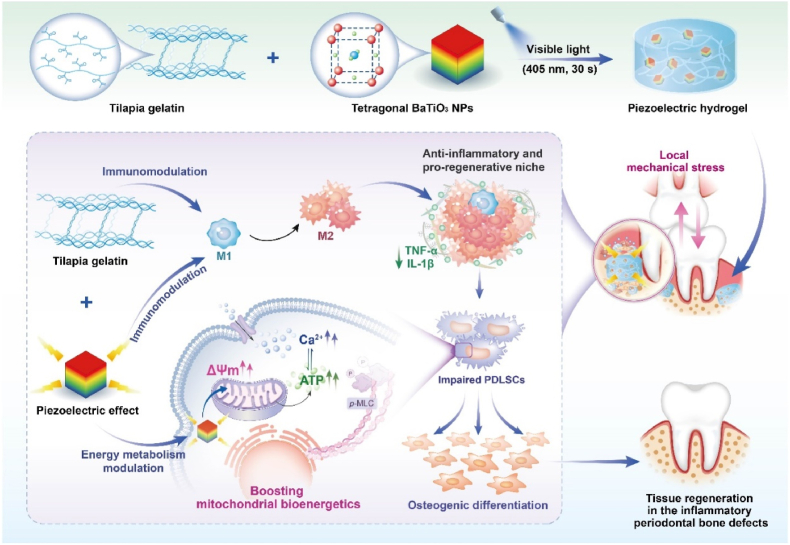
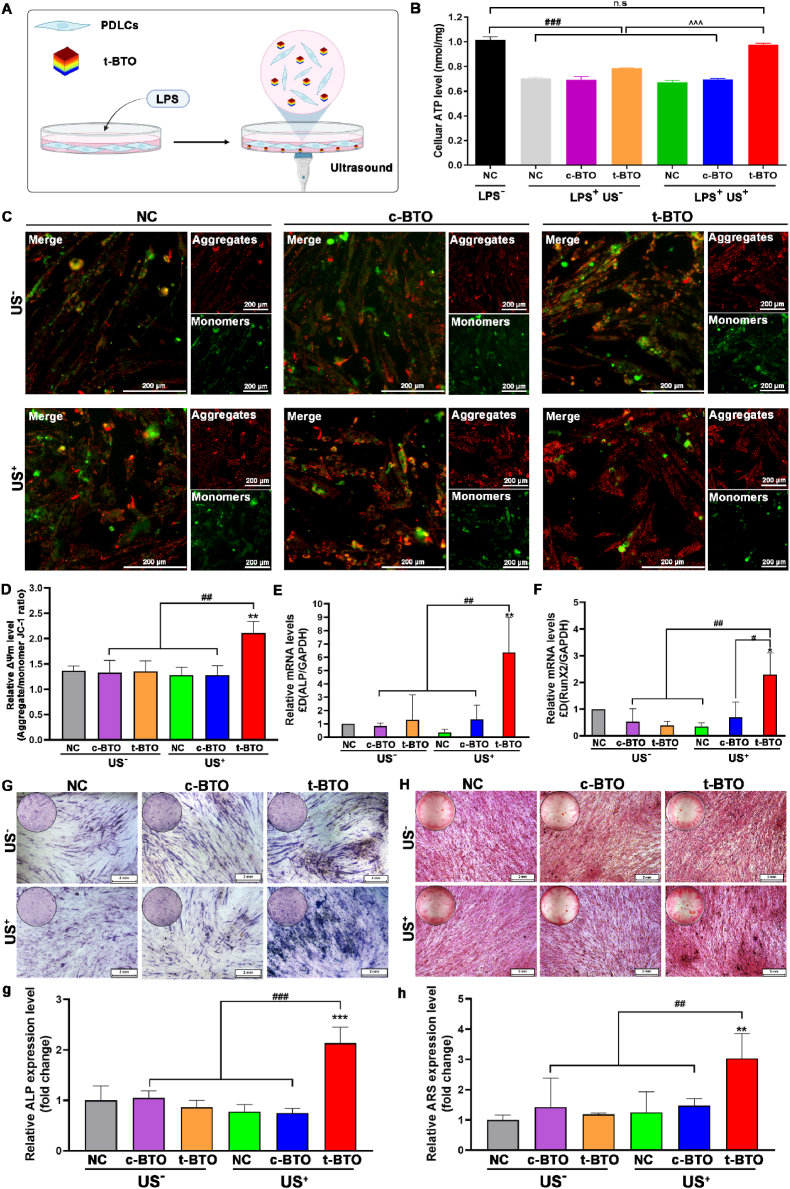
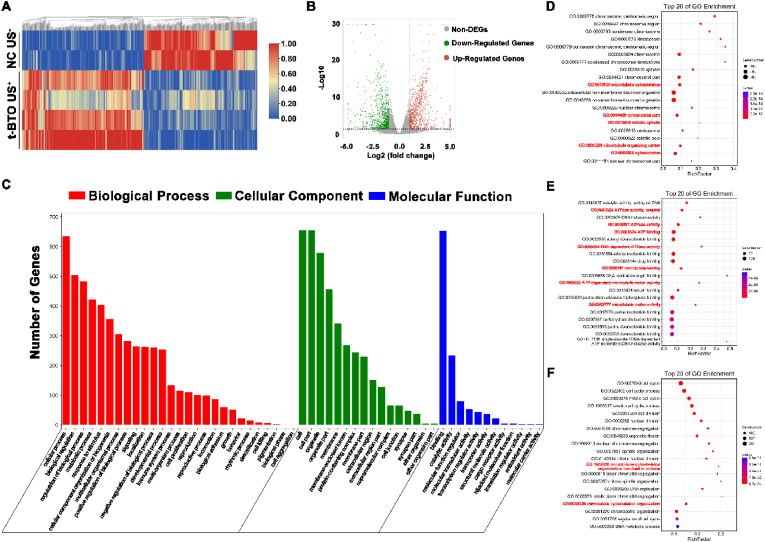
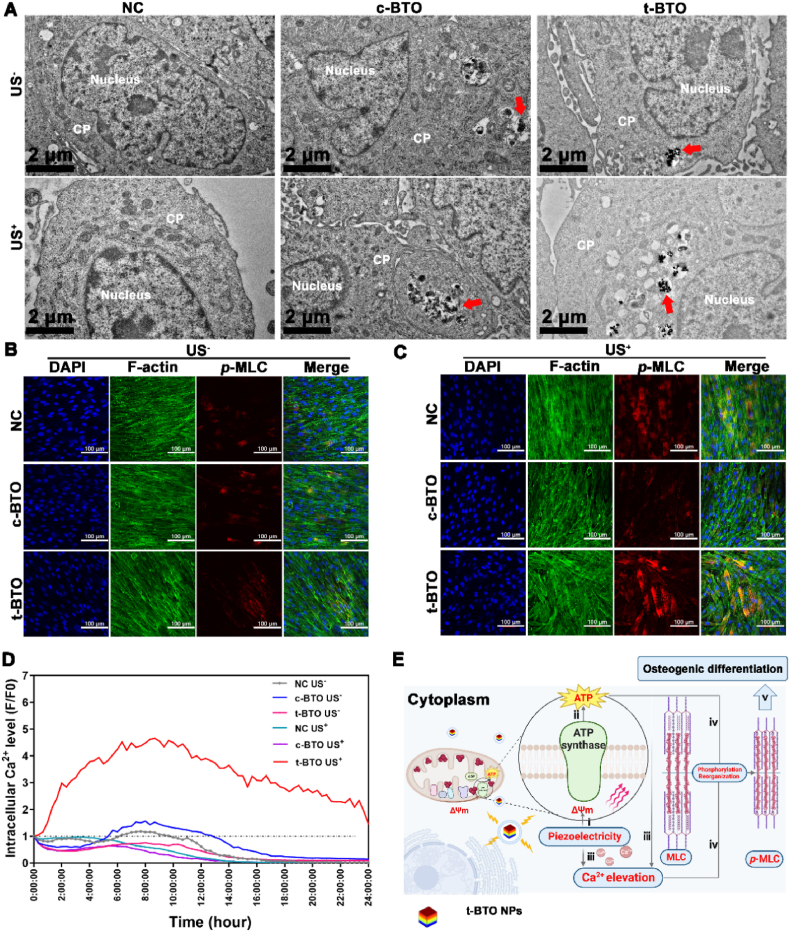
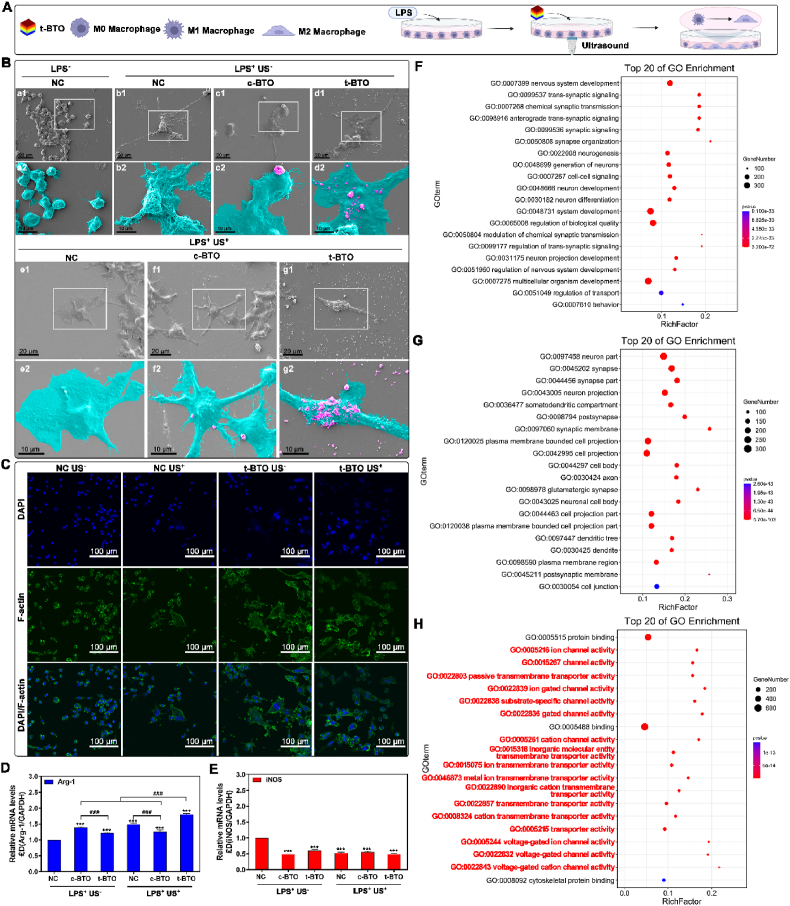
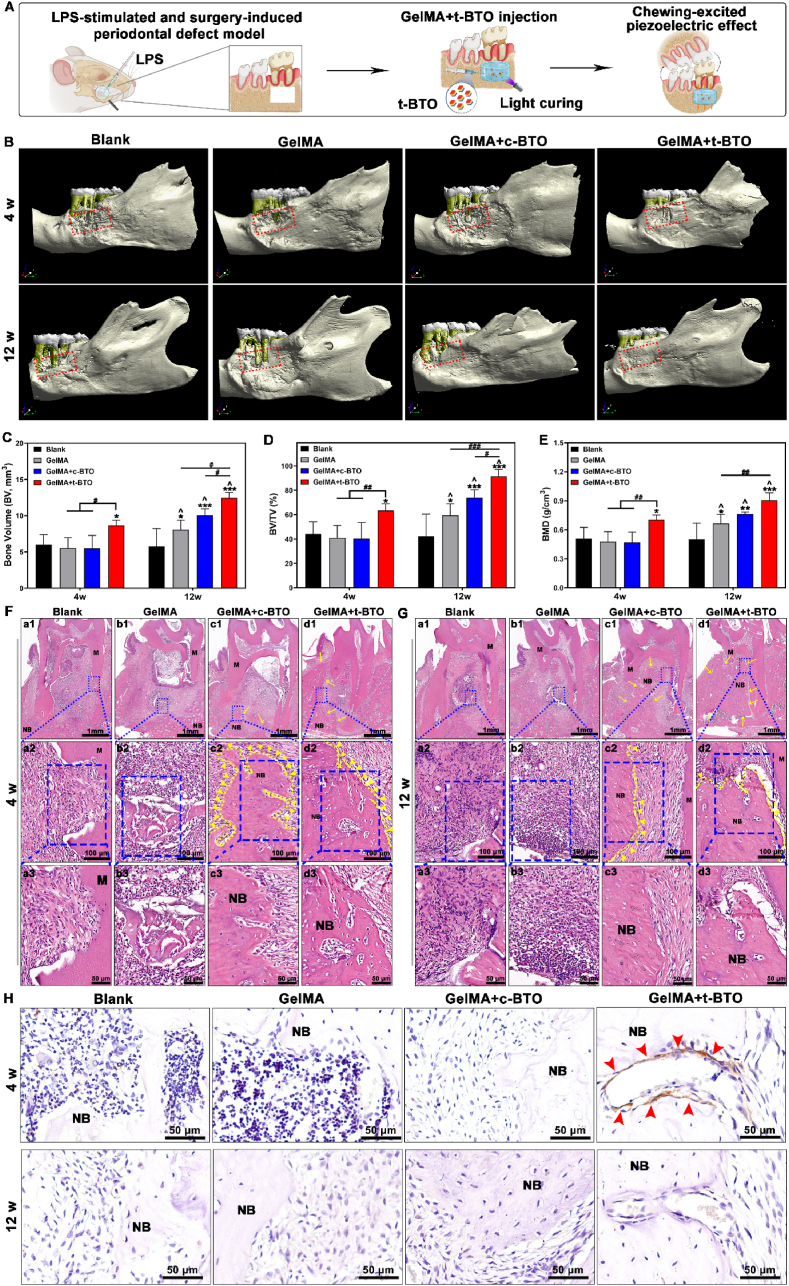
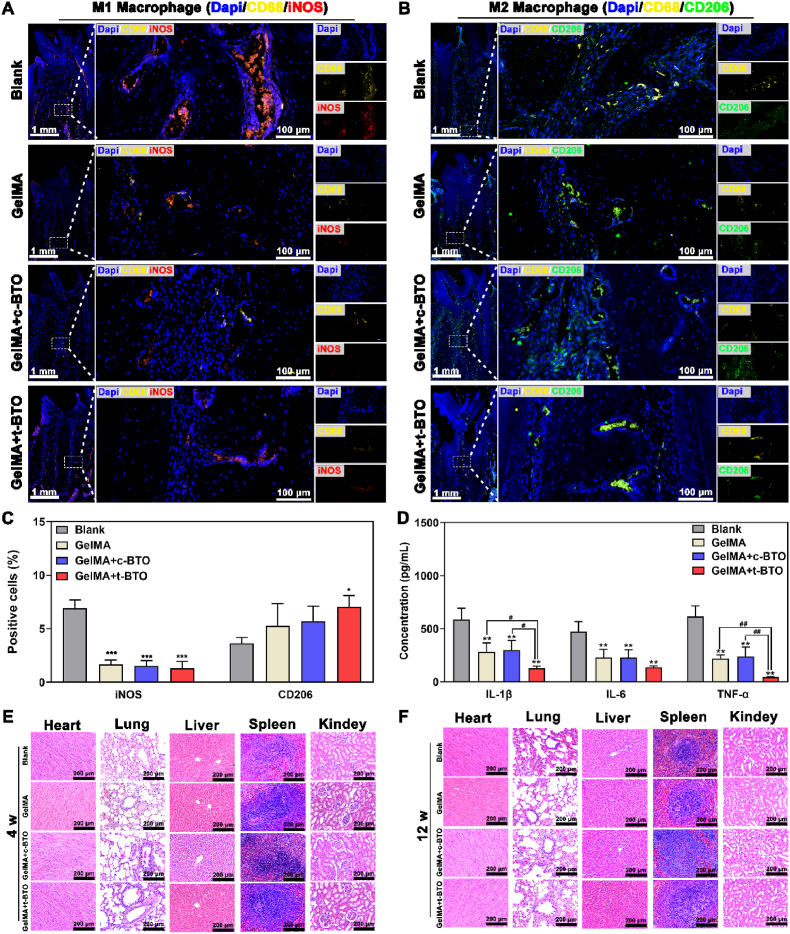
The impaired differentiation ability of resident cells and disordered immune microenvironment in periodontitis pose a huge challenge for bone regeneration. Herein, we construct a piezoelectric hydrogel to rescue the impaired osteogenic capability and rebuild the regenerative immune microenvironment through bioenergetic activation. Under local mechanical stress, the piezoelectric hydrogel generated piezopotential that initiates osteogenic differentiation of inflammatory periodontal ligament stem cells (PDLSCs) via modulating energy metabolism and promoting adenosine triphosphate (ATP) synthesis. Moreover, it also reshapes an anti-inflammatory and pro-regenerative niche through switching M1 macrophages to the M2 phenotype. The synergy of tilapia gelatin and piezoelectric stimulation enhances in situ regeneration in periodontal inflammatory defects of rats. These findings pave a new pathway for treating periodontitis and other immune-related bone defects through piezoelectric stimulation-enabled energy metabolism modulation and immunomodulation.

Keywords: Bone regeneration; Macrophage polarization; Mitochondrial bioenergetics; Periodontitis; Piezoelectric hydrogel.


Conflict of interest statement

The authors declare that they have no known competing financial interests or personal relationships that could have appeared to influence the work reported in this paper.

Figures

Image 1
Graphical abstract
Scheme 1
Scheme 1
Scheme illustrating the piezoelectric hydrogel for osteogenesis and immunomodulation in periodontitis through activation of bioenergetics.
Fig. 1
Fig. 1
Structural characterization and piezoelectric properties of BTO NPs. (A) XRD pattern of t-BTO NPs and the enlarged region in the red dot circle. (B) SEM image and the size distribution (inset) of t-BTO NPs. (C) TEM image of t-BTO NPs. (D) HRTEM image of t-BTO NPs and corresponding SAED pattern showing in the inset. (E) EDX surface-scan element distribution of Ba, Ti and O of t-BTO NPs. (F) Raman spectra of t-BTO NPs. (G, H) Height, piezoelectric amplitude and phase images of t-BTO NPs (G) and c-BTO NPs (H). (I, J) Amplitude loop curve and phase loop curve of c-BTO NPs (I) and t-BTO NPs (J) at an ac voltage from −4 V to 4 V. (K) The polarization-electric field (P–E) hysteresis curves of c-BTO NPs and t-BTO NPs. (L) COMSOL simulation of the piezopotential generated by one single t-BTO NP under varied US intensities. Inset displays the piezopotential distribution under 2 W cm−2 US stimulation.
Fig. 2
Fig. 2
Characterization of piezoelectric properties of piezoelectric hydrogels. (A) SEM images and EDX surface-scan element distribution of GelMA, GelMA + c-BTO, and GelMA + t-BTO. (B) Compressive stress-strain curves (the inserted picture represents elastic modulus) and (C) compression strength of GelMA, GelMA + c-BTO, and GelMA + t-BTO. (D) Schematic diagram of the piezoelectric performance test system for the piezoelectric hydrogels. (E) Open-circuit voltages of generator devices made from various hydrogels under a force of 200 kPa. (F) Open-circuit voltages of devices made from GelMA + t-BTO hydrogel under variable forces from 50 to 300 kPa. (G) Open-circuit voltages of device made from GelMA + t-BTO hydrogel under constant force within the frequency range of 0.5–3.5 Hz. (H) Mechanical-electric response of GelMA + t-BTO hydrogel before and after ultrasound stimulation.
Fig. 3
Fig. 3
Piezoelectric stimulation influences ATP levels, mitochondria membrane potential (ΔΨm), osteogenic differentiation-related gene expression, and mineralization in L-PDLSCs. (A) Schematic diagram of cellular experiment design. (B) Cellular ATP level of L-PDLSCs after various treatments for 3 days. n. s. p>0.05, ###p<0.001 vs. negative control (NC) without LPS (LPS). ^^^p<0.001 significant differences between groups under LPS stimulation. (C) Representative ΔΨm fluorescence image and (D) quantitative analysis of the ratio of aggregates/monomers fluorescent intensity of L-PDLSCs after various treatments. **p<0.01 vs. NC US group. ##p<0.01 significant differences between groups. (E, F) Osteogenic differentiation-related gene ALP (E) and RunX2 (F) expression of L-PDLSCs after various treatments for 5 days. *p<0.05, **p<0.01 vs. NC US group. #p<0.05, ##p<0.01 significant differences between groups. (G) Osteogenic mineralization-related ALP staining of L-PDLSCs after various treatments for 14 days, and (g) the relative ALP level in all groups. (H) Osteogenic mineralization-related ARS staining of L-PDLSCs after various treatments for 21 days, and (h) the relative ARS level in all groups. (NC US: negative control without ultrasound; c-BTO US: cubic BaTiO3 without ultrasound; t-BTO US: tetragonal BaTiO3 without ultrasound; NC US+: negative control with ultrasound; c-BTO US+: cubic BaTiO3 with ultrasound; t-BTO US+: tetragonal BaTiO3 with ultrasound).
Fig. 4
Fig. 4
Piezoelectric stimulation enhances ATPase activity and cytoskeleton organization-related gene clusters in the gene profile of L-PDLSCs. (A) Hierarchical cluster heatmap of differentially expressed genes (DEGs) in the NC US and the t-BTO US+ groups. Hierarchical cluster analysis was conducted for DEGs using a fold change <0.5 or >2 and P < 0.05. Red areas represent up-regulated DEGs, and blue areas represent down-regulated DEGs. (B) Volcano plot of DEGs in the NC US group and t-BTO US+ group. The detected genes are presented in the volcano plot using log 2 (fold change) as the x-axis and log 10 (P-value) as the y-axis. Red represents up-regulated DEGs, green represents down-regulated DEGs, and gray represents non-DEGs. (C) The differential genes were assigned to three GO categories: biological process, cellular component, and molecular function. (D, E, F) Top 20 bubble charts of the biological process (D), cellular component (E), and molecular function (F) of GO enrichment analysis for the up-regulated DEGs in the t-BTO US+ group. Low q-values are in red and high q-values are in blue; the size of the circle was proportional to the number of enriched genes.
Fig. 5
Fig. 5
Piezoelectric stimulation influences p-MLC expression and intercellular Ca2+ level in L-PDLSCs. (A) TEM images for intracellular localization of NPs. CP: Cytoplasm, Red arrow indicated NPs. (B, C) Representative p-MLC fluorescence image of L-PDLSCs exposed to the different groups at 3 days. (D) Intracellular Ca2+ level of L-PDLSCs after various treatments. (E) Mechanism schematic for the piezoelectric stimulation-mediated osteogenic differentiation of L-PDLSCs: i) piezoelectricity boosts Δψm, ii) promotes intracellular ATP synthesis; iii) piezoelectricity and elevated ATP cause a rise in [Ca2+]i; iv) ATP hydrolysis and Ca2+ drive MLC phosphorylation mediating cell contraction and reorganization, and v) further osteogenic differentiation.
Fig. 6
Fig. 6
Piezoelectric stimulation modulates M2 polarization of macrophages. (A) Schematic diagram of experimental design. (B) Representative SEM images of L-RAW 264.7 cells morphology cultured with different groups. (a2-g2): high magnification pseudo-colored micrographs of the white box area in (a1-g1). Tiffany blue represents L-RAW 264.7 cells, and peachy red represents nanoparticles. (C) Representative fluorescence image of L-RAW 264.7 cells after various treatments. (D, E) Phenotype-related gene Arg-1 (D) and iNOS (E) expression of L-RAW264.7 cells after various treatments. ***p<0.001 vs. NC US. ###p<0.001 significant differences between groups. (F–H) Top 20 bubble charts of the biological process (F), cellular component (G), and molecular function (H) of GO enrichment analysis in the NC US group and t-BTO US+ group. Low q-values are in red and high q-values are in blue; the size of the circle is proportional to the number of enriched genes.
Fig. 7
Fig. 7
Piezoelectric hydrogel promotes bone regeneration in periodontitis-periodontal defects. (A) Schematic diagram of the LPS and surgery-induced periodontitis defect model and treatment with the piezoelectric hydrogel. (B) Representative Micro-CT 3D construction images of bone repair after 4 weeks and 12 weeks post-surgery in the Blank group, GelMA group, GelMA + c-BTO group, and GelMA + t-BTO group. The red dotted frame denotes the defective area. (C) New bone volume (BV) analysis of the four groups at 4 weeks and 12 weeks. (D) Bone volume/total volume fraction (BV/TV) analysis of four groups at 4 w and 12 w. (E) Bone mineral density (BMD) analysis of the four groups at 4 weeks and 12 weeks. (F, G) H&E staining images of the four groups at 4 weeks (F) and 12 weeks (G). (a2-d2, 20 × ) Magnified images of the blue dashed region in (a1-d1, 2 × ), (a3-d3, 40 × ) Magnified images of the blue dashed region in (a2-d2, 40 × ). M: molar; NB: new bone. (H) Representative p-MLC immunohistochemistry images (80 × ) of the four groups at 4 weeks and 12 weeks. Red arrows point to the expressed p-MLC. *p < 0.05, **p < 0.01, ***p < 0.001 vs. Blank group at 4w and 12w. #p<0.05, ##p<0.01, ###p<0.001 significant differences between groups. ^ p<0.05 significant differences between 4 weeks and 12 weeks.
Fig. 8
Fig. 8
Piezoelectric hydrogel exhibits no major organ damage and reduces inflammatory response by modulating M1/M2 macrophages in periodontitis-periodontal defects. (A–C) Representative fluorescence images and positive percentage of M1 and M2 macrophages in the defects of the four groups at 12 weeks. (D) Salivary inflammatory factors (IL-1β, IL-6, and TNF-α) after 12 weeks of post-surgery. (E, F) H&E staining images (10 × ) of major organs in the four groups at 4 weeks and 12 weeks. *p < 0.05, **p < 0.01 vs. Blank group. #p<0.05, ##p<0.01 significant differences between groups.

References

    1. Kinane D.F., Stathopoulou P.G., Papapanou P.N. Periodontal diseases. Nat. Rev. Dis. Prim. 2017;3(1):1–14. - PubMed
    1. Roth G.A., Abate D., Abate K.H., Abay S.M., Abbafati C., Abbasi N., Abbastabar H., Abd-Allah F., Abdela J., Abdelalim A. Global, regional, and national age-sex-specific mortality for 282 causes of death in 195 countries and territories, 1980–2017: a systematic analysis for the Global Burden of Disease Study 2017. Lancet. 2018;392(10159):1736–1788. - PMC - PubMed
    1. Hajishengallis G., Chavakis T. Local and systemic mechanisms linking periodontal disease and inflammatory comorbidities. Nat. Rev. Immunol. 2021;21(7):426–440. - PMC - PubMed
    1. Hajishengallis G. Periodontitis: from microbial immune subversion to systemic inflammation. Nat. Rev. Immunol. 2015;15(1):30–44. - PMC - PubMed
    1. Li P., Ou Q., Shi S., Shao C. Immunomodulatory properties of mesenchymal stem cells/dental stem cells and their therapeutic applications. Cell. Mol. Immunol. 2023;20(6):558–569. - PMC - PubMed

LinkOut - more resources