

Integrating fecal metabolomics and intestinal microbiota to study the mechanism of cannabidiol in the treatment of idiopathic pulmonary fibrosis
- PMID: 38379898
- PMCID: PMC10877013
- DOI: 10.3389/fphar.2024.1358626
Integrating fecal metabolomics and intestinal microbiota to study the mechanism of cannabidiol in the treatment of idiopathic pulmonary fibrosis
Abstract
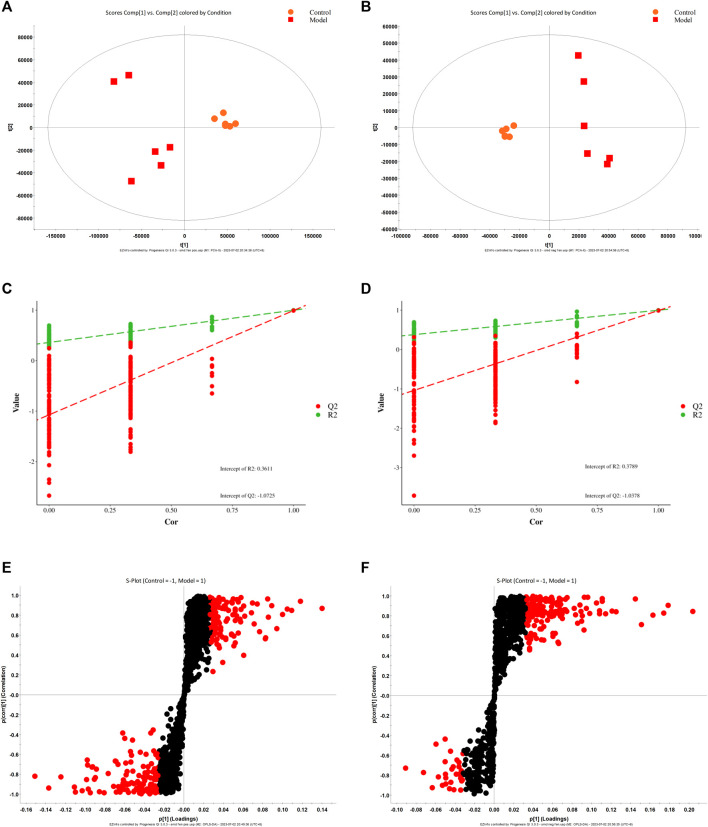
Introduction: Idiopathic pulmonary fibrosis is a chronic interstitial lung disease characterized by excessive deposition of extracellular matrix. Cannabidiol, a natural component extracted from plant cannabis, has been shown to have therapeutic effects on lung diseases, but its exact mechanism of action is unknown, hindering its therapeutic effectiveness. Methods: To establish a pulmonary fibrosis model, combined with UPLC-Q-TOF/MS metabolomics and 16S rDNA sequencing, to explore cannabidiol's mechanism in treating pulmonary fibrosis. The rats were randomly divided into the control group, pulmonary fibrosis model group, prednisone treatment group, and cannabidiol low, medium, and high dose groups. The expression levels of HYP, SOD, and MDA in lung tissue and the expression levels of TNF-α, IL-1β, and IL-6 in serum were detected. Intestinal microbiota was detected using UPLC-QTOF/MS analysis of metabolomic properties and 16S rDNA sequencing. Results: Pathological studies and biochemical indexes showed that cannabidiol treatment could significantly alleviate IPF symptoms, significantly reduce the levels of TNF-α, IL-1β, IL-6, MDA, and HYP, and increase the expression level of SOD (p < 0.05). CBD-H can regulate Lachnospiraceae_NK4A136_group, Pseudomonas, Clostridia_UCG-014, Collinsella, Prevotella, [Eubacterium]_coprostanoligenes_group, Fusobacterium, Ruminococcus, and Streptococcus, it can restore intestinal microbiota function and reverse fecal metabolism trend. It also plays the role of fibrosis through the metabolism of linoleic acid, glycerol, linolenic acid, and sphingolipid. Discussion: Cannabidiol reverses intestinal microbiota imbalance and attenuates pulmonary fibrosis in rats through anti-inflammatory, antioxidant, and anti-fibrotic effects. This study lays the foundation for future research on the pathological mechanisms of IPF and the development of new drug candidates.
Keywords: cannabidiol; intestinal microbiota; mechanism; metabolomics; pulmonary fibrosis.
Copyright © 2024 Sun, Zhang, Lu, Yu, Wang, Chen and Liu.
Conflict of interest statement
The authors declare that the research was conducted in the absence of any commercial or financial relationships that could be construed as a potential conflict of interest.
Figures


Similar articles
-
The role of the microbiota and metabolites in the treatment of pulmonary fibrosis with UC-MSCs: Integrating fecal metabolomics and 16S rDNA analysis.PLoS One. 2025 Jan 9;20(1):e0313989. doi: 10.1371/journal.pone.0313989. eCollection 2025. PLoS One. 2025. PMID: 39787138 Free PMC article.
-
The mechanism of Qingwen Gupi decoction on pulmonary fibrosis based on metabolomics and intestinal flora.J Appl Microbiol. 2023 Jan 23;134(1):lxac035. doi: 10.1093/jambio/lxac035. J Appl Microbiol. 2023. PMID: 36626779
-
Assessment of progression of pulmonary fibrosis based on metabonomics and analysis of intestinal microbiota.Artif Cells Nanomed Biotechnol. 2024 Dec;52(1):201-217. doi: 10.1080/21691401.2024.2326616. Epub 2024 Mar 15. Artif Cells Nanomed Biotechnol. 2024. PMID: 38488151
-
A molecular basis for the anti-inflammatory and anti-fibrosis properties of cannabidiol.FASEB J. 2020 Nov;34(11):14083-14092. doi: 10.1096/fj.202000975R. Epub 2020 Sep 3. FASEB J. 2020. PMID: 32885502 Review.
-
Protective role of baicalin in the dynamic progression of lung injury to idiopathic pulmonary fibrosis: A meta-analysis.Phytomedicine. 2023 Jun;114:154777. doi: 10.1016/j.phymed.2023.154777. Epub 2023 Mar 20. Phytomedicine. 2023. PMID: 37018850
Cited by
-
Potential of gut microbiota metabolites in treating COPD: network pharmacology and Mendelian randomization approaches.Front Microbiol. 2024 Nov 25;15:1416651. doi: 10.3389/fmicb.2024.1416651. eCollection 2024. Front Microbiol. 2024. PMID: 39654679 Free PMC article.
-
Medicinal Cannabis and the Intestinal Microbiome.Pharmaceuticals (Basel). 2024 Dec 17;17(12):1702. doi: 10.3390/ph17121702. Pharmaceuticals (Basel). 2024. PMID: 39770543 Free PMC article. Review.
References
LinkOut - more resources
Full Text Sources