. 2024 Feb 8;3(2):pgae057.
doi: 10.1093/pnasnexus/pgae057. eCollection 2024 Feb.

Gene inversion led to the emergence of brackish archaeal heterotrophs in the aftermath of the Cryogenian Snowball Earth

Affiliations

Gene inversion led to the emergence of brackish archaeal heterotrophs in the aftermath of the Cryogenian Snowball Earth

Lu Fan et al. PNAS Nexus. .

Abstract

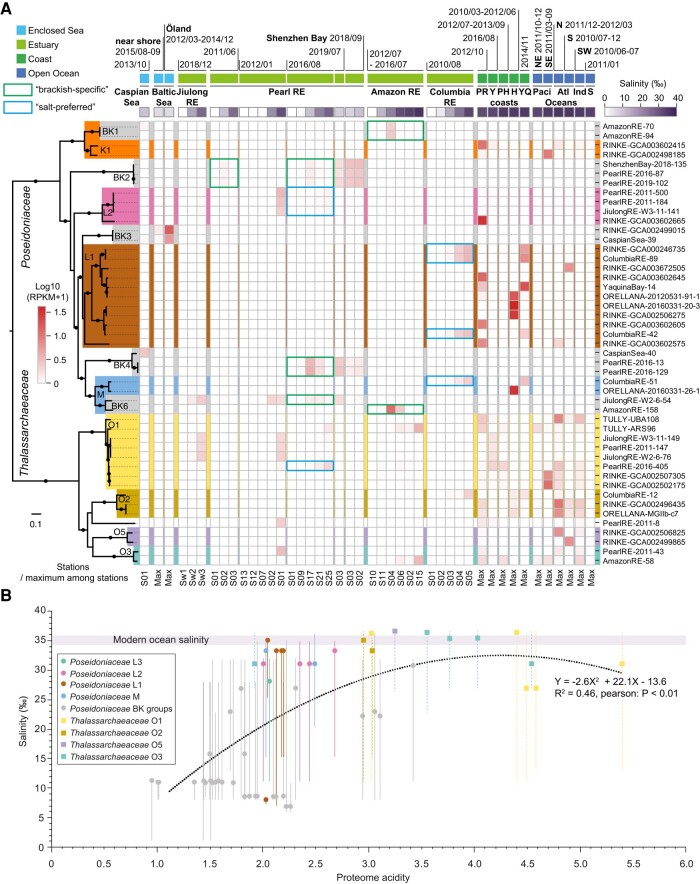
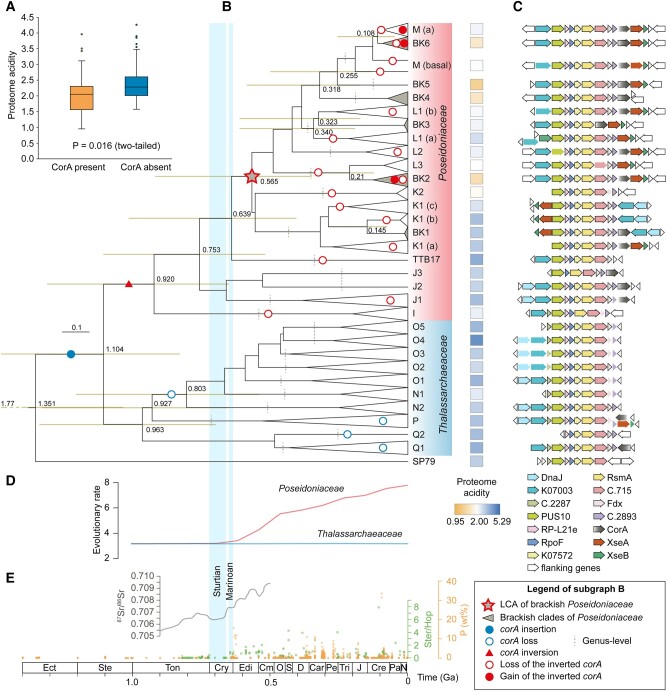
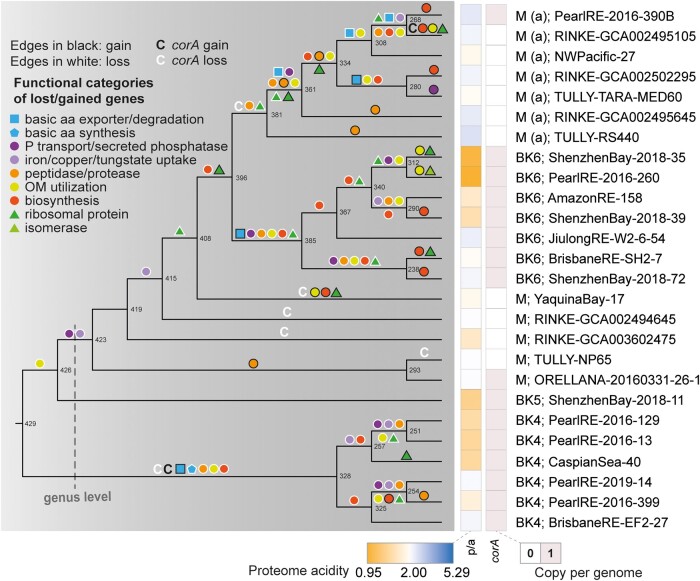
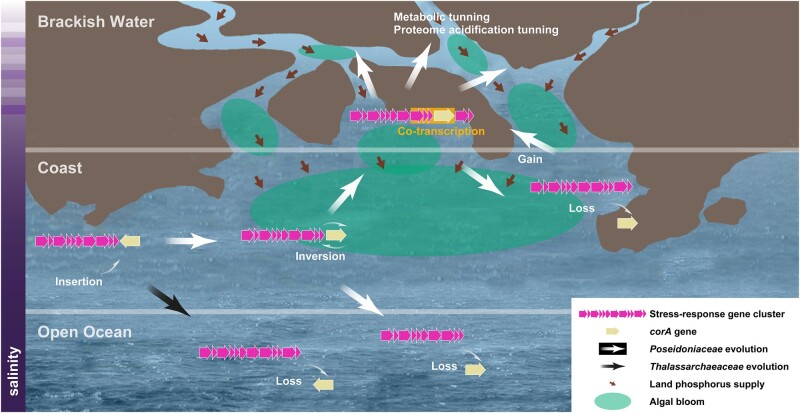
Land-ocean interactions greatly impact the evolution of coastal life on earth. However, the ancient geological forces and genetic mechanisms that shaped evolutionary adaptations and allowed microorganisms to inhabit coastal brackish waters remain largely unexplored. In this study, we infer the evolutionary trajectory of the ubiquitous heterotrophic archaea Poseidoniales (Marine Group II archaea) presently occurring across global aquatic habitats. Our results show that their brackish subgroups had a single origination, dated to over 600 million years ago, through the inversion of the magnesium transport gene corA that conferred osmotic-stress tolerance. The subsequent loss and gain of corA were followed by genome-wide adjustment, characterized by a general two-step mode of selection in microbial speciation. The coastal family of Poseidoniales showed a rapid increase in the evolutionary rate during and in the aftermath of the Cryogenian Snowball Earth (∼700 million years ago), possibly in response to the enhanced phosphorus supply and the rise of algae. Our study highlights the close interplay between genetic changes and ecosystem evolution that boosted microbial diversification in the Neoproterozoic continental margins, where the Cambrian explosion of animals soon followed.

Keywords: Snowball Earth; archaeal evolution; brackish microorganisms; gene inversion; osmotic stress.


Figures

Fig. 1.
Fig. 1.
Global distribution and proteome adaptation of brackish- and marine-specific Poseidoniales. A) Abundance pattern of Poseidoniales MAGs based on 246 metagenome samples from surface waters of global marine and brackish environments. MAGs with RPKM value >1 in enclosed sea and estuarine samples and >5 in coastal and oceanic samples are shown. The maximum-likelihood tree at the left of the panel is reconstructed based on 83 marker genes as the subset of the ar122 (40) (see Materials and methods). Solid dots on internal branches show branch supports of ultra-fast bootstrapping (1,000) in IQTree >95%. The letter codes and the shade colors of the genus-level subgroups are consistent with Rinke et al. (32), except for brackish clades (labeled with a prefix “BK”) which are in gray. Abbreviations of sampling areas are: RE, river estuary; PR, Pearl River estuary; Y, Yangtze River estuary; PH, Port Hacking; H, Helgoland; YQ, Yaquina Bay; Alt, Atlantic; Ind, Indian; S, Southern/South; N, North; NE, Northeast; SW, Southwest; and SE, Southeast. Salinity shows the sample salinity or the average of the collection of samples. RPKM shows the abundance or the maximum abundance of each MAG in each sample or a collection of samples, respectively. B) Habitat salinity and proteome acidity of Poseidoniales MAGs found in estuaries and enclosed seas. Circles and solid lines belong to Poseidoniaceae MAGs, while squares and dashed lines belong to Thalassarchaeaceae MAGs. The position of each dot on the y-axis shows the optimal salinity of that organism. The scale of each vertical line on the y-axis shows the upper and lower limits of salinity for that organism. The different colors of circles, squares, and lines show Poseidoniales genus-level subgroups in consistent with those in Fig. 1 of Rinke et al. (32), except for brackish clades whose circles and lines are in gray. The regression of these dots is shown as the dashed black line.
Fig. 2.
Fig. 2.
Genetic changes, evolutionary rate, and geological background in the origination and evolution of brackish Poseidoniales. A) The distribution of proteome acidity in genomes of Poseidoniaceae with or without the corA gene. B) Molecular dating results and proteome acidity patterns of Poseidoniales subgroups with the change of the corA gene in evolution. The tree is part of the tree in Fig. S11A, which is reconstructed based on 39 of the 41 marker proteins described by Adam et al. (45). Values on the nodes show a 95% CI. The letter codes of the genus-level subgroups are consistent with Rinke et al. (32). Genus-level cutoff in the tree is derived from RED of GTDB taxonomic ranking (46). Small letters in brackets show subgenus-level subgroups. Proteome acidity levels at the right show the median values of MAGs in each clade. TTB17 = TULLY-TrashBin17. C) Arrangement of the stress-response gene cluster in Poseidoniales genomes. Arrows without edges suggest that the genes are present only in some of the MAGs in each clade. Potential functions of genes are explained in Supplementary material. The completeness values of the representative MAGs in each genus/subgeneric subgroup range from 75.41 to 100% (median = 98.43%). Gene arrangement and synteny of each genus/subgeneric subgroup shown in Fig. 2C was summarized based on the observation in the MAGs in Fig. S9. The adjacency of these genes was based on evidence from a single contig in each MAG. Moreover, genes up- and down-streaming the gene cluster were also present in the same contig, therefore precluding gene absence caused by assembly problems. D) Evolutionary rate changes of Poseidoniaceae and Thalassarchaeaceae. E) Geological records of phosphorus deposit in shales from Reinhard et al. (22), the 87Sr/86Sr curve copied from Fig. 1 of Laakso et al. (47), and the relative contribution of eukaryotic and bacterial lipids to sedimentary organic matter is approximated by the sterane/hopane ratio (Ster/Hop) by Brocks et al (27). Glaciation events are based on Hoffman et al. (48). P, phosphorus; Ect, Ectasian; Ste, Stenian; Ton, Tonian; Cry, Cryogenian; Edi, Ediacaran; Cm, Cambrian; O, Ordovician; S, Silurian; D, Devonian; Car, Carboniferous; Pe, Permian; Tri, Triassic; J, Jurassic; Cre, Cretaceous; Pa, Paleogene; N, Neogene; Ga, billion years ago.
Fig. 3.
Fig. 3.
Essential gene-gain and gene-loss events in the marine–brackish divergence of the BK4-BK5-M-BK6 monophyletic clade of Poseidoniaceae. The cladogram of the BK4-BK5-M-BK6 subclade of the tree in Fig. S13A is shown. The letter codes of the genus-level subgroups are consistent with Rinke et al. (32). Genus-level cutoff in the tree is derived from RED of GTDB taxonomic ranking (46). Small letters in brackets show subgenus-level subgroups. Node numbers are shown in consistence with Table S4. Gene-gain and gene-loss events between adjacent internal nodes or between adjacent internal nodes and terminal taxa are illustrated on relevant branches. Capital C means the corA gene. MAG completeness values range from 66.5 to 100% (median = 93.63%), and the contamination values range from 0 to 4.35% (median = 0).
Fig. 4.
Fig. 4.
A schematic diagram shows the process of genetic changes during the transition of Poseidoniales between salinity distinct habitats and environmental features in the origination of brackish Poseidoniaceae in the Ediacaran-Cambrian coasts.

Similar articles

Cited by

References

    1. Lee CE, Bell MA. 1999. Causes and consequences of recent freshwater invasions by saltwater animals. Trends Ecol Evol. 14:284–288. - PubMed
    1. Lozupone CA, Knight R. 2007. Global patterns in bacterial diversity. Proc Natl Acad Sci U S A. 104:11436–11440. - PMC - PubMed
    1. Logares R, et al. . 2009. Infrequent marine-freshwater transitions in the microbial world. Trends Microbiol. 17:414–422. - PubMed
    1. Herlemann DP, et al. . 2011. Transitions in bacterial communities along the 2000 km salinity gradient of the Baltic Sea. ISME J. 5:1571–1579. - PMC - PubMed
    1. Hugerth LW, et al. . 2015. Metagenome-assembled genomes uncover a global brackish microbiome. Genome Biol. 16:279. - PMC - PubMed