

The deadliest local police departments kill 6.91 times more frequently than the least deadly departments, net of risk, in the United States
- PMID: 38380060
- PMCID: PMC10878363
- DOI: 10.1093/pnasnexus/pgae026
The deadliest local police departments kill 6.91 times more frequently than the least deadly departments, net of risk, in the United States
Abstract
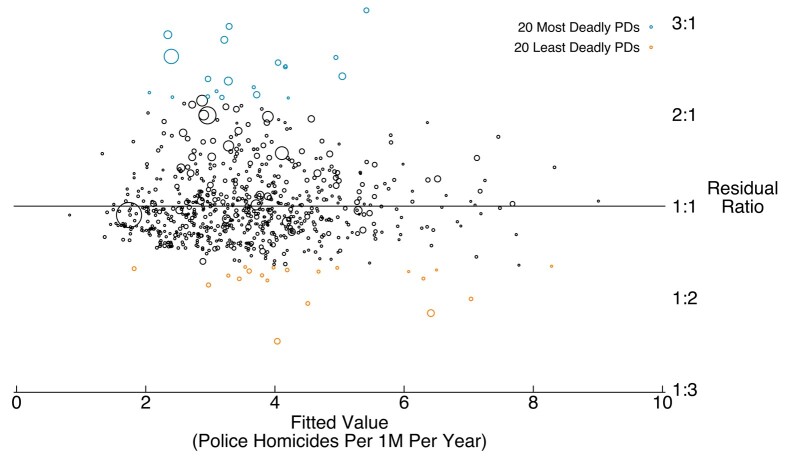
I use data linking counts of homicides by police to police department (PD) and jurisdiction characteristics to estimate benchmarked (i.e. risk-adjusted) police homicide rates in 2008-2017 among the 711 local PDs serving 50,000 or more residents, a sample with demographics resembling all mid-to-large Census places. The benchmarked rate estimates capture PD deadliness by comparing PDs to peers whose officers face similar risks while adjusting for access to trauma care centers to account for differential mortality from deadly force. Compared to existing estimates, differences in benchmarked estimates are more plausibly attributable to policing differences, speaking to whether the force currently used is necessary to maintain safety and public order. I find that the deadliest PDs kill at 6.91 times the benchmarked rate of the least deadly PDs. If the PDs with above-average deadliness instead killed at average rates for a PD facing similar risks, police homicides would decrease by 34.44%. Reducing deadliness to the lowest observed levels would decrease them by 70.04%. These estimates also indicate the percentage of excess police homicides-those unnecessary for maintaining safety-if the baseline agency is assumed to be optimally deadly. Moreover, PD deadliness has a strong, robust association with White/Black segregation and Western regions. Additionally, Black, Hispanic, foreign-born, lower income, and less educated people are disproportionately exposed to deadlier PDs due to the jurisdictions they reside in. Police violence is an important public health concern that is distributed unevenly across US places, contributing to social disparities that disproportionately harm already marginalized communities.
Keywords: criminology; public health; social demography; spatial inequality.
© The Author(s) 2024. Published by Oxford University Press on behalf of National Academy of Sciences.
Figures


Similar articles
-
Surveillance for Violent Deaths - National Violent Death Reporting System, 48 States, the District of Columbia, and Puerto Rico, 2021.MMWR Surveill Summ. 2024 Jul 11;73(5):1-44. doi: 10.15585/mmwr.ss7305a1. MMWR Surveill Summ. 2024. PMID: 38980822 Free PMC article.
-
Why Police Kill Black Males with Impunity: Applying Public Health Critical Race Praxis (PHCRP) to Address the Determinants of Policing Behaviors and "Justifiable" Homicides in the USA.J Urban Health. 2016 Apr;93 Suppl 1(Suppl 1):122-40. doi: 10.1007/s11524-015-0005-x. J Urban Health. 2016. PMID: 26661386 Free PMC article.
-
Fatal police violence by race and state in the USA, 1980-2019: a network meta-regression.Lancet. 2021 Oct 2;398(10307):1239-1255. doi: 10.1016/S0140-6736(21)01609-3. Lancet. 2021. PMID: 34600625 Free PMC article.
-
Multi-group data versus dual-side theory: On race contrasts and police-caused homicides.Soc Sci Med. 2023 Jun;327:115946. doi: 10.1016/j.socscimed.2023.115946. Epub 2023 May 8. Soc Sci Med. 2023. PMID: 37182296
-
Police stops to reduce crime: A systematic review and meta-analysis.Campbell Syst Rev. 2023 Jan 10;19(1):e1302. doi: 10.1002/cl2.1302. eCollection 2023 Mar. Campbell Syst Rev. 2023. PMID: 36911857 Free PMC article. Review.
References
-
- Lartey J. 2015, May 25. By the numbers: US police kill more in days than other countries do in years. The Guardian.
LinkOut - more resources
Full Text Sources
Miscellaneous
