

The use of bubble charts in analyzing the global second-stage cesarean delivery rates: a systematic review
- PMID: 38380079
- PMCID: PMC10877423
- DOI: 10.1016/j.xagr.2024.100312
The use of bubble charts in analyzing the global second-stage cesarean delivery rates: a systematic review
Abstract
Objective: This study aimed to systematically review the worldwide second-stage cesarean delivery rate concerning pre-second-stage cesarean delivery and assisted vaginal birth rates.
Data sources: PubMed, Medline Ovid, EBSCOhost, Embase, Scopus, and Google Scholar were queried from inception to February 2023, with the following terms: "full dilatation," "second stage," and "cesarean," with their word variations. Furthermore, an additional cohort of 353,434 cases from our recently published study was included.
Study eligibility criteria: Only original studies that provided sufficient information on the number of pre-second-stage cesarean deliveries, second-stage cesarean deliveries, and vaginal births were included for the calculation of different modes of delivery. Systemic reviews, meta-analyses, or case reports were excluded.
Methods: Study identification and data extraction were independently performed by 2 authors. Selected studies were categorized on the basis of parity, study period, and geographic regions for comparison.
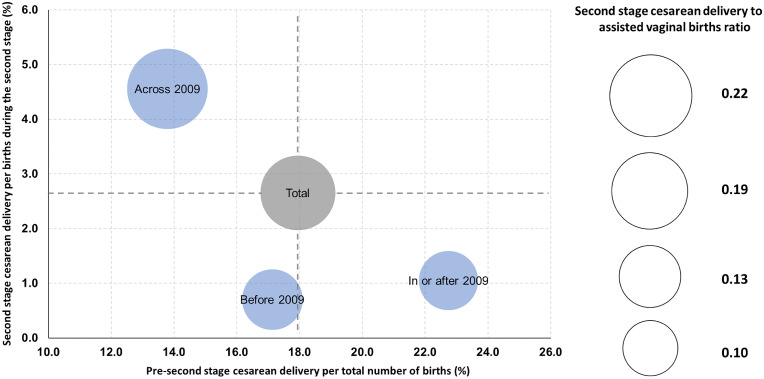
Results: A total of 25 studies were included. The overall pre-second-stage cesarean delivery rate, the second-stage cesarean delivery rate, and the second-stage cesarean delivery-to-assisted vaginal birth ratio were 17.94%, 2.65%, and 0.19, respectively. Only 5 studies described singleton, term, cephalic presenting pregnancies of nulliparous women, and their second-stage cesarean delivery rates were significantly higher than those studies with cohorts of all parity groups (4.50% vs 0.83%; P<.05). In addition, the second-stage cesarean delivery rate showed a secular increase across 2009 (0.70% vs 1.05%; P<.05). Moreover, it was the highest among African studies (5.14%) but the lowest among studies from East Asia and South Asia (0.94%). The distributions of second-stage cesarean delivery rates of individual studies and subgroups were shown with that of pre-second-stage cesarean delivery and assisted vaginal birth using the bubble chart.
Conclusion: The overall worldwide pre-second-stage cesarean delivery rate was 17.94%, the second-stage cesarean delivery rate was 2.65%, and the second-stage cesarean delivery-to-assisted vaginal birth ratio was 0.19. The African studies had the highest second-stage cesarean delivery rate (5.14%) and second-stage cesarean delivery-to-assisted vaginal birth ratio (1.88), whereas the studies from East Asia and South Asia were opposite (0.94% and 0.11, respectively).
Keywords: cesarean delivery; full dilatation; second stage.
© 2024 The Authors.
Figures


Similar articles
-
The use of bubble charts in analyzing second stage cesarean delivery rates.Am J Obstet Gynecol. 2024 Oct;231(4):465.e1-465.e10. doi: 10.1016/j.ajog.2024.02.283. Epub 2024 Feb 24. Am J Obstet Gynecol. 2024. PMID: 38408623
-
Severe maternal and neonatal morbidity after attempted operative vaginal delivery.Am J Obstet Gynecol MFM. 2021 May;3(3):100339. doi: 10.1016/j.ajogmf.2021.100339. Epub 2021 Feb 23. Am J Obstet Gynecol MFM. 2021. PMID: 33631384
-
Risk of spontaneous preterm birth elevated after first cesarean delivery at full dilatation: a retrospective cohort study of over 30,000 women.Am J Obstet Gynecol. 2024 Mar;230(3):358.e1-358.e13. doi: 10.1016/j.ajog.2023.08.013. Epub 2023 Aug 18. Am J Obstet Gynecol. 2024. PMID: 37598995
-
Vaginal Delivery After External Cephalic Version in Patients With a Previous Cesarean Delivery: A Systematic Review and Meta-analysis.Obstet Gynecol. 2020 Nov;136(5):965-971. doi: 10.1097/AOG.0000000000004065. Obstet Gynecol. 2020. PMID: 33030882
-
Clinical interventions that influence vaginal birth after cesarean delivery rates: Systematic Review & Meta-Analysis.BMC Pregnancy Childbirth. 2019 Dec 30;19(1):529. doi: 10.1186/s12884-019-2689-5. BMC Pregnancy Childbirth. 2019. PMID: 31888540 Free PMC article.
Cited by
-
Improving capacity for advanced training in obstetric surgery: evaluation of a blended learning approach.BMC Med Educ. 2025 Jan 17;25(1):80. doi: 10.1186/s12909-025-06660-7. BMC Med Educ. 2025. PMID: 39819576 Free PMC article.
References
-
- Loudon JA, Groom KM, Hinkson L, Harrington D, Paterson-Brown S. Changing trends in operative delivery performed at full dilatation over a 10-year period. J Obstet Gynaecol. 2010;30:370–375. - PubMed
-
- Unterscheider J, McMenamin M, Cullinane F. Rising rates of caesarean deliveries at full cervical dilatation: a concerning trend. Eur J Obstet Gynecol Reprod Biol. 2011;157:141–144. - PubMed
-
- Corry EMA, Ramphul M, Rowan AM, Segurado R, Mahony RM, Keane DP. Exploring full cervical dilatation caesarean sections-a retrospective cohort study. Eur J Obstet Gynecol Reprod Biol. 2018;224:188–191. - PubMed
-
- Bartholomew A, Corbett E, Kaikai E, et al. Ten years of maternity claims: an analysis of NHS Litigation Authority data. NHS Litigation Authority. 2012. Available at: https://resolution.nhs.uk/resources/ten-years-of-maternity-claims-an-ana.... Assessed June 8, 2023.
Publication types
LinkOut - more resources
Full Text Sources
