. 2024 Apr;11(16):e2303379.
doi: 10.1002/advs.202303379. Epub 2024 Feb 21.

Chromatin Remodeling in Patient-Derived Colorectal Cancer Models

Affiliations

Chromatin Remodeling in Patient-Derived Colorectal Cancer Models

Kun Xiang et al. Adv Sci (Weinh). 2024 Apr.

Abstract

Patient-Derived Organoids (PDO) and Xenografts (PDX) are the current gold standards for patient-derived models of cancer (PDMC). Nevertheless, how patient tumor cells evolve in these models and the impact on drug response remains unclear. Herein, the transcriptomic and chromatin accessibility landscapes of matched colorectal cancer (CRC) PDO, PDX, PDO-derived PDX (PDOX), and original patient tumors (PT) are compared. Two major remodeling axes are discovered. The first axis delineates PDMC from PT, and the second axis distinguishes PDX and PDO. PDOX are more similar to PDX than PDO, indicating the growth environment is a driving force for chromatin adaptation. Transcription factors (TF) that differentially bind to open chromatins between matched PDO and PDOX are identified. Among them, KLF14 and EGR2 footprints are enriched in PDOX relative to matched PDO, and silencing of KLF14 or EGR2 promoted tumor growth. Furthermore, EPHA4, a shared downstream target gene of KLF14 and EGR2, altered tumor sensitivity to MEK inhibitor treatment. Altogether, patient-derived CRC cells undergo both common and distinct chromatin remodeling in PDO and PDX/PDOX, driven largely by their respective microenvironments, which results in differences in growth and drug sensitivity and needs to be taken into consideration when interpreting their ability to predict clinical outcome.

Keywords: ATAC‐seq, Colorectal Cancer (CRC); Patient‐Derived Models of Cancer (PDMC); Patient‐Derived Organoids (PDO); Patient‐Derived Xenografts (PDX).


Conflict of interest statement

H.C.’s full disclosure is given at https://www.uu.nl/staff/JCClevers/. H.C. is inventer of several patents related to organoid technology, cofounder of Xilis Inc. and currently an employee of Roche, Basel. X.S. and D.H. are cofounders of Xilis Inc.

Figures

Figure 1
Figure 1
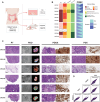
The establishment of matched PT‐PDMC sets. A) The overall scheme of the CRC specimens and PDMC processing. The same surgically removed tumor specimens were used to derive both PDO and PDX. PDO were subcutaneously injected into mice to obtain PDOX. All available models, including the original patient tumors, were processed for ATAC‐seq and mRNA‐seq. B) The summary of model establishment and clinical data for all patients. The bottom five patients were for the additional PDO‐PDOX validation sets. C) Histology of PT and PDMC, showing the sets of CRC187, CRC192, CRC245, CRC106, CRC403, and CRC404. PT panel: H&E‐staining of PT at 10X magnification showing the tumor region. Scale bars, 300 µm; PDO panel: The bright‐field images (left) of PDO. Scale bars, 25 µm. The confocal images (right) of PDO immunolabeled for CDX2 (green), CK20 (red), and DAPI (blue); PDX panel and PDOX panel: H&E‐staining (left) and protein immunostaining for CDX2 (right) of PDX/PDOX. Scale bars, 300 µm. D) Pairwise ATAC‐seq correlation between patient samples and models based on normalized read counts of detected peaks. The Pearson correlation coefficient is presented for each comparison.
Figure 2
Figure 2
ATAC‐seq analysis suggests a two‐axes remodeling in CRC cells of PDMC. A) Heatmap of unbiased hierarchical clustering of PT and PDMC based on 1000 chromatin accessible regions with the highest variance. Patient tumor and PDMC are separated. All replicates are clustered with each other, and the samples from the same patient set are indicated/labeled with a unique color. B) Principal component analysis of individual PT‐PDMC sets (CRC187, CRC192, and CRC245) from ATAC‐seq data based on the DiffBind score. Patient samples are circled in red, PDO in blue, PDX in green, and PDOX in light green. Each type of model has three replicates. C) The illustration of the two‐axes remodeling. D) Principal component analysis of the pooled PT‐PDO‐PDOX sets from ATAC‐seq data based on the DiffBind score. Patient samples are magenta, PDO are blue, and PDOX are green. Different shapes of dots denote patient IDs. E) Differential analysis of ATAC‐seq peaks in the comparisons of PDMC versus PT, PDOX versus PDO, and PDOX versus PDX based on the consensus peak set derived from each condition. Differentially enriched (DE) peaks are labeled in red, |log2(FC)|>1 and p < 0.05. Pie charts show the percentages of enriched or unchanged (U.C.) peaks. F) The number of differentially enriched peaks in different model comparisons. The number of peaks enriched in the first or second term of the comparison is denoted (Table S4, Supporting Information). The remodeling axis #1 includes PDMC versus PT. The remodeling axis #2 includes PDOX versus PDX, PDOX versus PDO, and PDO versus PDX. G) ATAC‐seq signal track showing LGR5 locus in different models. The exon locations are indicated in the gene map. H) Heatmap of all ATAC differentially enriched peaks gained or lost between patient samples, PDO, PDOX, and PDX based on the consensus peak set. Each column represents a replicate of ATAC sequencing of PT or models. I) The number of ATAC‐seq peaks that are significantly gained (top) or lost (bottom) in PDMC versus PT samples, shared, or unique to models. J) Anchored single cell multiome analysis for PDMC and PT, with visualizations of CRC and non‐malignant components.
Figure 3
Figure 3
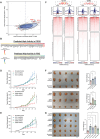
Transcription factor activities are affected by PDO→PDOX remodeling. A) BaGFoot analysis of PDOX versus PDO based on consensus peak set derived from each condition. The TFs predicted to be active in PDOX are in the first quadrant beyond the fence area with an extending factor of 1.5. The model‐specific TFs (also predicted to be active in PDOX in the comparison of PDOX versus PT, Table S5, Supporting Information), as well as EGR2 and KLF14, are highlighted. The TFs in the third quadrant beyond the fence area are predicted to be active in PDO. The model‐specific TFs (also predicted active in PDO in the comparison of PDO versus PT, Table S5, Supporting Information) are highlighted. B) The occurrence counts of high‐activity TFs in PDOX versus PDO from BaGFoot analysis for individual patient sets. C) TOBIAS footprint analysis of KLF14 (motif: KLF14_HUMAN.H11MO.0.D) and EGR2 (motif: EGR2_HUMAN.H11MO.1.A). The aggregated signals are summarized at the top; blue lines are from bound sites, and red lines are from unbound sites. The footprint heatmaps indicate the chromatin accessibility in the bound and unbound sites of KLF14 and EGR2 in PDO and PDOX. D,E): Tumor growth curves of PDOX106 (D) and PDOX187 (E) for KLF14 and EGR2 shRNA KD or the scrambled control. Error bars denote SEM of five replicates. p values were calculated based on repeat measurement one‐way ANOVA with Fisher's LSD test. *p < 0.05, **p < 0.01. F,G): Photos of xenograft tumors (left) and tumor weight comparisons (right) of PDOX106 (F) and PDOX187 (G) for KLF14 and EGR2 KD and the scramble control. The ruler of the tumor photo has 1‐cm intervals. Error bars in the tumor weight plots denote SEM of five replicates (mouse replicates are shown as scatter dots). p values were calculated based on ANOVA with post‐hoc. *p < 0.05, **p < 0.01, ***p < 0.001.
Figure 4
Figure 4
Downstream gene EPHA4 affects drug sensitivities. A) The illustration shows the epigenetic reprogramming of CRC cells from PDO in vitro to PDOX in vivo, in which the enhanced binding activities of TFs (KLF14 and EGR2) would lead to the higher expression of the downstream genes (EPHA4). B) ATAC‐seq signal track showing EPHA4 locus in PDO and PDOX. The exon locations are indicated in the gene map. The promoter areas of EPHA4 are circled and presented in the bottom panel. C) The boxplot reports cumulative ATAC‐seq signals in the EPHA4 region in paired sets of PDOX versus PDO. p values were calculated based on paired Student's t‐test. ***p < 0.001. D) The boxplot reports the EPHA4 expression levels based on mRNA‐seq in paired PDOX versus PDO. p values were calculated based on paired Student's t‐test. *p < 0.05. E) Peak–gene links for EPHA4 based on PDO and PDOX187 single cell multiome data showing the correlations between DNA accessibilities and EPHA4 expression. F) PDO106 growth rate dose‐response curves to Fluorouracil and Mirdametinib after knocking down EPHA4. Error bars denote SEM of four replicates. G) Heatmap of drug screen on PDO106 (control PDO, EPHA4 shRNA PDO, and EPHA4 overexpression [OE] PDO) showing the average relative luminescence (%) of three replicates for each compound and condition.

References

    1. van de Wetering M., Francies H. E., Francis J. M., Bounova G., Iorio F., Pronk A., van Houdt W., van Gorp J., Taylor‐Weiner A., Kester L., McLaren‐Douglas A., Blokker J., Jaksani S., Bartfeld S., Volckman R., van Sluis P., Li V. S. W., Seepo S., Sekhar Pedamallu C., Cibulskis K., Carter S. L., McKenna A., Lawrence M. S., Lichtenstein L., Stewart C., Koster J., Versteeg R., van Oudenaarden A., Saez‐Rodriguez J., Vries R. G. J., et al., Cell 2015, 161, 933. - PMC - PubMed
    1. Fichtner I., Slisow W., Gill J., Becker M., Elbe B., Hillebrand T., Bibby M., Eur. J. Cancer 2004, 40, 298. - PubMed
    1. Drost J., Clevers H., Nat. Rev. Cancer 2018, 18, 407. - PubMed
    1. Tentler J. J., Tan A. C., Weekes C. D., Jimeno A., Leong S., Pitts T. M., Arcaroli J. J., Messersmith W. A., Eckhardt S. G., Nat. Rev. Clin. Oncol. 2012, 9, 338. - PMC - PubMed
    1. Bleijs M., van de Wetering M., Clevers H., Drost J., EMBO J. 2019, 38, 101654. - PMC - PubMed

Publication types