

Predictive utility of the P3 event-related potential (ERP) response to alcohol cues for ecologically assessed alcohol craving and use
- PMID: 38380714
- PMCID: PMC10882185
- DOI: 10.1111/adb.13368
Predictive utility of the P3 event-related potential (ERP) response to alcohol cues for ecologically assessed alcohol craving and use
Abstract
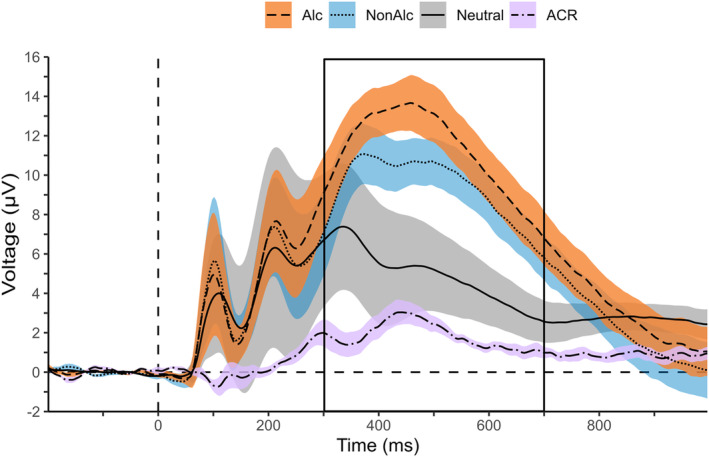
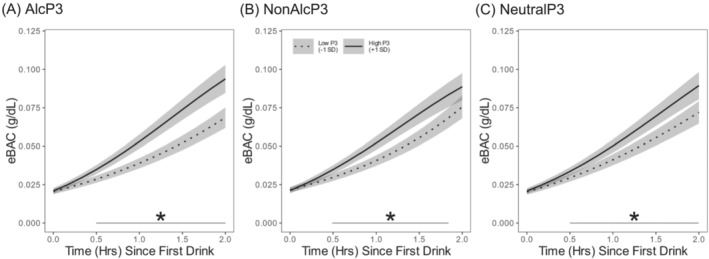
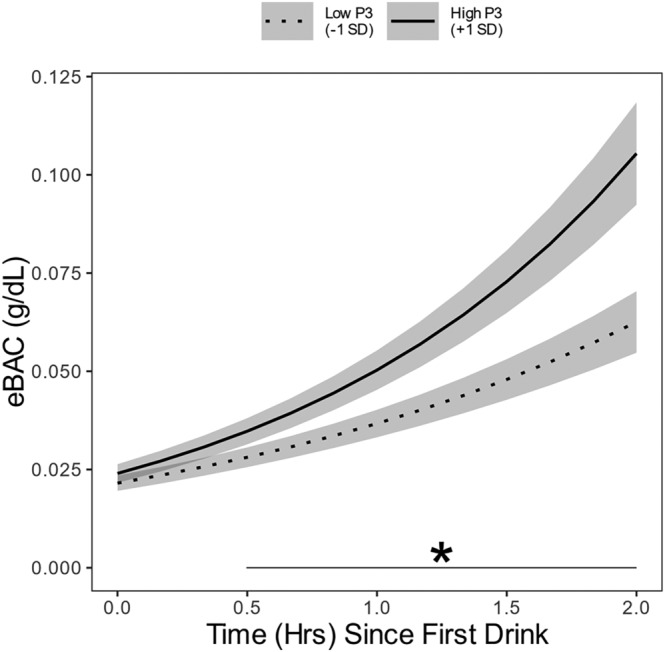
Neural measures of alcohol cue incentive salience have been associated with retrospective reports of riskier alcohol use behaviour and subjective response profiles. This study tested whether the P3 event-related potential (ERP) elicited by alcohol-related cues (ACR-P3) can forecast alcohol use and craving during real-world drinking episodes. Participants (N = 262; Mage = 19.53; 56% female) completed a laboratory task in which they viewed images of everyday objects (Neutral), non-alcohol drinks (NonAlc) and alcohol beverages (Alc) while EEG was recorded and then completed a 21-day ecological momentary assessment (EMA) protocol in which they recorded alcohol craving and consumption. Anthropometrics were used to derive estimated blood alcohol concentration (eBAC) throughout drinking episodes. Multilevel modelling indicated positive associations between P3 amplitudes elicited by all stimuli and within-episode alcohol use measures (e.g., eBAC, cumulative drinks). Focal follow-up analyses indicated a positive association between AlcP3 amplitude and eBAC within episodes: Larger AlcP3 was associated with a steeper rise in eBAC. This association was robust to controlling for the association between NonAlcP3 and eBAC. AlcP3 also was positively associated with episode-level measures (e.g., max drinks, max eBAC). There were no associations between any P3 variables and EMA-based craving measures. Thus, individual differences in neural measures of alcohol cue incentive salience appear to predict the speed and intensity of alcohol consumption but not reports of craving during real-world alcohol use episodes.
Keywords: LPP; P300; alcohol craving; alcohol use; biomarkers; ecological momentary assessment.
© 2024 The Authors. Addiction Biology published by John Wiley & Sons Ltd on behalf of Society for the Study of Addiction.
Conflict of interest statement
All authors declare no conflict of interest with regard to this research.
Figures
Similar articles
-
P3 event-related potential reactivity to smoking cues: Relations with craving, tobacco dependence, and alcohol sensitivity in young adult smokers.Psychol Addict Behav. 2017 Feb;31(1):61-72. doi: 10.1037/adb0000233. Epub 2016 Nov 17. Psychol Addict Behav. 2017. PMID: 27854454 Free PMC article.
-
Interactive Effects of Naturalistic Drinking Context and Alcohol Sensitivity on Neural Alcohol Cue-Reactivity Responses.Alcohol Clin Exp Res. 2019 Aug;43(8):1777-1789. doi: 10.1111/acer.14134. Epub 2019 Jul 18. Alcohol Clin Exp Res. 2019. PMID: 31233217 Free PMC article.
-
Internal consistency and test-retest reliability of the P3 event-related potential (ERP) elicited by alcoholic and non-alcoholic beverage pictures.Psychophysiology. 2022 Feb;59(2):e13967. doi: 10.1111/psyp.13967. Epub 2021 Nov 15. Psychophysiology. 2022. PMID: 34783024 Free PMC article.
-
Alcohol craving in the natural environment: Moderating roles of cue exposure, drinking, and alcohol sensitivity.Exp Clin Psychopharmacol. 2023 Feb;31(1):57-71. doi: 10.1037/pha0000540. Epub 2022 Jan 13. Exp Clin Psychopharmacol. 2023. PMID: 35025586 Free PMC article.
-
Associations of the P300 Event-Related Potentials and Self-Reported Craving in Substance Use Disorders: A Systematic Review.Eur Addict Res. 2023;29(6):406-416. doi: 10.1159/000533147. Epub 2023 Oct 11. Eur Addict Res. 2023. PMID: 37820586
Cited by
-
The impact of anti-craving medication on cue reactivity and abstinence in patients undergoing alcohol detoxification: some preliminary evidence from a retrospective event-related potentials study.Psychopharmacology (Berl). 2025 Jul 19. doi: 10.1007/s00213-025-06855-2. Online ahead of print. Psychopharmacology (Berl). 2025. PMID: 40681661
-
Inhibitory control in the sober state as a function of alcohol sensitivity: a pilot functional magnetic resonance imaging (fMRI) study.Front Hum Neurosci. 2025 Feb 28;19:1557661. doi: 10.3389/fnhum.2025.1557661. eCollection 2025. Front Hum Neurosci. 2025. PMID: 40092652 Free PMC article.
-
Neurobiological Mechanisms of Action of Transcranial Direct Current Stimulation (tDCS) in the Treatment of Substance Use Disorders (SUDs)-A Review.J Clin Med. 2025 Jul 10;14(14):4899. doi: 10.3390/jcm14144899. J Clin Med. 2025. PMID: 40725591 Free PMC article. Review.
References
-
- Robinson TE, Berridge KC. The neural basis of drug craving: an incentive‐sensitization theory of addiction. Brain Res Rev. 1993;8:247‐291. - PubMed
Publication types
MeSH terms
Substances
Grants and funding
LinkOut - more resources
Full Text Sources
Research Materials
Miscellaneous
