. 2024 Mar 13;15(3):e0318523.
doi: 10.1128/mbio.03185-23. Epub 2024 Feb 21.

Regional centromere configuration in the fungal pathogens of the Pneumocystis genus

Affiliations

Regional centromere configuration in the fungal pathogens of the Pneumocystis genus

Ousmane H Cissé et al. mBio. .

Abstract

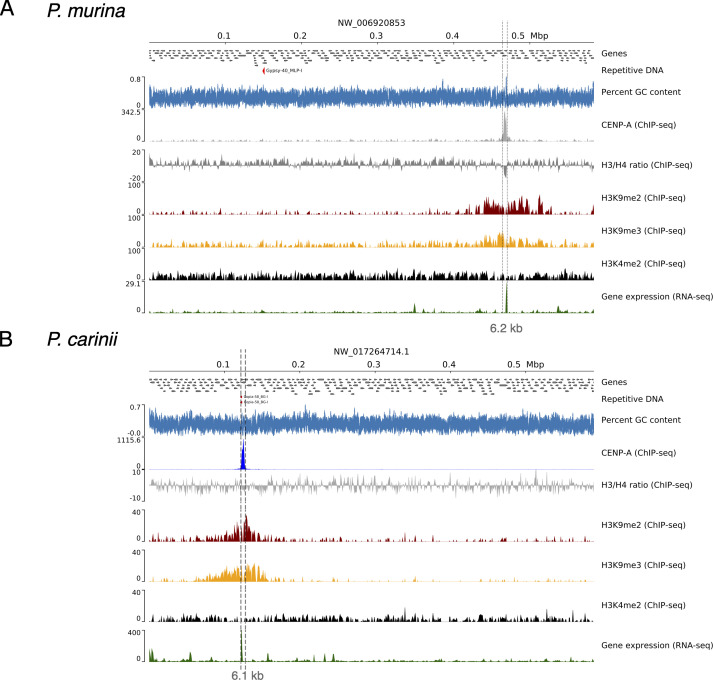
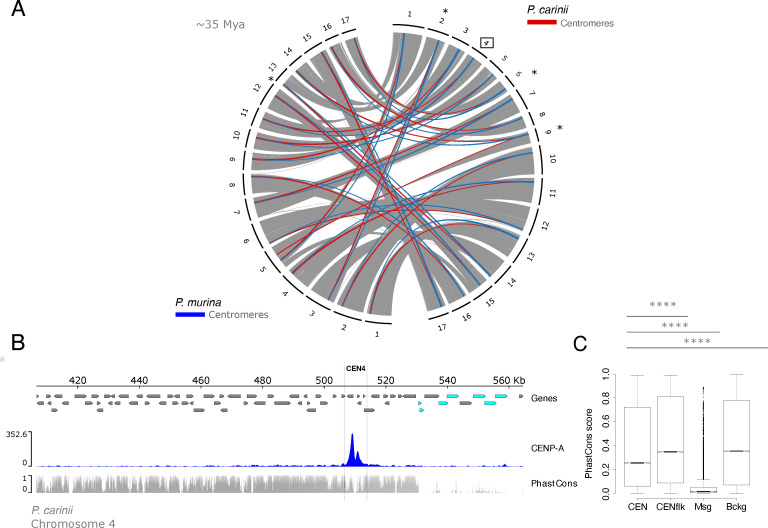
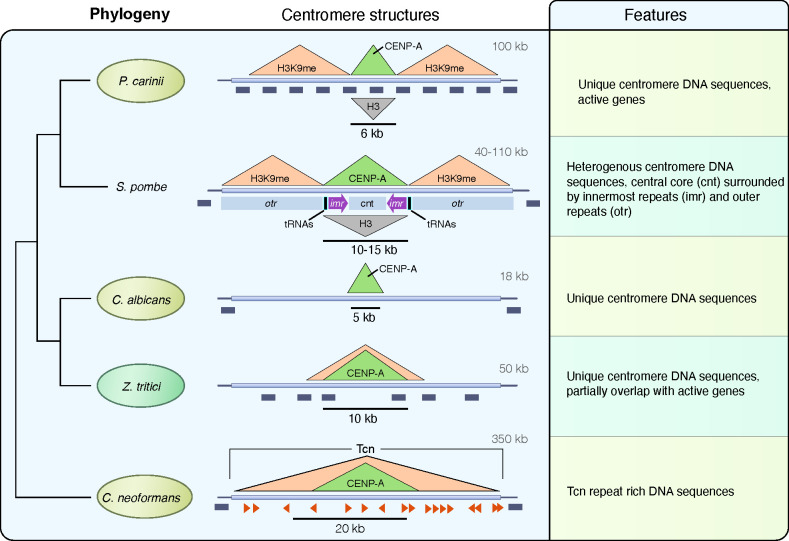
Centromeres are constricted chromosomal regions that are essential for cell division. In eukaryotes, centromeres display a remarkable architectural and genetic diversity. The basis of centromere-accelerated evolution remains elusive. Here, we focused on Pneumocystis species, a group of mammalian-specific fungal pathogens that form a sister taxon with that of the Schizosaccharomyces pombe, an important genetic model for centromere biology research. Methods allowing reliable continuous culture of Pneumocystis species do not currently exist, precluding genetic manipulation. CENP-A, a variant of histone H3, is the epigenetic marker that defines centromeres in most eukaryotes. Using heterologous complementation, we show that the Pneumocystis CENP-A ortholog is functionally equivalent to CENP-ACnp1 of S. pombe. Using organisms from a short-term in vitro culture or infected animal models and chromatin immunoprecipitation (ChIP)-Seq, we identified CENP-A bound regions in two Pneumocystis species that diverged ~35 million years ago. Each species has a unique short regional centromere (<10 kb) flanked by heterochromatin in 16-17 monocentric chromosomes. They span active genes and lack conserved DNA sequence motifs and repeats. These features suggest an epigenetic specification of centromere function. Analysis of centromeric DNA across multiple Pneumocystis species suggests a vertical transmission at least 100 million years ago. The common ancestry of Pneumocystis and S. pombe centromeres is untraceable at the DNA level, but the overall architectural similarity could be the result of functional constraint for successful chromosomal segregation.IMPORTANCEPneumocystis species offer a suitable genetic system to study centromere evolution in pathogens because of their phylogenetic proximity with the non-pathogenic yeast S. pombe, a popular model for cell biology. We used this system to explore how centromeres have evolved after the divergence of the two clades ~ 460 million years ago. To address this question, we established a protocol combining short-term culture and ChIP-Seq to characterize centromeres in multiple Pneumocystis species. We show that Pneumocystis have short epigenetic centromeres that function differently from those in S. pombe.

Keywords: chromosome segregation; evolution; genetics; genome organization; opportunistic fungi.


Conflict of interest statement

The authors declare no conflict of interest.

Figures

Fig 1
Fig 1
Nuclear peripheral localization of CENP-A in Pneumocystis cells. (A) pnCENP-A (red) localizes at the nuclear periphery (blue) inside Pneumocystis carinii organisms (green). A cluster of organisms from an infected rat lung tissue section is presented and labeled with an anti-CENP-A antibody (red), an anti-Pneumocystis carinii antibody 7C4 (green), and 4′,6-diamidino-2-phenylindole (DAPI, blue). The image is a maximum projection of a 5-µm thick z-stack. Bottom panels 1–8 are magnified fields. Most anti-pnCENP-A labels overlap or are close in proximity with DAPI (represented by a pink color produced by the overlap between red and blue colors). Some organisms are not labeled by 7C4 antibody (e.g., box 5), which suggests that the epitope is not expressed. This field does not contain any host cells (rat). Scale bar =  2 µm. (B) In plane and orthogonal views of immunofluorescence labeling of P. carinii organisms co-cultured with mammalian cells for 7 days. Organisms were triple labeled using an anti-CENP-A antibody (red), a different anti-Pneumocystis antibody (RAE7) targeting Pneumocystis major surface glycoproteins (green), and DAPI (blue). Panels 1–3 are magnified fields. CENP-A is located inside Pneumocystis cells at the periphery of the nucleus. Few organisms are only labeled with the DAPI and do not express detectable levels of CENP-A and major surface glycoprotein. A rat cell nucleus is labeled with the letter “H.” Scale bar =  1 µm.
Fig 2
Fig 2
Pneumocystis CENP-A supports viability and centromere loading in a heterologous system. (A) Protein sequence alignment of full-length CENP-Acnp-1 orthologs in Schizosaccharomyces pombe, Pneumocystis murina, and P. carinii. Each Pneumocystis species only infects a single mammalian host: P. murina (infecting mice) and P. carinii (rats). The ~25 amino acid insert in Pneumocystis CENP-A N-terminal regions is unique to this genus. (B) Schematic of the plasmid-shuffling assay used in C. The inviability of cnp1∆ cells is masked by the presence of cnp1+ on a ura4+-marked plasmid. After introducing the LEU2-marked rescue plasmid, cells that have lost the ura4+-marked plasmid are selected on medium containing FOA, leaving only those with the rescue plasmid. Note: S. cerevisiae LEU2 gene complements the S. pombe leu1-32 mutant. (C) Rescue experiments using the plasmid-shuffling assay described in B to test the ability of multicopy plasmids expressing GFP-tagged CENP-A transgenes to rescue cnp1∆ cells. Growth was assayed at indicated media using 10-fold serial dilutions. (D) Rescue experiment of fission yeast cnp1-76 thermosensitive cells using same plasmids as in C. Growth was assayed at indicated temperatures using 10-fold serial dilutions. The transgene encoding S. pombe CENP-A serves as a non-temperature-sensitive control. (E) Representative images of cen2-tetO-TdTomato strains expressing the indicated GFP-tagged CENP-A transgenes in multicopy plasmids. GFP and TdTomato fluorescence as well as brightfield images are merged. Magnified views of boxed regions are shown at the bottom. (F) Integrated fluorescence intensity of GFP foci was measured and plotted for the strains used in panel E. The median (bar) and interquartile range (error bars) are shown. n > 409. A.U., arbitrary units. (G) Anti-GFP ChIP-qPCR analysis of indicated loci for strains expressing GFP-tagged CENP-A transgenes as single-copy integrations. %IP represents the percentage of input that was immunoprecipitated. Error bars denote the SD (n = 3). For each strain, comparison of %IP between loci was performed by one-way ANOVA and Holm-Sidak test for multiple comparisons (P < 0.001). Mean values marked with letters (a or b) indicate results that are significantly different from each other. cc1&3, S. pombe centromere central core 1 & 3; cc2:ura4+, ura4+ insertion at central core 2; dg, a class of heterochromatic outer repeats within pericentromeric regions (control); fbp1, euchromatic locus (control).
Fig 3
Fig 3
Pneumocystis CENP-A binds to single genomic foci in replicating cells. (A) Study workflow and sample preparation. P. murina and P. carinii were obtained from CD40 ligand knockout female mice and immunosuppressed Sprague-Dawley male rats, respectively, and cultured on a co-culture of human lung adenocarcinoma cells (A549) and immortalized murine lung epithelial type 1 cells (Let-1) for 14 days. Species phylogeny and estimated speciation timing are presented. Animal icons were obtained from http://phylopic.org under creative commons licenses https://creativecommons.org/licenses/by/3.0/: mouse (Anthony Caravaggi; license CC BY-NC-SA 3.0) and rat (by Rebecca Groom; license CC BY-NC-SA 3.0). (B) P. murina population growth in duplicate wells were measured by quantitative PCR targeting a single-copy dihydrofolate reductase (dhfr) gene over 14 days. Error bars represent the standard deviation (n = 2). (C) P. carinii growth measurement by qPCR targeting dhfr gene. Error bars represent the standard deviation (n = 2). (D) Electron micrograph showing a possibly dividing P. murina trophic form 7 days post culture (black arrow). The field also includes a non-dividing trophozoite (white arrow). Scale bar, 2 µm.
Fig 4
Fig 4
Pneumocystis displays 17 centromeres. (A) Scaled ideogram of 17 chromosomal-level scaffolds (gray) of P. murina genome showing CENP-A binding regions (constricted areas). (B) CENP-A binding regions delineate putative CENs in P. murina genome. Color-coded peaks represent enrichment of immunoprecipitated DNA (IP DNA) relative to controls (Input DNA) in P. murina organisms (input subtracted). Only ChIP-Seq data from Pneumocystis cocultured with A549 and Let-1 cells for 7 days are presented. Data for the full experiment covering days 0, 7, and 14 are presented in Supplementary material. The 20-kb windows of the enrichment peak are presented. Each scaffold displays two peaks labeled M (Major) and m (minor) according to the enrichment level. (C) Scaled ideogram of 17 chromosomal-level scaffolds (gray) of P. carinii genome showing CENP-A binding regions (constricted areas). (D) CENP-A binding regions delineate putative CENs in P. carinii genome. Color-coded peaks represent enrichment of IP DNA relative to controls (Input DNA) in P. carinii organisms cocultured with A549 and Let-1 cells for 7 days (input subtracted). Data for the full experiment covering days 0, 7, and 14 are presented in Fig. S6 and supplemental data at https://doi.org/10.5281/zenodo.10574230. (E) A DNA dot plot of CENP-A binding regions in P. murina showing regional self-similarity. The main diagonal represents the sequence alignment with itself. Lines off the main diagonal which are repetitive patterns within the sequences are not observed. The plot shows that each CEN is unique within the genome. (F) DNA dot plot of CENP-A binding regions in P. carinii showing that each CEN is unique and repeat free.
Fig 5
Fig 5
Centromeres are flanked by heterochromatin and contain active genes. (A) Genomic view of chromosome 2 of P. murina genome subsequently showing annotated genes (directed gray boxes), DNA repeats (not present), percent GC content (blue), ChIP-Seq read coverage distribution [bins per million mapped reads (BPM) normalized over bins of 50 bp; input subtracted] of CENP-A, histone H3 and H4 ratio, heterochromatin-associated modifications (H3K9me2 and H3K9me3), and euchromatin (H3K4me2) and gene expression (RNA-seq) in relation with centromeres. (B) Genomic view of chromosome 2 of P. carinii genome with the same features presented as P. murina. A duplicated copy of copia-retrotransposon is presented (red arrows), which is present in syntenic regions in other Pneumocystis genomes. The two presented chromosomes are syntenic.
Fig 6
Fig 6
Centromere locations, not sequences, are evolutionarily constrained by positive selection. (A) Genome organization and synteny in Pneumocystis. Circos plots depicting pairwise P. carinii and P. murina genome synteny. Rodent-infecting Pneumocystis (P. carinii and P. murina) have 17 chromosomes. Colored connectors indicate regions of synteny between species. Centromeres that overlap with recent chromosomal breakpoints are indicated (*). The square highlights P. carinii centromere 4 displayed in panel B. (B) Genome view of centromere 4 in the P. carinii genome. Genes are represented by directed boxes (gray for protein-coding genes and cyan for polymorphic major surface glycoprotein genes), pnCENP-A binding region (centromere), and sequence conservation scores which were calculated from whole genome alignments of P. carinii, P. murina, and P. wakefieldiae (PhasCons). The phastCons scores represent probabilities of negative selection and range between 0 (no conservation) and 1 (total conservation). (C) Boxplot of conservation scores per genomic context summarized for centromere 4 in P. carinii genome, 30-kb regions flanking the centromeres (Cenflk), major surface glycoproteins encoding regions (Msg), and random genomic background (Bckg). Msgs are fast-evolving proteins potentially involved in antigenic variation. Background data were obtained from randomly selected intervals (n = 1 × 10⁶) from genomic regions excluding above-mentioned regions (CEN, Cenflk, and Msg). Statistical differences for the indicated comparisons were obtained using one-sided non-parametric Mann-Whitney test; ****P < 0.0001, ***P < 0.001, **P < 0.01, *P < 0.05. Data for all 17 centromeres are presented in Supplementary material.
Fig 7
Fig 7
Model of regional centromere structures in Pneumocystis and other representative fungi. On the left is the phylogeny of selected fungi inferred from maximum likelihood phylogenetic analysis of shared core protein orthologs. The overall centromere structures for Pneumocystis carinii (details supporting our model are provided in the text), Schizosaccharomyces pombe (46), Candida albicans (7), Zymoseptoria tritici (44), and Cryptococcus neoformans (9) are used as representative to showcase the diversity of regional centromeres in fungi. Animal pathogens are highlighted in pale-olive, and the plant fungal pathogen Zymoseptoria tritici is in pale-green. For the sake of brevity, only Pneumocystis carinii is presented. In the middle are presented DNA structures of centromeres. P. carinii has 17 centromeres (one for each of its 17 chromosomes) that share the same overall architecture. Centromeres are delineated by a localized enrichment of the centromeric histone CENP-A, which overlaps with a reduction of the canonical histone H3 (inverted grey triangle). Centromeres are flanked by heterochromatin H3K9me (here stands for both H3K9me2 and H3K9me3). All 17 Pneumocystis carinii centromeres span active genes (dark-gray boxes). Each centromere sequence is different and lacks shared DNA sequence motif. S. pombe has three centromeres that share the same overall structure in which a central core (cnt) domain is surrounded by innermost repeats (imr) and outer repeats (otr). The imr repeats incorporate clusters of transfer RNAs (tRNAs) that play a role in restricting CENP-A spread. S. pombe centromeres are flanked by heterochromatin (H3K9me). Genes are found 0.75–1.5 kb beyond the limits of the centromeres. C. albicans has eight unique and different centromeres that are gene free and lack shared sequence motifs. Z. tritici has 21 centromeres ranging from 6 to 14 kb in size that partially overlap with genes. C. neoformans has 14 centromeres that are gene free and enriched with Tcn transposons.

Update of

Similar articles

Cited by

References

    1. Gordon JL, Byrne KP, Wolfe KH. 2011. Mechanisms of chromosome number evolution in yeast. PLoS Genet 7:e1002190. doi:10.1371/journal.pgen.1002190 - DOI - PMC - PubMed
    1. Sankaranarayanan SR, Ianiri G, Coelho MA, Reza MH, Thimmappa BC, Ganguly P, Vadnala RN, Sun S, Siddharthan R, Tellgren-Roth C, Dawson TL, Heitman J, Sanyal K. 2020. Loss of centromere function drives karyotype evolution in closely related Malassezia species. Elife 9:e53944. doi:10.7554/eLife.53944 - DOI - PMC - PubMed
    1. Selmecki A, Forche A, Berman J. 2006. Aneuploidy and isochromosome formation in drug-resistant Candida albicans. Science 313:367–370. doi:10.1126/science.1128242 - DOI - PMC - PubMed
    1. McKinley KL, Cheeseman IM. 2016. The molecular basis for centromere identity and function. Nat Rev Mol Cell Biol 17:16–29. doi:10.1038/nrm.2015.5 - DOI - PMC - PubMed
    1. Clarke L, Carbon J. 1980. Isolation of a yeast centromere and construction of functional small circular chromosomes. Nature 287:504–509. doi:10.1038/287504a0 - DOI - PubMed

MeSH terms