. 2024 Apr;11(16):e2308009.
doi: 10.1002/advs.202308009. Epub 2024 Feb 21.

RECQL4 Inhibits Radiation-Induced Tumor Immune Awakening via Suppressing the cGAS-STING Pathway in Hepatocellular Carcinoma

Affiliations

RECQL4 Inhibits Radiation-Induced Tumor Immune Awakening via Suppressing the cGAS-STING Pathway in Hepatocellular Carcinoma

Weifeng Hong et al. Adv Sci (Weinh). 2024 Apr.

Abstract

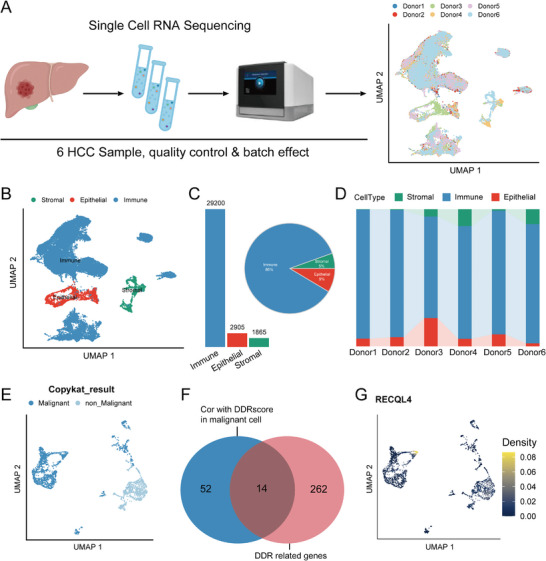
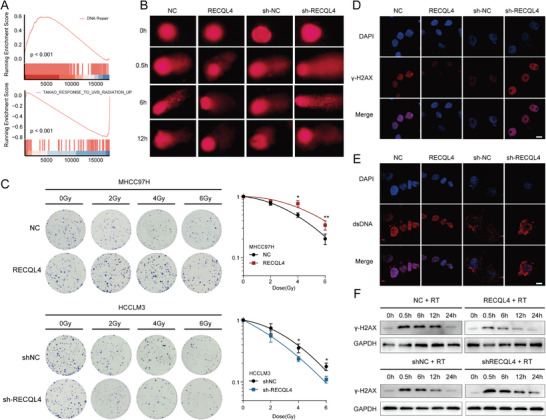
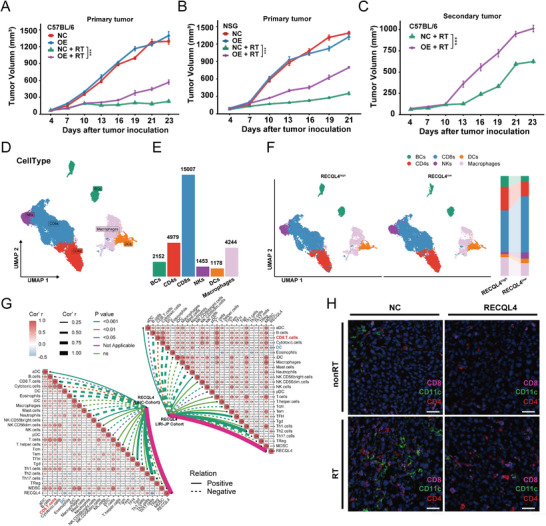
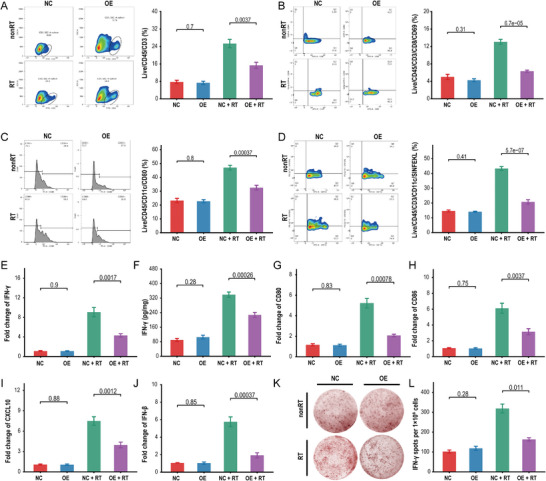
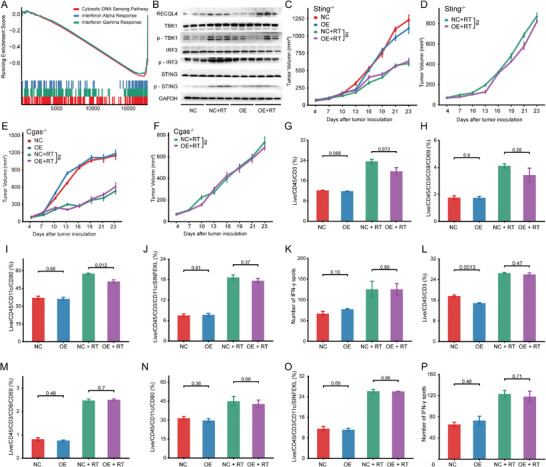
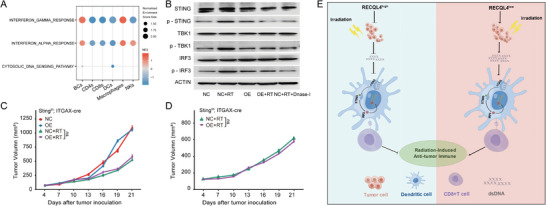
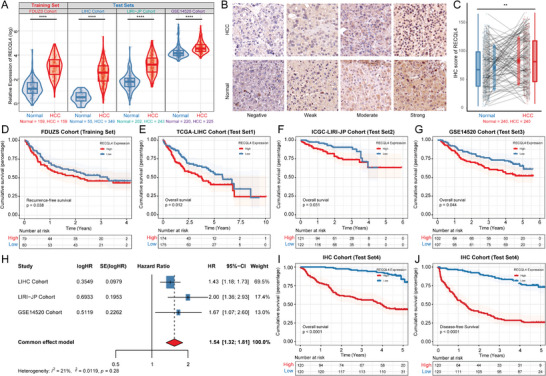
Many patients with hepatocellular carcinoma (HCC) respond poorly to radiotherapy despite remarkable advances in treatment. A deeper insight into the mechanism of sensitivity of HCC to this therapy is urgently required. It is demonstrated that RECQL4 is upregulated in the malignant cells of patients with HCC. Elevated RECQL4 levels reduce the sensitivity of HCC to radiotherapy by repairing radiation-induced double-stranded DNA (dsDNA) fragments. Mechanistically, the inhibitory effect of RECQL4 on radiotherapy is due to the reduced recruitment of dendritic cells and CD8+ T cells in the tumor microenvironment (TME). RECQL4 disrupts the radiation-induced transformation of the TME into a tumoricidal niche by inhibiting the cGAS-STING pathway in dendritic cells. Knocking out STING in dendritic cells can block the impact of RECQL4 on HCC radiosensitivity. Notably, high RECQL4 expressions in HCC is significantly associated with poor prognosis in multiple independent cohorts. In conclusion, this study highlights how HCC-derived RECQL4 disrupts cGAS-STING pathway activation in dendritic cells through DNA repair, thus reducing the radiosensitivity of HCC. These findings provide new perspectives on the clinical treatment of HCC.

Keywords: DNA repair; RecQ‐Like Helicase 4; cGAS‐STING pathway; hepatocellular carcinoma; tumor microenvironment.


Conflict of interest statement

The authors declare no conflict of interest.

Figures

Figure 1
Figure 1
Deep dissection of HCC scRNA‐seq reveals RECQL4 was highly expressed in malignant cells. A) Schematic diagram of scRNA‐seq data acquisition. B) UMAP plot representing cell types. C) Bar graph and pie chart showing relative numbers and cell proportion of different cell types, with each color representing a relevant cell type. D) Relative percentage of three cell clusters in different sample sources. E) UMAP plot representing malignant and non‐malignant cells detected by CopyKAT. F) Venn plot represents the intersection between genes significantly associated with DDRscore in malignant cells and 276 DDR genes. F) Density plot showing the expression distribution of RECQL4 in epithelial cells.
Figure 2
Figure 2
RECQL4 accelerates DNA damage repair in HCC after radiotherapy in vitro. A) GSEA of gene expression data in FDUZS cohort shows RECQL4 expression were enriched in DNA repair pathway and radiation response pathways. B) Representative images of neutral comet assay at 0, 0.5, 6, and 12 h after IR. C) Clonogenic assays and survival fraction curves of MHCC97H and HCCLM3 cells stably transfected with RECQL4 or empty vector after exposure to the indicated IR dose. D,E) Immunofluorescence staining revealed the cellular location of γ‐H2AX (D) and dsDNA (E) at 10 h after exposure to 6 Gy IR. F) Western blotting detects γ‐H2AX at different time points after RT in MHCC97H cells treated with control or RECQLE‐overexpression, or HCCLM3 cells treated with shNC or shRECQL4. Scale bar, 10 µm. Data are presented as mean ± sd.
Figure 3
Figure 3
RECQL4 regulates HCC radiosensitivity and induces a suppressive TME. A,B) Growth curves of primary tumors in C57BL/6 mics and NSG mice (n = 6). C) Growth curves of secondary tumors in each group (n = 6). D) UMAP plot performs dimensionality reduction and clustering of immune cells from scRNA‐seq. E) Bar graph represents the number of various immune cell types. F) ScRNA‐seq analysis of immune cells in HCC samples with high or low RECQL4 expression (left panel). Proportional graph of immune cells grouped by high or low RECQL4 expression (right panel). G) Immune infiltration analysis from TCGA‐LIHC cohort and ICGC‐LIRI‐JP cohort shows correlation between RECQL4 and DCs/CD8+T cells. H) Representative images of multi‐color immunofluorescence analysis of mouse HCC tissue labeled with CD4 (red), CD11c (green), and CD8 (pink). Data are presented as mean ± sem. P<0.05, ** P<0.01, *** P<0.001, **** P<0.0001.
Figure 4
Figure 4
RECQL4 impairs radiation‐induced recruitment of DCs and CD8+ T cells. A,B) Flow cytometric analysis of tumor infiltrating CD3+ T cell population (Live/CD45+/CD3+ cells) (A) and CD8+ T cell population (Live/CD45/CD3/CD8/CD69) B) in WT mouse tumor tissue. C,D) Flow cytometric analysis of antigen‐specific dendritic cells (CD45+/CD11c+/SIINFEKL+ cells/CD80) in draining lymph nodes of WT mice. E) qRT‐PCR quantification of IFN‐γ expression in tumor tissue. F) ELISA measurement of IFN‐γ concentration in tumor tissue, represented as pg/10 mg tumor tissue. G–J) qRT‐PCR quantification of CD80 (G), CD86 (H), CXCL10 (I), and IFN‐β (J) expression in tumor‐draining lymph node tissue. K,L) Purified CD11c+ DCs were co‐cultured with initial CD8+ T cells, and IFN‐γ secretion was detected by ELISPOT assay. The representative data shown are from six mice per group. Data are presented as mean ± SEM.
Figure 5
Figure 5
Immune suppression mediated by RECQL4 in liver cancer radiotherapy is dependent on disrupted cGAS‐STING pathway. A) GSEA of gene expression data in FDUZS cohort shows inhibition of Cytosolic DNA Sensing Pathway, Interferon Alpha Response, and Interferon Gamma Response in RECQL4 high‐expressing group. B) Western blotting analysis of RECQL4, TBK1, p‐TBK1, IRF3, p‐IRF3, STING, and p‐STING. C,D) Growth curves of primary tumors (C) and secondary tumors (D) in STING‐mutation mice in different treatment groups. E,F) Flow cytometric analysis of tumor‐infiltrating CD3+ T cell population (Live/CD45+/CD3+ cells) and CD8+ T cell population (Live/CD45/CD3/CD8/CD69) in STING‐mutation mouse tumor tissue. G,H) Flow cytometric analysis of antigen‐specific dendritic cells (CD45+/CD11c+/SIINFEKL+ cells/CD80) in draining lymph nodes of STING‐mutation mice. I) Purified CD11c+ DCs from STING‐mutation mice were co‐cultured with initial CD8+ T cells, and IFN‐γ secretion was detected by ELISPOT assay. J,K) Growth curves of primary tumors (J) and secondary tumors (K) in cGAS‐KO mice in different treatment groups. L,M) Flow cytometric analysis of tumor‐infiltrating CD3+ T cell population and CD8+ T cell population in cGAS‐KO mouse tumor tissue. N,O) Flow cytometric analysis of antigen‐specific dendritic cells in cGAS‐KO mouse tumor tissue. P) ELISPOT assay detected IFN‐γ secretion in cGAS‐KO mice.
Figure 6
Figure 6
RECQL4 suppresses radiation‐induced anti‐liver cancer immune response through cGAS‐STING signaling in dendritic cells. A) Bubble plot of cell type enrichment analysis based on scRNA‐seq. B) Western blotting analysis of STING, p‐STING, TBK1, p‐TBK1, IRF3, and p‐IRF3. C,D) Growth curves of primary tumors (C) and secondary tumors (D) in STING‐cKO mice in different treatment groups. E) Proposed working model of RECQL4. RECQL4 repairs DNA damage caused by RT to HCC, reduces the production and release of dsDNA, and inhibits the cGAS‐STING signaling in dendritic cells, thereby suppressing antigen presentation and effector T cell function of dendritic cells, reducing IFN release, weakening HCC radio‐sensitivity, and blocking the anticancer effect of RT activation.
Figure 7
Figure 7
Overexpression of RECQL4 in HCC is associated with poor prognosis. A) RECQL4 expression levels in 976 cases of HCC and non‐tumor tissues from four independent cohorts (FDUZS, TCGA‐LIHC, ICGC‐LIRI‐JP, and GSE14520). B,C) Representative images and statistical analysis of RECQL4 IHC staining intensity in 240 pairs of tissues. Scale bar, 50 µm. D) Kaplan‐Meier RFS curve of HCC tissues with high and low RECQL4 levels in FDUZS cohort (n = 159). E–G) Kaplan‐Meier OS curves of HCC tissues with high and low RECQL4 levels in three independent cohorts (TCGA‐LIHC cohort, n = 349; ICGC‐LIRI‐JP cohort, n = 243; GSE14520 cohort, n = 225). H) Meta‐analysis model integrating OS prognostic analysis results from three independent cohorts. I,J) Kaplan‐Meier OS and DFS curves of HCC tissues with high and low RECQL4 IHC‐score after quantifying IHC staining intensity (FDUZS cohort, n = 240). * P<0.05, ** P<0.01, *** P<0.001, **** P<0.0001.

References

    1. Sung H., Ferlay J., Siegel R. L., Laversanne M., Soerjomataram I., Jemal A., Bray F., CA Cancer J Clin 2021, 71, 209. - PubMed
    1. Riaz A., JAMA, J. Am. Med. Assoc. 2010, 303, 1062.
    1. Li S., Xu L., Wu G., Huang Z., Huang L., Zhang F., Wei C., Shen Q., Li R., Zhang L., Xu X., Adv. Sci. (Weinh) 2023, 10, e2207118. - PMC - PubMed
    1. Liao Y., Liu Y., Yu C., Lei Q., Cheng J., Kong W., Yu Y., Zhuang X., Sun W., Yin S., Cai G., Huang H., Adv. Sci. (Weinh) 2023, 10, e2302025. - PMC - PubMed
    1. Yoon S. M., Ryoo B.‐Y., Lee S. J., Kim J. H., Shin J. H., An J. H., Lee H. C., Lim Y.‐S., JAMA Oncol 2018, 4, 661. - PMC - PubMed

Publication types

MeSH terms