

Inhibition of CK2 Diminishes Fibrotic Scar Formation and Improves Outcomes After Ischemic Stroke via Reducing BRD4 Phosphorylation
- PMID: 38381246
- PMCID: PMC10991067
- DOI: 10.1007/s11064-024-04112-0
Inhibition of CK2 Diminishes Fibrotic Scar Formation and Improves Outcomes After Ischemic Stroke via Reducing BRD4 Phosphorylation
Abstract
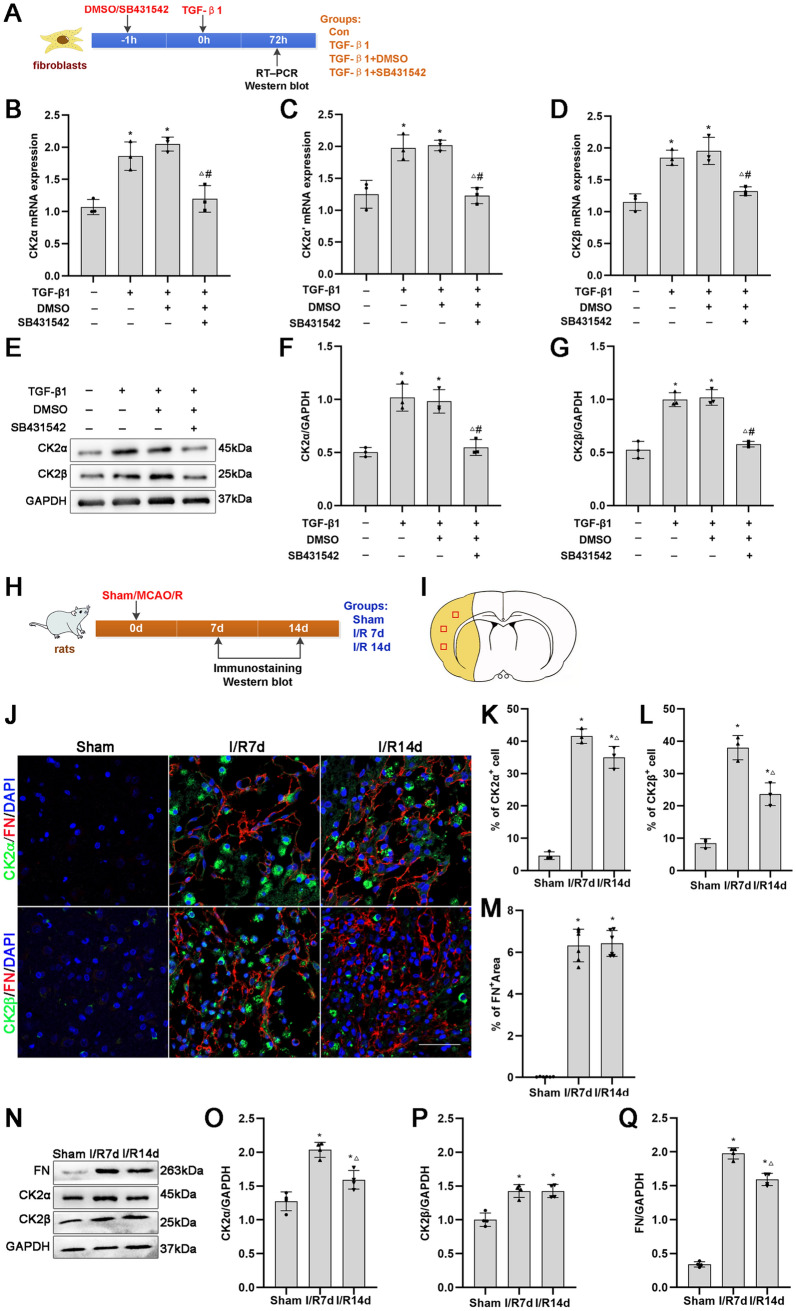
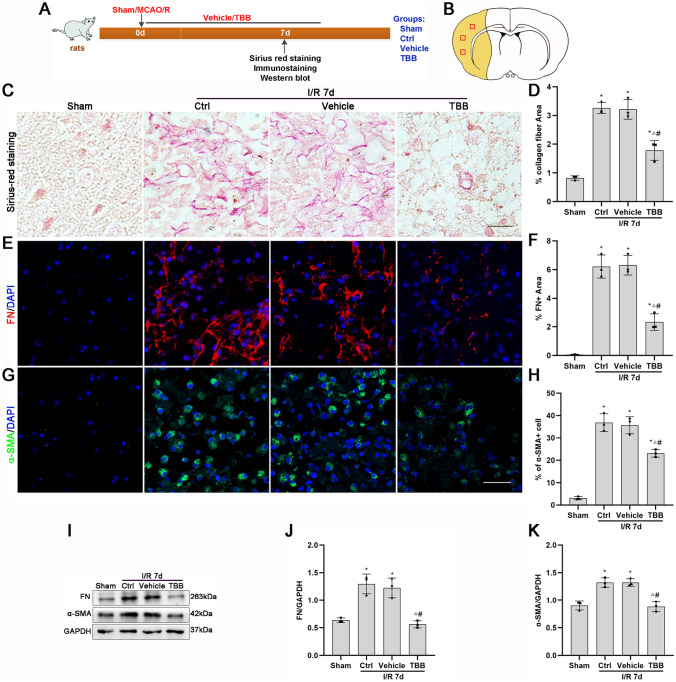
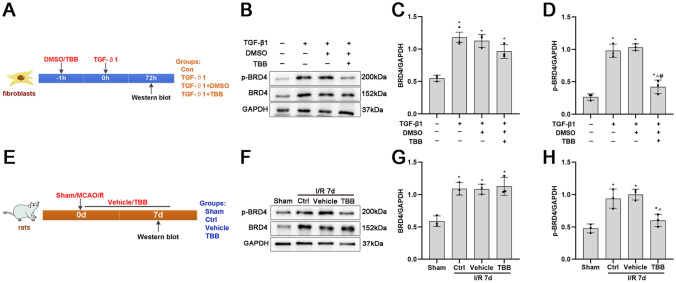
Fibrotic scars play important roles in tissue reconstruction and functional recovery in the late stage of nervous system injury. However, the mechanisms underlying fibrotic scar formation and regulation remain unclear. Casein kinase II (CK2) is a protein kinase that regulates a variety of cellular functions through the phosphorylation of proteins, including bromodomain-containing protein 4 (BRD4). CK2 and BRD4 participate in fibrosis formation in a variety of tissues. However, whether CK2 affects fibrotic scar formation remains unclear, as do the mechanisms of signal regulation after cerebral ischemic injury. In this study, we assessed whether CK2 could modulate fibrotic scar formation after cerebral ischemic injury through BRD4. Primary meningeal fibroblasts were isolated from neonatal rats and treated with transforming growth factor-β1 (TGF-β1), SB431542 (a TGF-β1 receptor kinase inhibitor) or TBB (a highly potent CK2 inhibitor). Adult SD rats were intraperitoneally injected with TBB to inhibit CK2 after MCAO/R. We found that CK2 expression was increased in vitro in the TGF-β1-induced fibrosis model and in vivo in the MCAO/R injury model. The TGF-β1 receptor kinase inhibitor SB431542 decreased CK2 expression in fibroblasts. The CK2 inhibitor TBB reduced the increases in proliferation, migration and activation of fibroblasts caused by TGF-β1 in vitro, and it inhibited fibrotic scar formation, ameliorated histopathological damage, protected Nissl bodies, decreased infarct volume and alleviated neurological deficits after MCAO/R injury in vivo. Furthermore, CK2 inhibition decreased BRD4 phosphorylation both in vitro and in vivo. The findings of the present study suggested that CK2 may control BRD4 phosphorylation to regulate fibrotic scar formation, to affecting outcomes after ischemic stroke.
Keywords: CK2; Cerebral ischemia; Fibroblast; Fibrotic scar formation; p-BRD4.
© 2024. The Author(s).
Conflict of interest statement
The authors declare that they have no relevant financial or nonfinancial interests to disclose.
Figures


Similar articles
-
Inhibition of BRD4 decreases fibrous scarring after ischemic stroke in rats by inhibiting the phosphorylation of Smad2/3.Brain Res. 2022 Dec 15;1797:148126. doi: 10.1016/j.brainres.2022.148126. Epub 2022 Oct 13. Brain Res. 2022. PMID: 36244457
-
Sirt1 Overexpression Inhibits Fibrous Scar Formation and Improves Functional Recovery After Cerebral Ischemic Injury Through the Deacetylation of 14-3-3ζ.Mol Neurobiol. 2023 Aug;60(8):4795-4810. doi: 10.1007/s12035-023-03378-9. Epub 2023 May 10. Mol Neurobiol. 2023. PMID: 37162725
-
Shh regulates M2 microglial polarization and fibrotic scar formation after ischemic stroke.Neurochem Int. 2024 Nov;180:105862. doi: 10.1016/j.neuint.2024.105862. Epub 2024 Sep 20. Neurochem Int. 2024. PMID: 39307461
-
Brd4 inhibition attenuates unilateral ureteral obstruction-induced fibrosis by blocking TGF-β-mediated Nox4 expression.Redox Biol. 2017 Apr;11:390-402. doi: 10.1016/j.redox.2016.12.031. Epub 2016 Dec 30. Redox Biol. 2017. PMID: 28063381 Free PMC article.
-
[Transforming growth factor beta1/Smad3 signal transduction pathway and post-traumatic scar formation].Zhongguo Xiu Fu Chong Jian Wai Ke Za Zhi. 2012 Mar;26(3):330-5. Zhongguo Xiu Fu Chong Jian Wai Ke Za Zhi. 2012. PMID: 22506473 Review. Chinese.
Cited by
-
Neuroprotective Effects, Mechanisms of Action and Therapeutic Potential of the Kv7/KCNQ Channel Opener QO-83 in Ischemic Stroke.Transl Stroke Res. 2025 Oct;16(5):1577-1593. doi: 10.1007/s12975-025-01329-1. Epub 2025 Jan 24. Transl Stroke Res. 2025. PMID: 39853651
-
Detrimental influence of Arginase-1 in infiltrating macrophages on poststroke functional recovery and inflammatory milieu.Proc Natl Acad Sci U S A. 2025 Feb 18;122(7):e2413484122. doi: 10.1073/pnas.2413484122. Epub 2025 Feb 14. Proc Natl Acad Sci U S A. 2025. PMID: 39951507 Free PMC article.
-
Fibrotic scar formation after cerebral ischemic stroke: Targeting the Sonic hedgehog signaling pathway for scar reduction.Neural Regen Res. 2026 Feb 1;21(2):756-768. doi: 10.4103/NRR.NRR-D-24-00999. Epub 2025 Feb 24. Neural Regen Res. 2026. PMID: 40183351 Free PMC article.
References
MeSH terms
Substances
Grants and funding
LinkOut - more resources
Full Text Sources
Medical
Molecular Biology Databases
