. 2024 May 1;30(9):1889-1905.
doi: 10.1158/1078-0432.CCR-23-2975.

Selective CDK7 Inhibition Suppresses Cell Cycle Progression and MYC Signaling While Enhancing Apoptosis in Therapy-resistant Estrogen Receptor-positive Breast Cancer

Affiliations

Selective CDK7 Inhibition Suppresses Cell Cycle Progression and MYC Signaling While Enhancing Apoptosis in Therapy-resistant Estrogen Receptor-positive Breast Cancer

Cristina Guarducci et al. Clin Cancer Res. .

Abstract

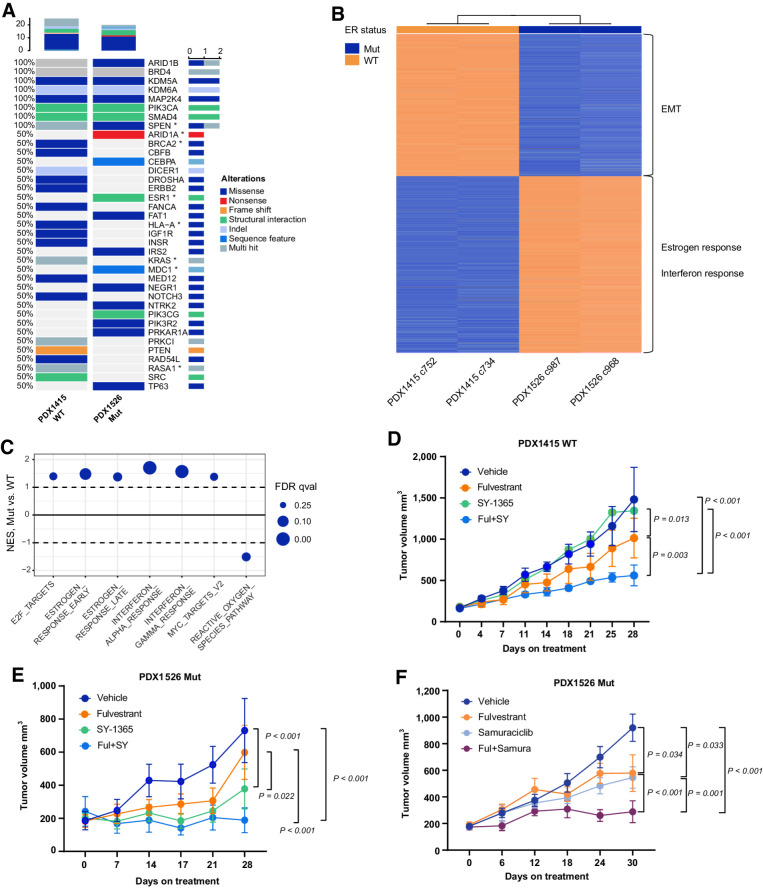
Purpose: Resistance to endocrine therapy (ET) and CDK4/6 inhibitors (CDK4/6i) is a clinical challenge in estrogen receptor (ER)-positive (ER+) breast cancer. Cyclin-dependent kinase 7 (CDK7) is a candidate target in endocrine-resistant ER+ breast cancer models and selective CDK7 inhibitors (CDK7i) are in clinical development for the treatment of ER+ breast cancer. Nonetheless, the precise mechanisms responsible for the activity of CDK7i in ER+ breast cancer remain elusive. Herein, we sought to unravel these mechanisms.

Experimental design: We conducted multi-omic analyses in ER+ breast cancer models in vitro and in vivo, including models with different genetic backgrounds. We also performed genome-wide CRISPR/Cas9 knockout screens to identify potential therapeutic vulnerabilities in CDK4/6i-resistant models.

Results: We found that the on-target antitumor effects of CDK7 inhibition in ER+ breast cancer are in part p53 dependent, and involve cell cycle inhibition and suppression of c-Myc. Moreover, CDK7 inhibition exhibited cytotoxic effects, distinctive from the cytostatic nature of ET and CDK4/6i. CDK7 inhibition resulted in suppression of ER phosphorylation at S118; however, long-term CDK7 inhibition resulted in increased ER signaling, supporting the combination of ET with a CDK7i. Finally, genome-wide CRISPR/Cas9 knockout screens identified CDK7 and MYC signaling as putative vulnerabilities in CDK4/6i resistance, and CDK7 inhibition effectively inhibited CDK4/6i-resistant models.

Conclusions: Taken together, these findings support the clinical investigation of selective CDK7 inhibition combined with ET to overcome treatment resistance in ER+ breast cancer. In addition, our study highlights the potential of increased c-Myc activity and intact p53 as predictors of sensitivity to CDK7i-based treatments.


Figures

Figure 1. Sensitivity and molecular consequences of CDK7 inhibition by SY-1365 in WT and mutant-ER breast cancer cells. A, Dose–response curves in WT-ER and mutant ER with and without the C312S CDK7 mutation in MCF7 cells after 5 days of treatment with SY-1365. Experiments were performed in triplicate and data were reported as average ± SEM. B, Dose–response curves in WT-ER and mutant ER with and without the C312S CDK7 mutation in MCF7 cells after 5 days of treatment with THZ1. Experiments were performed in triplicate and data reported as average ± SEM. C, Dose–response curves for SY-1365 treatment in ER-WT and doxycycline-inducible Y537S (DOX-Y537S) and D538G (DOX-D538G) ER-mutant MCF7 and T47D cells. Experiments were performed in triplicate and data reported as average ± SEM. D, Expression of CDK7 targets by whole cell lysates by Western blotting after treatment with increasing doses of SY-1365 (10–100 nmol/L) at multiple timepoints (6–72 hours). E, RPPA data from 24 hours of SY-1365 50 nmol/L in treated versus untreated ER-WT and DOX-Y537S MCF7 cells. Only total and phosphoproteins that were significantly (Welch t test, FDR < 0.05, outlined rectangles) upregulated or downregulated in at least one condition are shown. F, GSEA on differentially expressed genes from 6 and 24 hours, SY-1365 50 nmol/L-treated versus untreated, WT and DOX-Y537S MCF7 cells. Pathways that were significant in at least one pathway (FDR < 0.25) are shown. SY-1365 effect on the cell cycle of ER-WT (G) and DOX-Y537S (H) MCF7 cells at 48 hours. Percentages of cells in the cell cycle phases G0–G1, S, and G2–M are shown as a stacked barplot ± SEM. Significant cell accumulation in G0–G1 and G2–M phases compared with DMSO are reported above the barplot (two-way ANOVA Tukey multiple comparisons test).
Figure 1.
Sensitivity and molecular consequences of CDK7 inhibition by SY-1365 in WT and mutant-ER breast cancer cells. A, Dose–response curves in WT-ER and mutant ER with and without the C312S CDK7 mutation in MCF7 cells after 5 days of treatment with SY-1365. Experiments were performed in triplicate and data were reported as average ± SEM. B, Dose–response curves in WT-ER and mutant ER with and without the C312S CDK7 mutation in MCF7 cells after 5 days of treatment with THZ1. Experiments were performed in triplicate and data reported as average ± SEM. C, Dose–response curves for SY-1365 treatment in ER-WT and doxycycline-inducible Y537S (DOX-Y537S) and D538G (DOX-D538G) ER-mutant MCF7 and T47D cells. Experiments were performed in triplicate and data reported as average ± SEM. D, Expression of CDK7 targets by whole cell lysates by Western blotting after treatment with increasing doses of SY-1365 (10–100 nmol/L) at multiple timepoints (6–72 hours). E, RPPA data from 24 hours of SY-1365 50 nmol/L in treated versus untreated ER-WT and DOX-Y537S MCF7 cells. Only total and phosphoproteins that were significantly (Welch t test, FDR < 0.05, outlined rectangles) upregulated or downregulated in at least one condition are shown. F, GSEA on differentially expressed genes from 6 and 24 hours, SY-1365 50 nmol/L-treated versus untreated, WT and DOX-Y537S MCF7 cells. Pathways that were significant in at least one pathway (FDR < 0.25) are shown. SY-1365 effect on the cell cycle of ER-WT (G) and DOX-Y537S (H) MCF7 cells at 48 hours. Percentages of cells in the cell cycle phases G0–G1, S, and G2–M are shown as a stacked barplot ± SEM. Significant cell accumulation in G0–G1 and G2–M phases compared with DMSO are reported above the barplot (two-way ANOVA Tukey multiple comparisons test).
Figure 2. Molecular features of sensitivity to CDK7 inhibitors in ER-WT and Y537S ER-mutant breast cancer PDX. A, Oncoprint of high and moderate impact driver mutations detected by WES including a custom list of breast cancer–related genes. *, Denotes pathogenic mutations. B, Sample-feature RNA-seq clustering heat map (k-means 2) of the 1,000 top differentially expressed genes of untreated ER-WT (PDX1415) and Y537S ER-mutant (PDX1526) PDX. Two representative tumors/PDX are shown. Top enriched pathways (by gene ontology) of the differentially expressed genes are shown. C, GSEA from the untreated ER-mutant PDX1526 versus the untreated ER-WT PDX1415 models. Only the Hallmark pathways that are significantly (FDR < 0.25, GSEA weighted Kolmogorov–Smirnov test) positively or negatively enriched by NES are shown. Tumor growth of ER-WT PDX1415 (D) and ER-mutant PDX1526 (E) in presence of vehicle, fulvestrant, SY-1365, and fulvestrant + SY-1365 (Ful+SY) for 28 days. P values are based on mixed modeling with Tukey multiple comparisons test. F, Tumor growth of ER-mutant PDX1526 in presence of vehicle, fulvestrant, samuraciclib (samura), and fulvestrant + samuraciclib (Ful+samura) for 28 days (mixed modelling with Tukey multiple comparisons test). Only significant P values are denoted.
Figure 2.
Molecular features of sensitivity to CDK7 inhibitors in ER-WT and Y537S ER-mutant breast cancer PDX. A, Oncoprint of high and moderate impact driver mutations detected by WES including a custom list of breast cancer–related genes. *, Denotes pathogenic mutations. B, Sample-feature RNA-seq clustering heat map (k-means 2) of the 1,000 top differentially expressed genes of untreated ER-WT (PDX1415) and Y537S ER-mutant (PDX1526) PDX. Two representative tumors/PDX are shown. Top enriched pathways (by gene ontology) of the differentially expressed genes are shown. C, GSEA from the untreated ER-mutant PDX1526 versus the untreated ER-WT PDX1415 models. Only the Hallmark pathways that are significantly (FDR < 0.25, GSEA weighted Kolmogorov–Smirnov test) positively or negatively enriched by NES are shown. Tumor growth of ER-WT PDX1415 (D) and ER-mutant PDX1526 (E) in presence of vehicle, fulvestrant, SY-1365, and fulvestrant + SY-1365 (Ful+SY) for 28 days. P values are based on mixed modeling with Tukey multiple comparisons test. F, Tumor growth of ER-mutant PDX1526 in presence of vehicle, fulvestrant, samuraciclib (samura), and fulvestrant + samuraciclib (Ful+samura) for 28 days (mixed modelling with Tukey multiple comparisons test). Only significant P values are denoted.
Figure 3. SY-1365 inhibits proliferation and CDK7 targets in a PDX model. IHC staining (A) and quantification (% of positive cells; B) of Ki67. IHC for p-ER (S118; C) total ER (E), and their quantification (H-score; D and F, respectively). G, ESR1 gene expression, reported as normalized gene counts, in the four treatment conditions (N > 2). IHC staining and quantification of p-CDK1 (T161; % of positive cells; H), p-CDK2 (T160; % of positive cells; I), and c-Myc (H-score; J). K, TUNEL (green) and DAPI (blue) staining and quantification (% of positive cells). Scale bar: 50 μm. Statistic one-way ANOVA Tukey multiple comparisons test. L, GSEA on differentially expressed genes comparing fulvestrant-treated, SY-1365–treated, and fulvestrant + SY-1365–treated versus untreated PDX tumors. Only the Hallmark pathways that were significantly enriched (FDR < 0.25, GSEA weighted Kolmogorov–Smirnov test) in at least one condition are shown. M, Proposed model of the effects of CDK7 inhibition on ER.
Figure 3.
SY-1365 inhibits proliferation and CDK7 targets in a PDX model. IHC staining (A) and quantification (% of positive cells; B) of Ki67. IHC for p-ER (S118; C) total ER (E), and their quantification (H-score; D and F, respectively). G,ESR1 gene expression, reported as normalized gene counts, in the four treatment conditions (N > 2). IHC staining and quantification of p-CDK1 (T161; % of positive cells; H), p-CDK2 (T160; % of positive cells; I), and c-Myc (H-score; J). K, TUNEL (green) and DAPI (blue) staining and quantification (% of positive cells). Scale bar: 50 μm. Statistic one-way ANOVA Tukey multiple comparisons test. L, GSEA on differentially expressed genes comparing fulvestrant-treated, SY-1365–treated, and fulvestrant + SY-1365–treated versus untreated PDX tumors. Only the Hallmark pathways that were significantly enriched (FDR < 0.25, GSEA weighted Kolmogorov–Smirnov test) in at least one condition are shown. M, Proposed model of the effects of CDK7 inhibition on ER.
Figure 4. Genome-wide CRISPR/Cas9 KO screen on PalboS and PalboR T47D cells. A, Scheme of the CRISPR/Cas9 KO library screening experimental workflow. B, Scatterplot comparing genome-wide CRISPR/Cas9 KO screens performed in T47D PalboS cells treated with palbociclib 100 nmol/L and T47D PalboS control cells. The two diagonal lines indicate ±1.5 SD of the β-score values of the T47D PalboS control and the T47D palbociclib-treated cells. C, β-score values of cell cycle and ER+ breast cancer–related genes (P < 0.001 by permutation test, highlighted in rectangles). D, Scatterplot comparing genome wide CRISPR/Cas9 KO screens performed in PalboR T47D cells maintained with palbociclib 1 μmol/L and T47D PalboS control cells. The two diagonal lines indicate ±1.5 SD of the β-score values of the T47D PalboS control and the T47D PalboR cells. E, Pathway analysis of the essential genes (β-score <−1). The top 10 Hallmark pathways enriched in T47D PalboR cells are shown.
Figure 4.
Genome-wide CRISPR/Cas9 KO screen on PalboS and PalboR T47D cells. A, Scheme of the CRISPR/Cas9 KO library screening experimental workflow. B, Scatterplot comparing genome-wide CRISPR/Cas9 KO screens performed in T47D PalboS cells treated with palbociclib 100 nmol/L and T47D PalboS control cells. The two diagonal lines indicate ±1.5 SD of the β-score values of the T47D PalboS control and the T47D palbociclib-treated cells. C, β-score values of cell cycle and ER+ breast cancer–related genes (P < 0.001 by permutation test, highlighted in rectangles). D, Scatterplot comparing genome wide CRISPR/Cas9 KO screens performed in PalboR T47D cells maintained with palbociclib 1 μmol/L and T47D PalboS control cells. The two diagonal lines indicate ±1.5 SD of the β-score values of the T47D PalboS control and the T47D PalboR cells. E, Pathway analysis of the essential genes (β-score <−1). The top 10 Hallmark pathways enriched in T47D PalboR cells are shown.
Figure 5. Activity and molecular consequences of CDK7 inhibition in PalboS and PalboR cells. SY-1365 dose–response curves in T47D (A) and MCF7 (B) PalboR cells ± palbociclib 1 μmol/L and respective PalboS cells after 5 days of treatment. Experiments were performed in triplicate and data were reported as average ± SEM. SY-1365 effect on the cell cycle of PalboS and PalboR T47D (C and D, respectively) and MCF7 (E and F, respectively) cells after 48 hours of treatment. The experiment was performed in triplicate. Percentages of cells in the different cell cycle phases G0–G1, S, and G2–M are shown as a stacked barplot ± SEM. Significant cell accumulation in G0–G1 and G2–M phases compared with DMSO are reported above the barplot (two-way ANOVA Tukey multiple comparisons test). G, GSEA from 12 hours, SY-1365 50 nmol/L-treated versus untreated, T47D and MCF7 PalboR cells, and the respective PalboS cells. Gene sets that are significantly positively or negatively enriched in at least one condition are shown (FDR < 0.25, GSEA weighted Kolmogorov–Smirnov test). H, Differentially expressed proteins from RPPA data after 12 hours treatment with SY-1365 50 nmol/L compared with untreated in T47D and MCF7 PalboR cells and the respective PalboS cells. Only total and phosphoproteins that were significantly (Welch t test, FDR < 0.05, outlined rectangles) upregulated or downregulated in at least one condition are shown.
Figure 5.
Activity and molecular consequences of CDK7 inhibition in PalboS and PalboR cells. SY-1365 dose–response curves in T47D (A) and MCF7 (B) PalboR cells ± palbociclib 1 μmol/L and respective PalboS cells after 5 days of treatment. Experiments were performed in triplicate and data were reported as average ± SEM. SY-1365 effect on the cell cycle of PalboS and PalboR T47D (C and D, respectively) and MCF7 (E and F, respectively) cells after 48 hours of treatment. The experiment was performed in triplicate. Percentages of cells in the different cell cycle phases G0–G1, S, and G2–M are shown as a stacked barplot ± SEM. Significant cell accumulation in G0–G1 and G2–M phases compared with DMSO are reported above the barplot (two-way ANOVA Tukey multiple comparisons test). G, GSEA from 12 hours, SY-1365 50 nmol/L-treated versus untreated, T47D and MCF7 PalboR cells, and the respective PalboS cells. Gene sets that are significantly positively or negatively enriched in at least one condition are shown (FDR < 0.25, GSEA weighted Kolmogorov–Smirnov test). H, Differentially expressed proteins from RPPA data after 12 hours treatment with SY-1365 50 nmol/L compared with untreated in T47D and MCF7 PalboR cells and the respective PalboS cells. Only total and phosphoproteins that were significantly (Welch t test, FDR < 0.05, outlined rectangles) upregulated or downregulated in at least one condition are shown.
Figure 6. RNA-seq and RPPA integration by SAMNet identifies SY-1365 perturbed pathways in a multidimensional fashion. A, Integration of RNA-seq and RPPA data of ER-WT/ER-mutant (MCF7 WT/MCF7 DOX-Y537S) and PalboS/PalboR MCF7 and T47D cells treated with SY-1365 50 nmol/L compared with their respective vehicle controls together with a reference interactome dataset using SAMNet. Louvain clusters of the filtered SAMNet output network with at least 25 nodes are shown. Colors represent whether a node (gene/protein) is taken from one of the treatment contrasts, the interactome, or a combination of these. Shapes indicate the data source: transcriptomic data (sink transcriptomics), proteomic data (source proteomics), transcriptomic and proteomic data (sink transcriptomics, source proteomics), reference dataset ± transcriptomic and proteomic data (interactome). Pathway analysis (Fisher exact test, Hallmark dataset in enrichR) was used to identify the top functions specifically associated to each cluster. B, Model of the effect of CDK7 inhibition in ER+ breast cancer cells.
Figure 6.
RNA-seq and RPPA integration by SAMNet identifies SY-1365 perturbed pathways in a multidimensional fashion. A, Integration of RNA-seq and RPPA data of ER-WT/ER-mutant (MCF7 WT/MCF7 DOX-Y537S) and PalboS/PalboR MCF7 and T47D cells treated with SY-1365 50 nmol/L compared with their respective vehicle controls together with a reference interactome dataset using SAMNet. Louvain clusters of the filtered SAMNet output network with at least 25 nodes are shown. Colors represent whether a node (gene/protein) is taken from one of the treatment contrasts, the interactome, or a combination of these. Shapes indicate the data source: transcriptomic data (sink transcriptomics), proteomic data (source proteomics), transcriptomic and proteomic data (sink transcriptomics, source proteomics), reference dataset ± transcriptomic and proteomic data (interactome). Pathway analysis (Fisher exact test, Hallmark dataset in enrichR) was used to identify the top functions specifically associated to each cluster. B, Model of the effect of CDK7 inhibition in ER+ breast cancer cells.

References

    1. Mao P, Cohen O, Kowalski KJ, Kusiel JG, Buendia-Buendia JE, Cuoco MS, et al. . Acquired FGFR and FGF alterations confer resistance to estrogen receptor (ER) targeted therapy in ER(+) metastatic breast cancer. Clin Cancer Res 2020;26:5974–89. - PubMed
    1. Tsuji J, Li T, Grinshpun A, Coorens T, Russo D, Anderson L, et al. . Clinical efficacy and whole-exome sequencing of liquid biopsies in a phase IB/II study of bazedoxifene and palbociclib in advanced hormone receptor-positive breast cancer. Clin Cancer Res 2022;28:5066–78. - PMC - PubMed
    1. Jeselsohn R, Yelensky R, Buchwalter G, Frampton G, Meric-Bernstam F, Gonzalez-Angulo AM, et al. . Emergence of constitutively active estrogen receptor-alpha mutations in pretreated advanced estrogen receptor-positive breast cancer. Clin Cancer Res 2014;20:1757–67. - PMC - PubMed
    1. Grinshpun A, Sandusky ZM, Jeselsohn R. The clinical utility of ESR1 mutations in hormone receptor-positive, HER2-negative advanced breast cancer. Hematol Oncol Clin North Am 2023;37:169–81. - PubMed
    1. O'Leary B, Cutts RJ, Liu Y, Hrebien S, Huang X, Fenwick K, et al. . The genetic landscape and clonal evolution of breast cancer resistance to palbociclib plus fulvestrant in the PALOMA-3 trial. Cancer Discov 2018;8:1390–403. - PMC - PubMed

Publication types

MeSH terms