. 2024 Mar 26;43(3):113775.
doi: 10.1016/j.celrep.2024.113775. Epub 2024 Feb 20.

Systematic evaluation of retroviral LTRs as cis-regulatory elements in mouse embryos

Affiliations

Systematic evaluation of retroviral LTRs as cis-regulatory elements in mouse embryos

Jian Yang et al. Cell Rep. .

Abstract

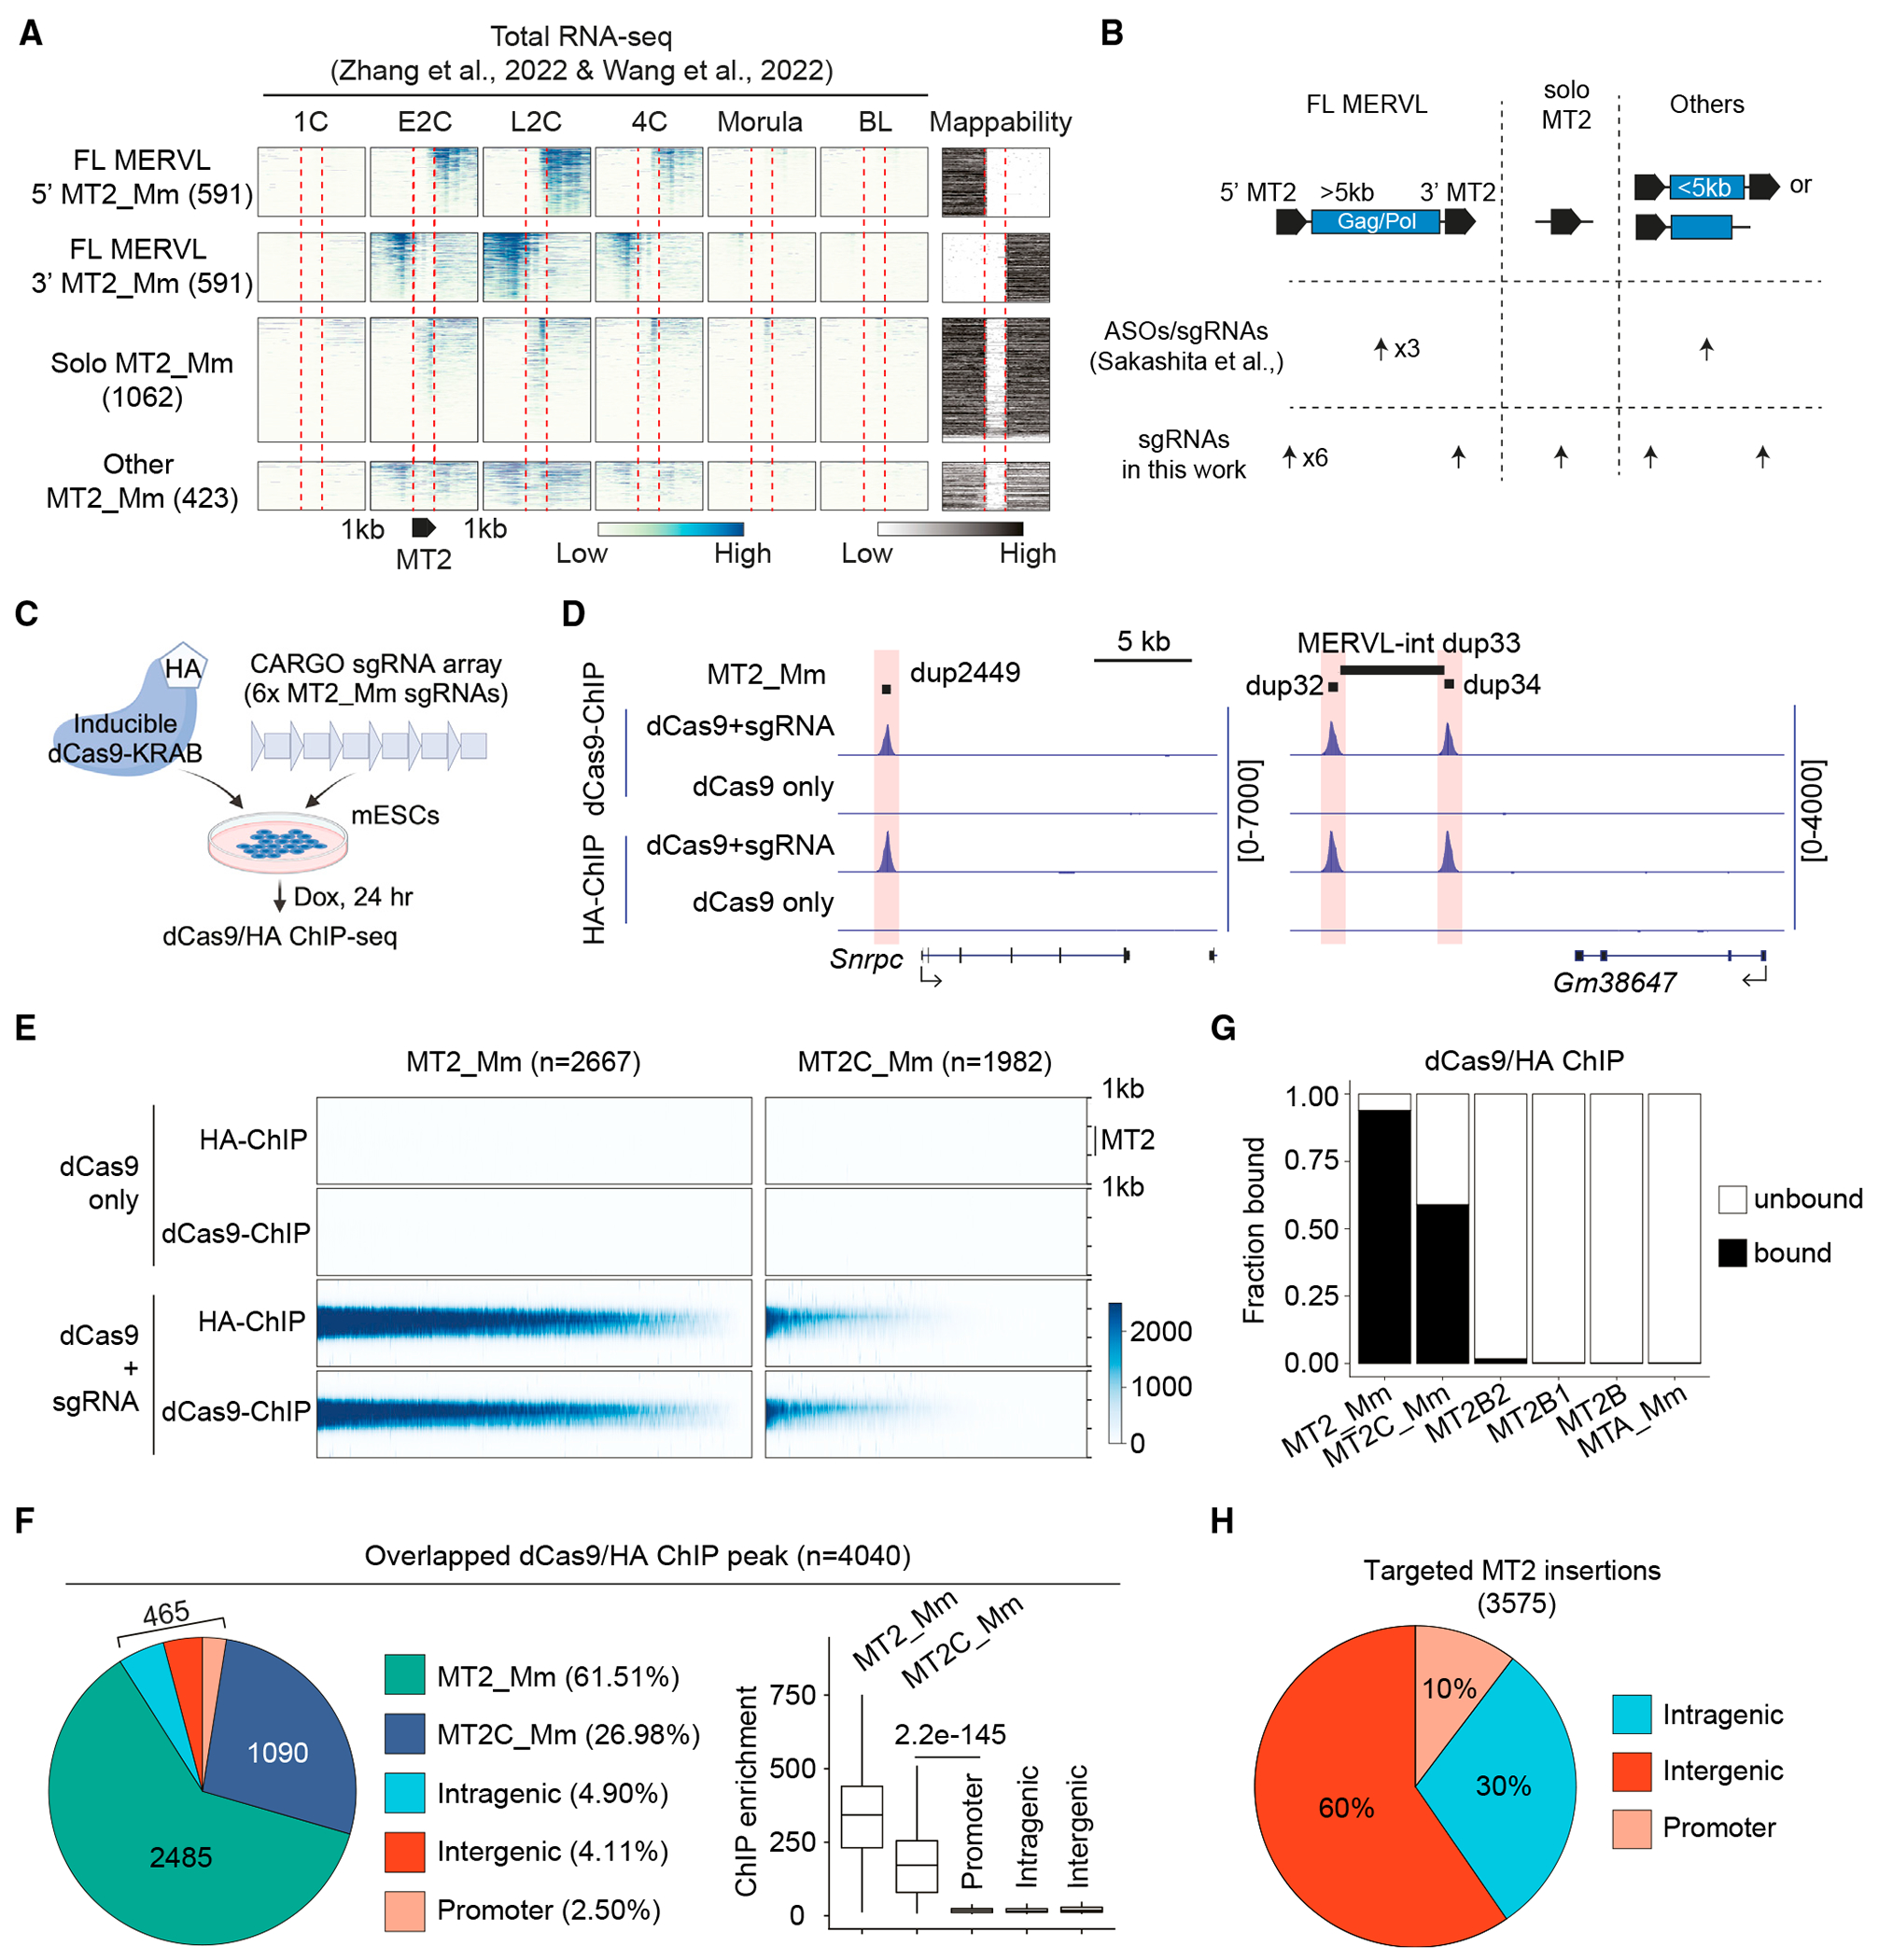
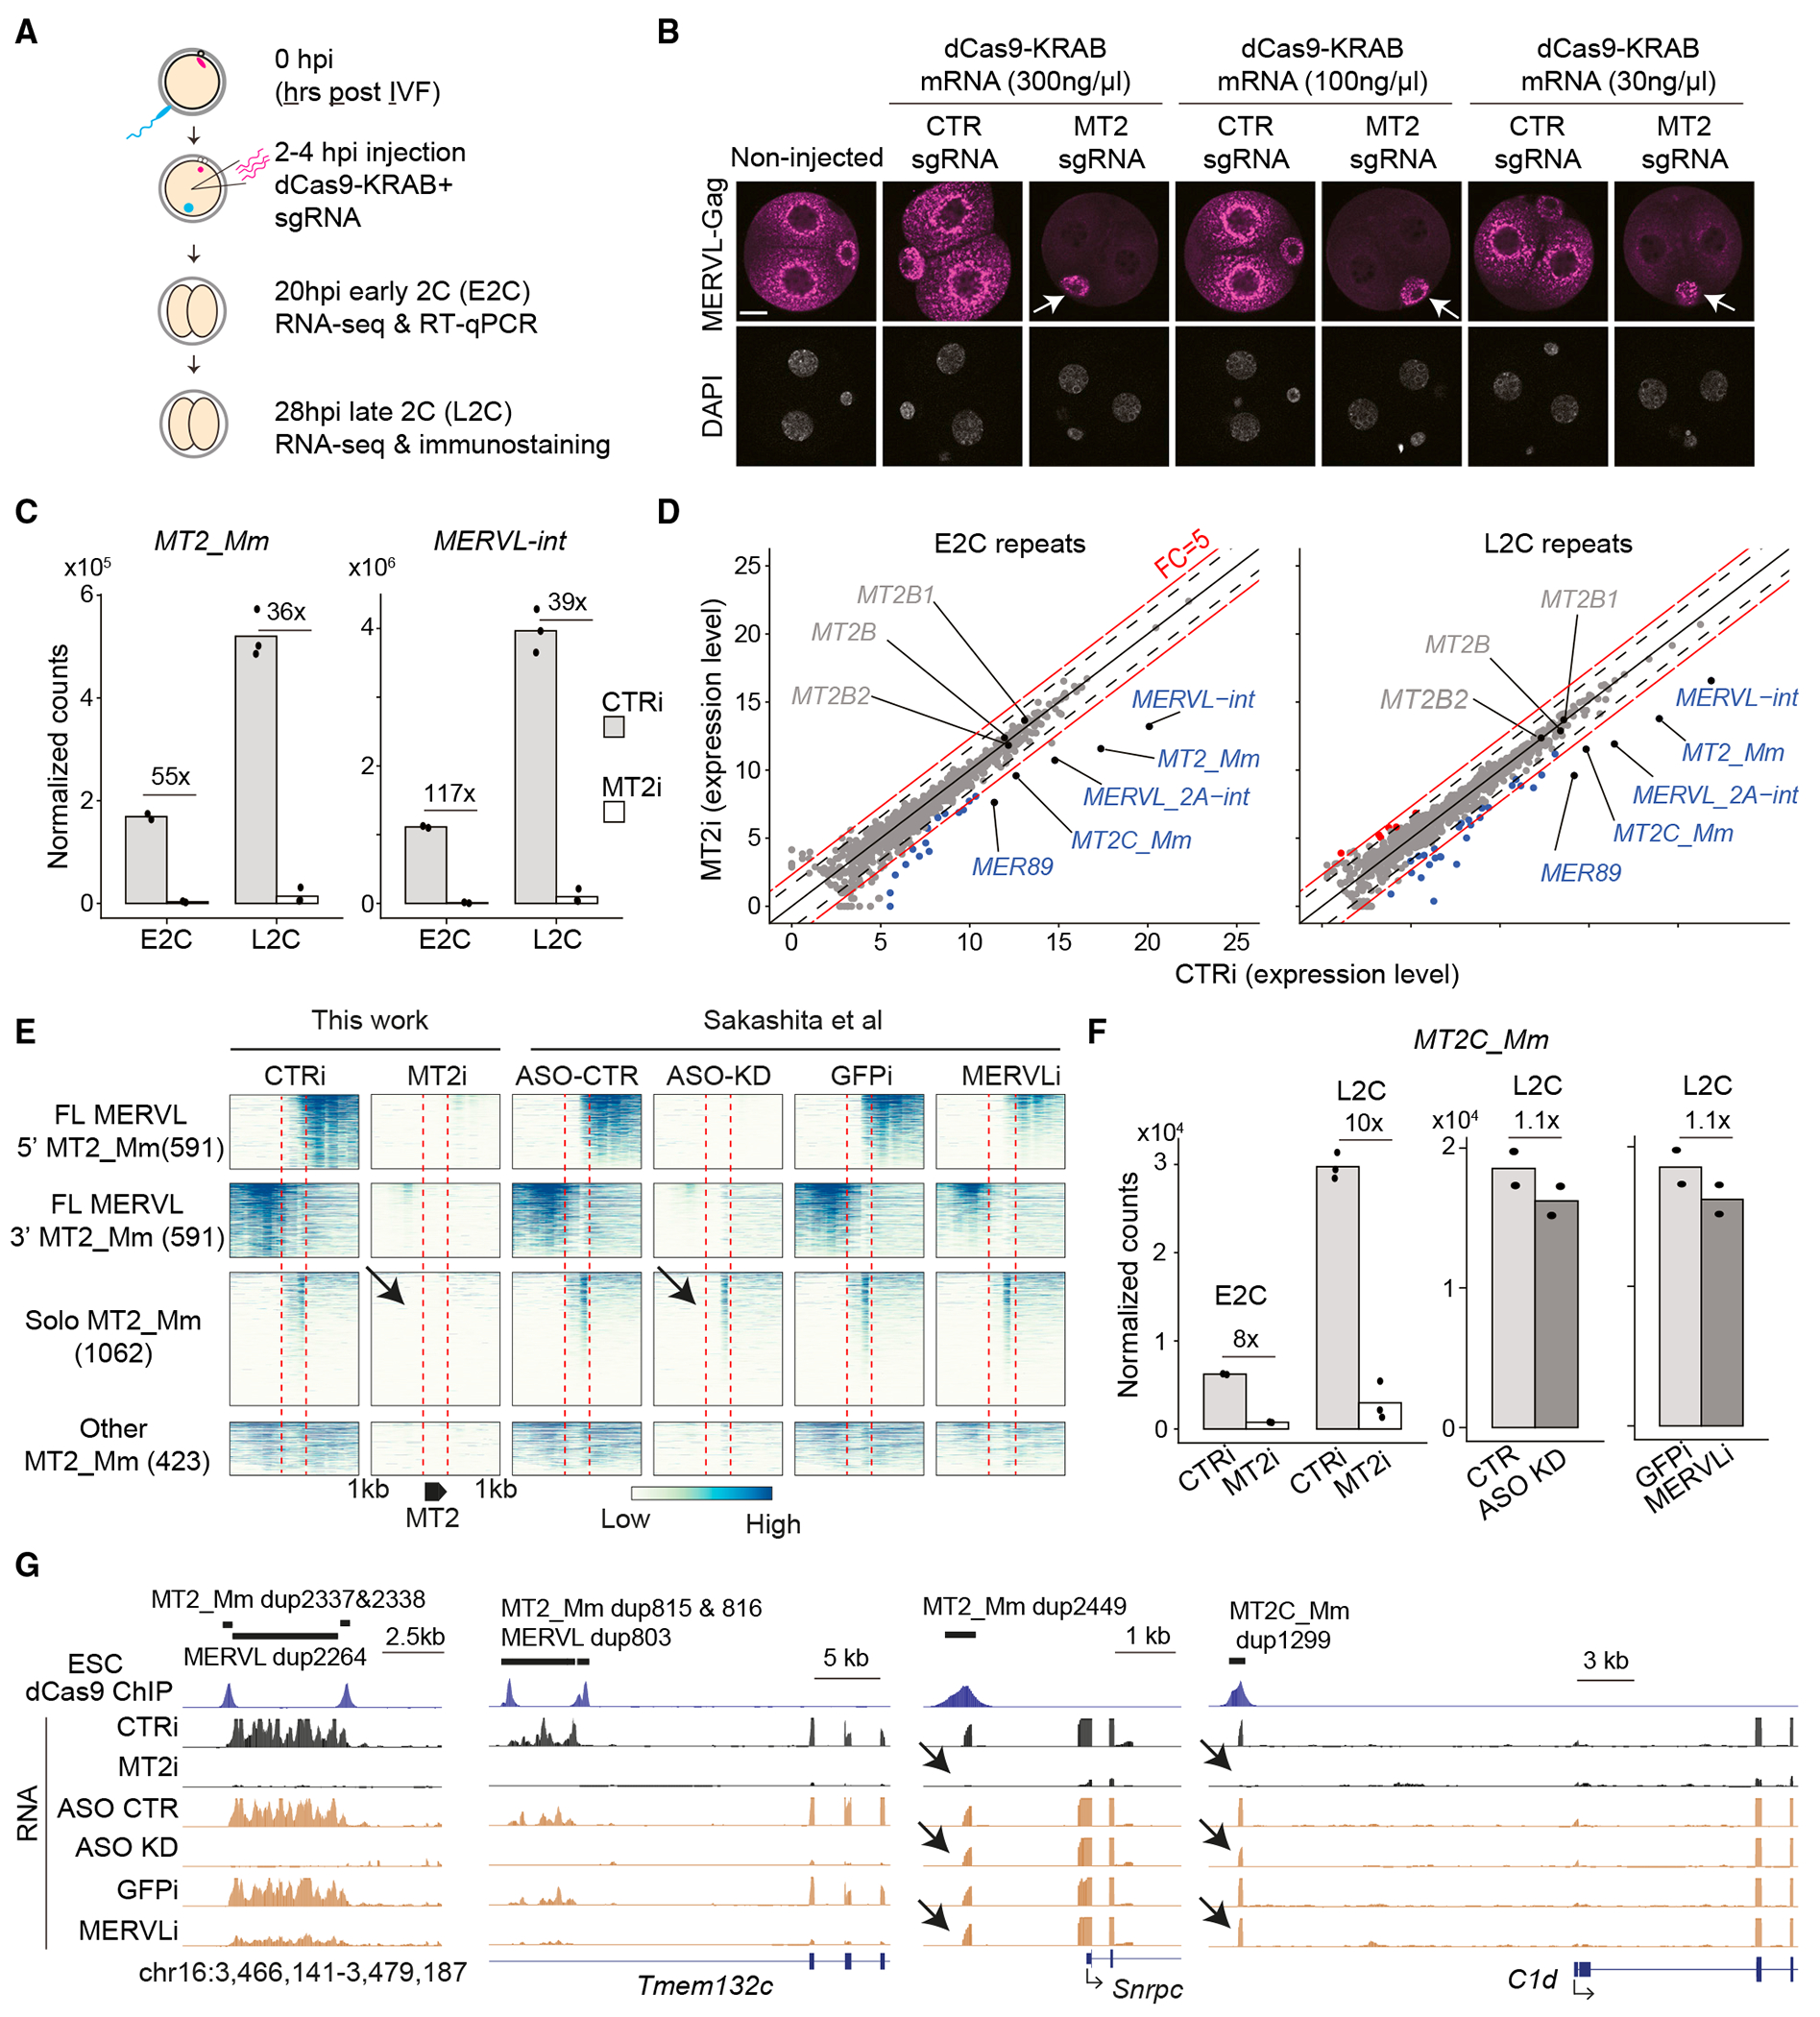
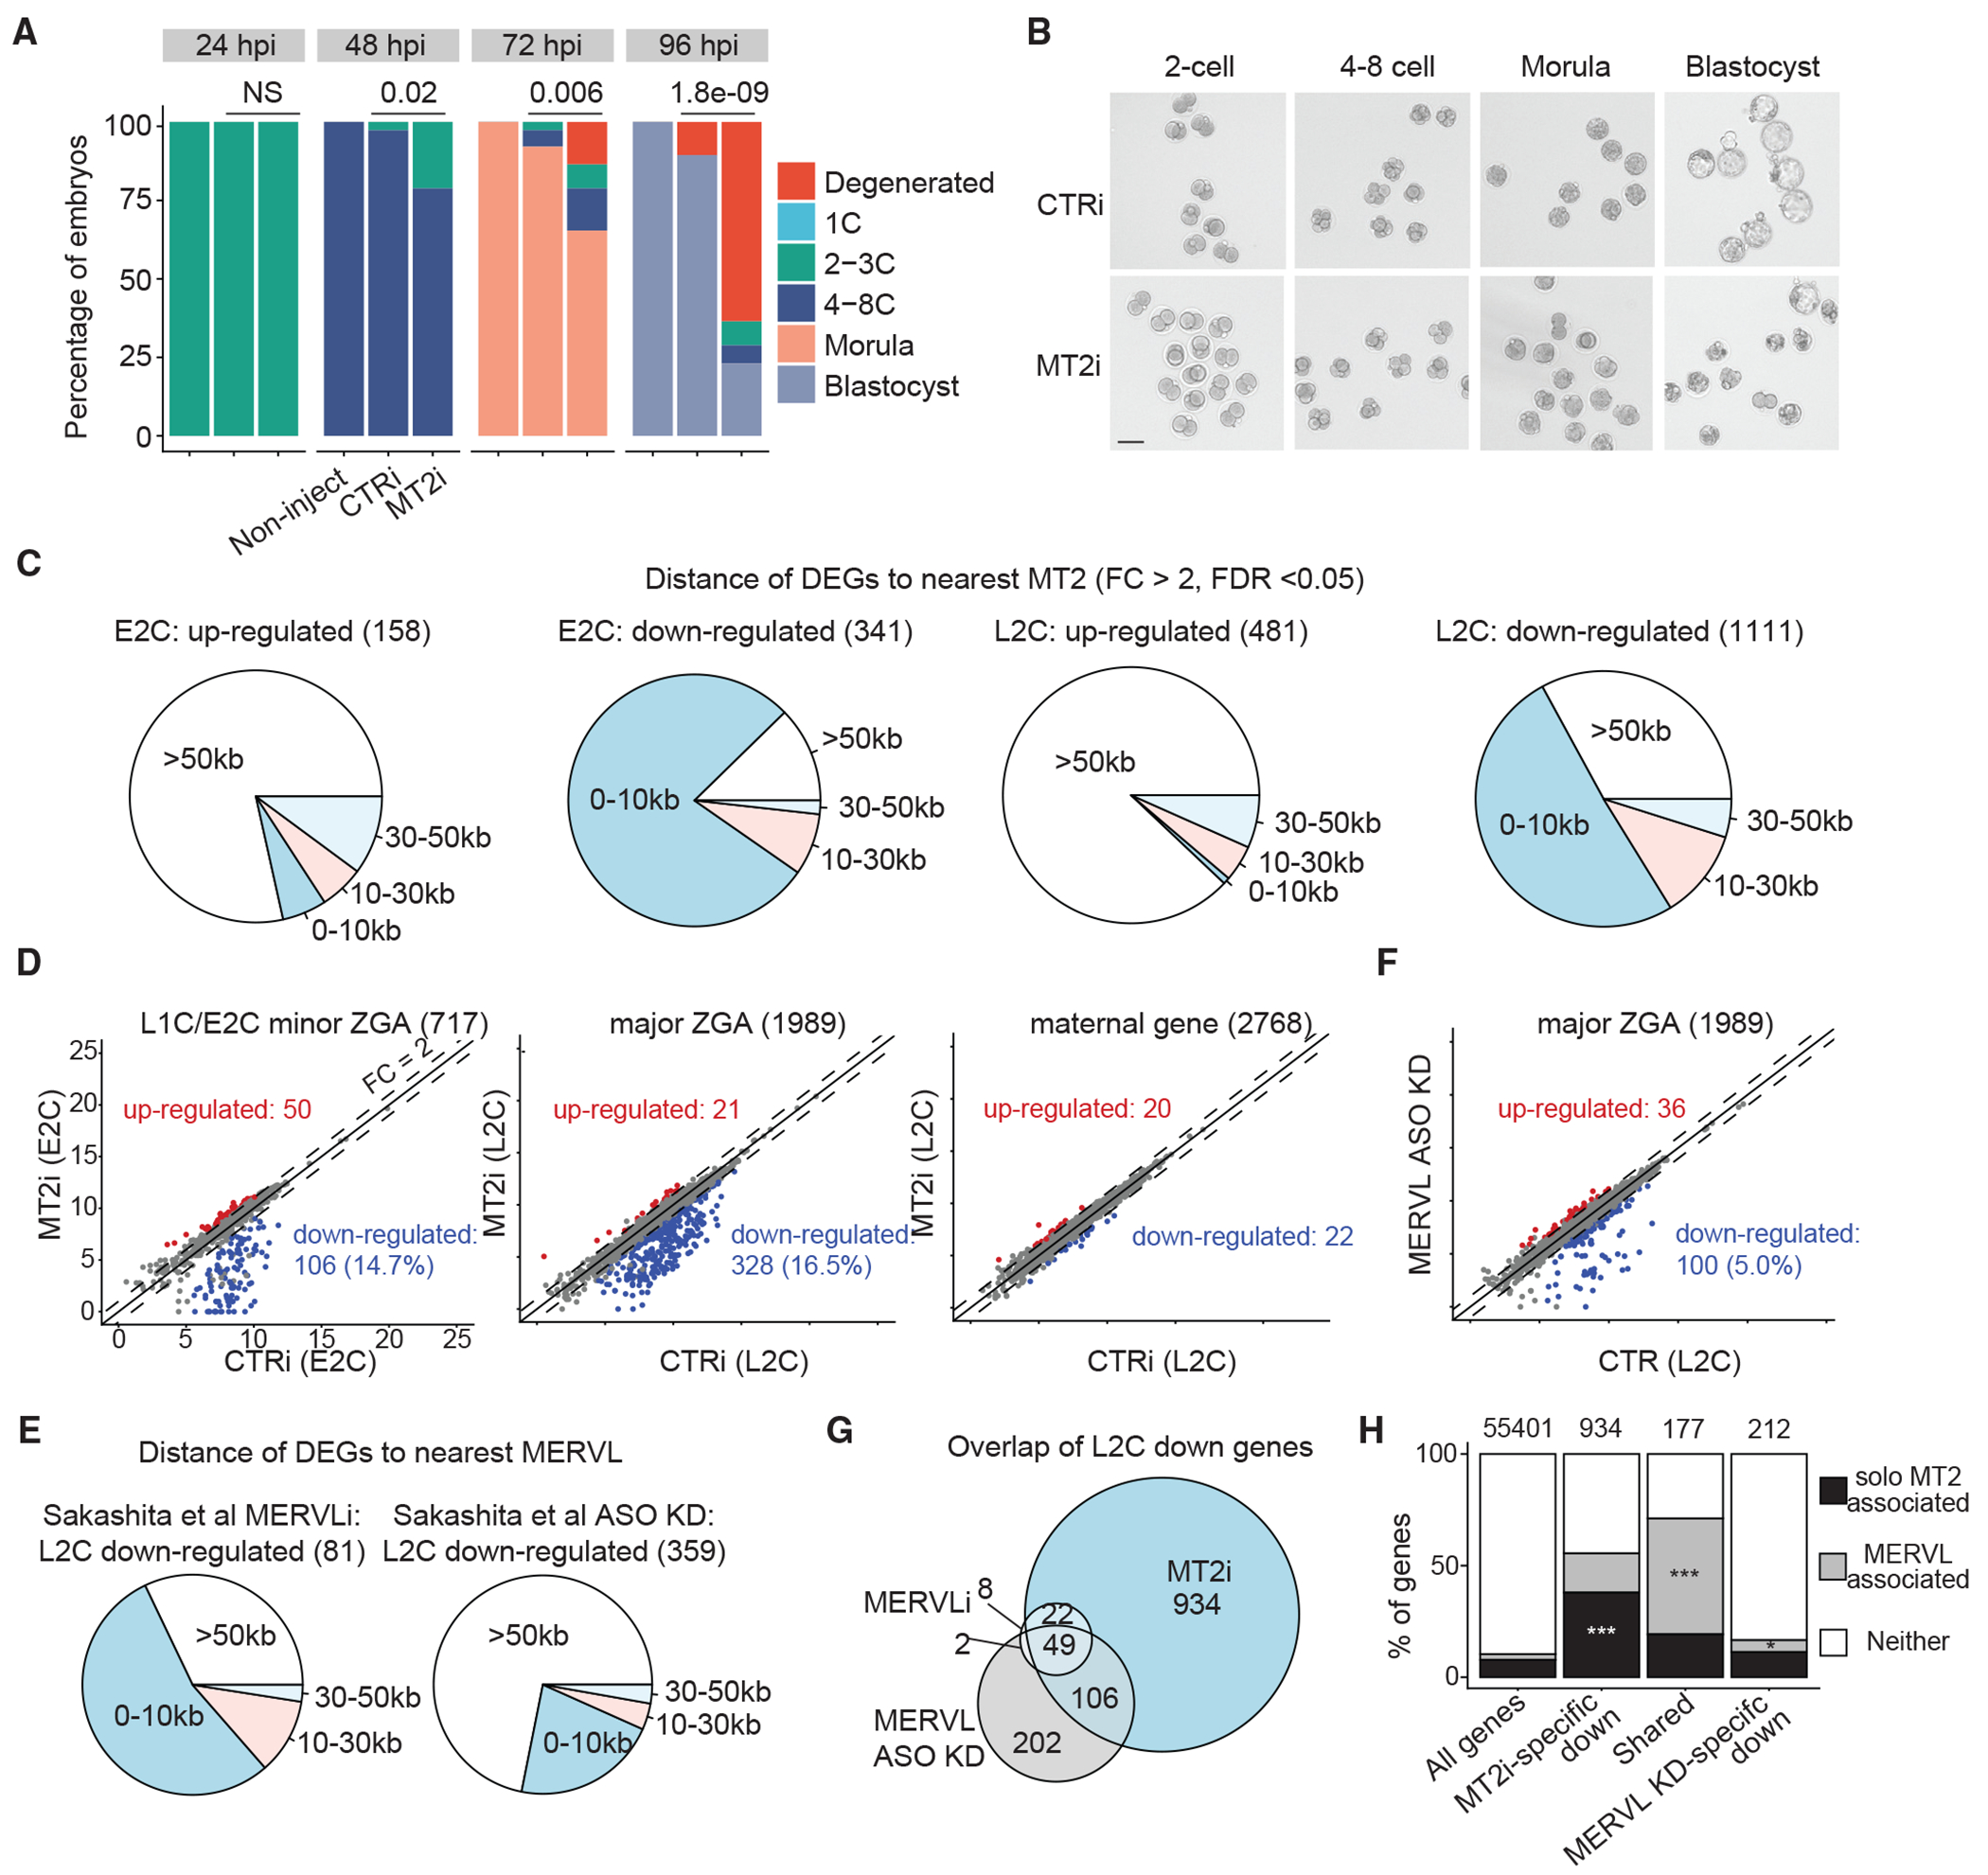
In mammals, many retrotransposons are de-repressed during zygotic genome activation (ZGA). However, their functions in early development remain elusive largely due to the challenge to simultaneously manipulate thousands of retrotransposon insertions in embryos. Here, we applied CRISPR interference (CRISPRi) to perturb the long terminal repeat (LTR) MT2_Mm, a well-known ZGA and totipotency marker that exists in ∼2,667 insertions throughout the mouse genome. CRISPRi robustly perturbed 2,485 (∼93%) MT2_Mm insertions and 1,090 (∼55%) insertions of the closely related MT2C_Mm in 2-cell embryos. Remarkably, such perturbation caused downregulation of hundreds of ZGA genes and embryonic arrest mostly at the morula stage. Mechanistically, MT2 LTRs are globally enriched for open chromatin and H3K27ac and function as promoters/enhancers downstream of OBOX/DUX proteins. Thus, we not only provide direct evidence to support the functional importance of MT2 activation in development but also systematically define cis-regulatory function of MT2 in embryos by integrating functional perturbation and multi-omic analyses.

Keywords: CP: Developmental biology; MERVL; MT2C_mm; MT2_mm; endogenous retroviruses; epigenome editing; long terminal repeats; preimplantation embryos; zygotic genome activation.


Conflict of interest statement

Declaration of interests The authors declare no competing financial interests.

Figures

Figure 1.
Figure 1.. Selective dCas9 targeting to MT2 by CARGO
(A) Expression dynamics of single MT2_Mm copies in preimplantation embryos. FL: full-length; E2C/L2C: early/late 2-cell; BL: blastocyst. (B) Schematics illustrating the different targeting designs between the two studies. (C) Experimental design of dCas9/HA ChIP-seq. (D) Genome browser views of dCas9 and HA ChIP signals at a solo MT2_Mm and a full-length MERVL. (E) Heatmap illustrating ChIP signals over MT2_Mm and MT2C_Mm insertions. (F) Pie chart showing genomic distributions of high-confidence ChIP-seq peaks (left panel). Boxplot showing ChIP signals at the targeted MT2 insertions and the off-target sites (right panel). The middle lines in the boxes represent medians. Box hinges indicate the 25th and 75th percentiles, and whiskers indicate the hinge ±1.5 × interquartile range. p value: two-sided Wilcoxon rank-sum test. (G) Stacked plot showing the fractions of LTRs bound by dCas9. (H) Pie chart showing genomic distributions of the targeted MT2 insertions. See also Figure S1.
Figure 2.
Figure 2.. Rapid, robust, and specific perturbation of thousands of MT2 LTRs in embryos
(A) Experimental design. IVF: in vitro fertilization. (B) Immunostaining of MERVL-Gag protein at the L2C stages. White arrows point to the second polar body. Scale bar: 20 μm. (C) Normalized RNA-seq read counts for MT2_Mm and MERVL-int at E2C and L2C stages. (D) Scatterplots comparing repeat expression at subfamily level between CTRi and MT2i. (E) Heatmap illustrating the differences in repeats perturbation by different approaches. Arrows point to the solo MT2 LTRs that are perturbed by MT2i but not by MERVL ASO KD and MERVLi. (F) Bar plots showing the effects of different perturbation methods on MT2C_Mm expression. Each dot represents one RNA-seq library. (G) Genome browser views of dCas9 ChIP and RNA signals at two full-length MERVL and two solo MT2 LTRs. See also Figure S2.
Figure 3.
Figure 3.. MT2 LTRs regulate ZGA and preimplantation development
(A) Percentage of embryos that reach to the indicated developmental stages at different time points. In total, 18, 38, and 52 embryos were analyzed for non-injected, CTRi, and MT2i groups, respectively. hpi: hours post insemination. p value: chi-square test. (B) Bright-field images showing embryos that reach to different developmental stages at indicated time points. Scale bar: 70 μm. (C) Pie charts showing the distances of DEGs to nearest MT2. (D) Scatterplots showing the expression level changes of minor ZGA, major ZGA, and maternal decay genes in the MT2i group. (E) Pie charts showing the distances of downregulated genes (FC > 2, p adj. < 0.05) to nearest MERVL. (F) Scatterplot showing the expression level changes of major ZGA genes in the MERVL ASK KD group. (G) Venn diagram showing the overlap of downregulated genes between MT2i, MERVLi, and MERVL ASO KD at the late 2-cell (L2C) stage. (H) Stacked plot showing the percentage of downregulated genes that are associated with solo MT2 or MERVL for different groups. Chi-square test: ***p value < 2.2e–16; *p value = 0.02. See also Figure S3.
Figure 4.
Figure 4.. MT2 LTRs function as cis-regulatory elements downstream of OBOX/DUX
(A) Heatmaps illustrating RNA expression, open chromatin, H3K4me3, H3K27ac, OBOX1/3/5, mutant OBOX5, and DUX enrichment at MT2_Mm. MT2_Mm copies are classified into two groups based on whether they have spliced RNA-seq reads. (B) Sequence logo of MT2 splice donor and acceptor sites. (C) Percentage of MT2 splicing events that are annotated as protein coding, lincRNA, pseudogenes, or that are unannotated. Note that one MT2 splice donor site may have multiple corresponding splice acceptor sites. (D) Gene expression changes in relation to distances from targeted repeats and off-target sites. p value: two-sided Wilcoxon rank-sum test. (E) Pie chart showing the percentage of MT2 copies that function as promoters and distal elements. (F) Heatmap illustrating expression changes of the indicated repeat subfamilies in Obox or Dux maternal zygotic KO (mzKO) and MT2i groups. (G) Heatmap indicating expression changes of Obox and Dux upon MT2i. (H) Venn diagram showing the overlap between MT2, OBOX, and DUX regulated genes. (I) Genome browser views of the indicated genomic loci. Dashed lines at the Ddit4l locus represent a splicing junction supported by RNA-seq reads. See also Figure S4.

Update of

Similar articles

Cited by

References

    1. Lander ES, Linton LM, Birren B, Nusbaum C, Zody MC, Baldwin J, Devon K, Dewar K, Doyle M, FitzHugh W, et al. (2001). Initial sequencing and analysis of the human genome. Nature 409, 860–921. 10.1038/35057062. - DOI - PubMed
    1. Fueyo R, Judd J, Feschotte C, and Wysocka J (2022). Roles of transposable elements in the regulation of mammalian transcription. Nat. Rev. Mol. Cell Biol 23, 481–497. 10.1038/s41580-022-00457-y. - DOI - PMC - PubMed
    1. Modzelewski AJ, Gan Chong J, Wang T, and He L (2022). Mammalian genome innovation through transposon domestication. Nat. Cell Biol 24, 1332–1340. 10.1038/s41556-022-00970-4. - DOI - PMC - PubMed
    1. Flemr M, Malik R, Franke V, Nejepinska J, Sedlacek R, Vlahovicek K, and Svoboda P (2013). A retrotransposon-driven dicer isoform directs endogenous small interfering RNA production in mouse oocytes. Cell 155, 807–816. 10.1016/j.cell.2013.10.001. - DOI - PubMed
    1. Modzelewski AJ, Shao W, Chen J, Lee A, Qi X, Noon M, Tjokro K, Sales G, Biton A, Anand A, et al. (2021). A mouse-specific retrotransposon drives a conserved Cdk2ap1 isoform essential for development. Cell 184, 5541–5558.e22. 10.1016/j.cell.2021.09.021. - DOI - PMC - PubMed