Multicenter Study
. 2024 Feb 21;20(2):e1011375.
doi: 10.1371/journal.pcbi.1011375. eCollection 2024 Feb.

EPINEST, an agent-based model to simulate epidemic dynamics in large-scale poultry production and distribution networks

Affiliations
Multicenter Study

EPINEST, an agent-based model to simulate epidemic dynamics in large-scale poultry production and distribution networks

Francesco Pinotti et al. PLoS Comput Biol. .

Abstract

The rapid intensification of poultry production raises important concerns about the associated risks of zoonotic infections. Here, we introduce EPINEST (EPIdemic NEtwork Simulation in poultry Transportation systems): an agent-based modelling framework designed to simulate pathogen transmission within realistic poultry production and distribution networks. We provide example applications to broiler production in Bangladesh, but the modular structure of the model allows for easy parameterization to suit specific countries and system configurations. Moreover, the framework enables the replication of a wide range of eco-epidemiological scenarios by incorporating diverse pathogen life-history traits, modes of transmission and interactions between multiple strains and/or pathogens. EPINEST was developed in the context of an interdisciplinary multi-centre study conducted in Bangladesh, India, Vietnam and Sri Lanka, and will facilitate the investigation of the spreading patterns of various health hazards such as avian influenza, Campylobacter, Salmonella and antimicrobial resistance in these countries. Furthermore, this modelling framework holds potential for broader application in veterinary epidemiology and One Health research, extending its relevance beyond poultry to encompass other livestock species and disease systems.


Conflict of interest statement

The authors have no competing interests to declare.

Figures

Fig 1
Fig 1. Model schematics.
(A) Synthetic PDN and poultry movements. Chickens are produced in farms (red) across the study area, and transported to LBMs (blue) by middlemen (yellow). These are mobile traders that may collect chickens from multiple farms located in one or more upazilas/sub-districts (an administrative area below that of a district in Bangladesh). Within LBMs, chickens are handled by vendors (orange) and may be moved between LBMs as a result of vendors’ trading practices. (B) Individual settings associated with farms, middlemen, LBMs (when open) and vendors (overnight, when LBMs are closed) provide the context for pathogen transmission, under the assumption that chickens mix homogeneously within the same setting. The panel zooms in on a single LBM, where chickens are colour-coded according to disease status: susceptible (S), exposed or latent (E), infectious (I) and recovered or immune (R). The base layer of the map was obtained from https://gadm.org/download_country_v2.html.
Fig 2
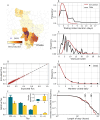
Fig 2. Simulating poultry movements.
(A) Spatial population of 1200 farms supplying Dhaka. Farm locations are generated as described in S1 Text and assigned preferentially to upazilas with a larger observed outgoing chicken flux (colour scale). (B) Empirical (black) and simulated (red) distribution of times required to sell an entire batch. (C) Expected and measured distributions of transactions a single batch is split into. (D) Measured vs expected relative flux between individual pairs (dots) of upazilas and LBMs. (E) Distribution of LBMs serviced daily by individual middlemen. (F) Proportion of chickens sold to wholesalers (W, teal) and retailers (R, yellow) by LBM tier in simulations (bars) and data (markers). MMV0 refers to transactions involving middlemen and first tier vendors, while VLVL+1 represents inter-tier transactions. For each tier, bars do not add up to 1 since wholesalers can sell to end-point consumers as well. Inset shows proportions of wholesalers and retailers. (G) Marketing time distribution. Results are obtained from a single simulation with default settings. We emphasize that some of the quantities shown here (panels B,C,G), emerge dynamically during simulations and are not enforced as tightly as poultry fluxes (D) and visits to LBMs (E). Farm data are obtained from [27]. Data about middlemen and vendor trading practices and marketing times are obtained from [18]. The base layer of the map was obtained from https://gadm.org/download_country_v2.html.
Fig 3
Fig 3. Markets serviced daily.
(A) Empirical (scatters) and simulated (lines) distributions of markets serviced daily. Empirical distributions are of the form Pr(km=n)(1-pkm)n-1pkm where n = 1, …, 20. The inset compares empirical and simulated average numbers of markets serviced. (B) Distribution of vendors a single middleman trades daily with. (C) Cumulative distribution of sizes of transactions involving middlemen and vendors (solid lines). Dashed lines represent cumulative proportion of chickens sold in transactions up to a given size. Results are averaged over 50 simulations from 10 different PDN realisations.
Fig 4
Fig 4. Vendor trading practices.
(A) Average marketing time as a function of ρunsold for different values of pempty. Solid and dashed lines correspond respectively to low (10%) and high (90%) frequency of vendors prioritizing trading older chickens. (B) Proportion of marketed chickens offered for sale on multiple days. (C) Marketing time distributions for low and high frequency of vendors prioritizing older chickens. Here, ρunsold = 0.1 and pempty = 0.2. Results are averaged over 50 simulations from 10 different PDN realisations.
Fig 5
Fig 5. LBM networks and poultry mixing.
(A,B) Broiler LBM networks for Chattogram and Dhaka, respectively. An arrow pointing from market l to l′ indicates at least one movement in that direction, while arrow thickness is proportional to the number of vendors moving on that edge. Node size is proportional to the outgoing weight, i.e. the total number of vendors leaving it. Isolated and connected nodes are shown in cyan and teal, respectively. (C,D) GRC and TD, respectively, for Dhaka’s network (line) and ensembles of 2000 synthetic LBM networks with the same density as Dhaka’s network and prandom = 1 (red) and prandom = 0.1 (cyan). (E,F) Average GRC and TD, respectively, across 100 networks with 20 nodes and as a function of ρ and prandom. The dotted line denotes Dhaka’s density. (G,H) Pianka’s index of overlap and proportion of markets where it is possible to find chickens from different upazilas/sub-districts, respectively, as a function of network parameters. Performing the same measurement before any vendor movement occurs, yields an overlap (Pianka’s) of 0.261, and 25,7% shared markets, on average. This represents the baseline overlap due to middlemen sourcing chickens from farms and selling them to vendors. Results are averaged over 50 simulations from 10 different PDN realisations. All other PDN parameters are set to default values.
Fig 6
Fig 6. Epidemic dynamics.
(A) Daily incidence in LBMs in multiple simulations. (B) Cumulative number of new farms infected over time from multiple clusters. Each cluster is initiated by a different infectious seed. (C) Distribution of attack rates for individual production cycles, conditional on at least one infection. (D-F) High farm transmission scenario (wF = 0.2, wM = 0.7). Colour scale corresponds to varying levels of inter-farm transmission βFF. (D) Proportion of incident cases in different setting types (F: farms, MM: middlemen, M: markets, V: vendors). (E) Average hourly prevalence in LBMs at stationariety. (F) Proportion of latent and infectious chickens entering markets daily as a function of βFF. (G-I) High LBM transmission scenario (wF = 0.1, wM = 2.4). Colour scale corresponds to varying latent period TE. (G,H) mirror (D,E). (I) Persistence is measured as the proportion of simulations where at least one transmission chain persisting in markets and vendors for longer than 50 days was observed. Results are qualitatively the same under different criteria about the duration of transmission chains (S5 Fig). Other parameters are set to default values. Results are based on 50 simulations from 10 different synthetic PDNs.
Fig 7
Fig 7. Multi-strain dynamics and viral mixing in LBMs.
(A-C) Simulations with no inter-farm transmission (βFF = 0). (A) Viral amplification happening through transportation from farm to LBM gates as a function of middlemen-specific transmission weight wMM. This is quantified through the difference between total numbers of exposed and infected chickens sold to vendors and purchased daily by middlemen. (B) Average strain richness (i.e. number of strains) in single LBMs as a function of density ρ of vendor movements (on the x-axis), wMM (from light to dark). Solid and striped bars correspond to low and high hierarchy in vendor movements, respectively. (C) Average Pianka’s index of overlap between pairs of LBMs in terms of their catchment areas. (D-F) Simulations with inter-farm transmission. (D) Average richness per upazila for increasing βFF. Note that the bottom-right map uses a different colour scale. (E,F) Same as (B,C) but for varying βFF and with wMM = 0.001. We set wF = 0.1 in (A-C) and wF = 0.2 in (D-F), while wM = 2.4 and wV = 1 in all panels. Cross-immunity reduces susceptibility to secondary infections to σ = 0.3. Results are averaged over 50 simulations from 10 different synthetic PDNs. In each simulation, statistics are collected for 100 days after an initial transient of 2000 days. The base layer of the maps was obtained from https://gadm.org/download_country_v2.html.

Similar articles

References

    1. Barua H, Biswas PK, Olsen KEP, Christensen JP. Prevalence and Characterization of Motile Salmonella in Commercial Layer Poultry Farms in Bangladesh. PLOS ONE. 2012;7(4):e35914. doi: 10.1371/journal.pone.0035914 - DOI - PMC - PubMed
    1. Kaplan BS, Webby RJ. The avian and mammalian host range of highly pathogenic avian H5N1 influenza. Virus research. 2013;178(1):3–11. doi: 10.1016/j.virusres.2013.09.004 - DOI - PMC - PubMed
    1. Mohd HA, Al-Tawfiq JA, Memish ZA. Middle East Respiratory Syndrome Coronavirus (MERS-CoV) origin and animal reservoir. Virology Journal. 2016;13(1):87. doi: 10.1186/s12985-016-0544-0 - DOI - PMC - PubMed
    1. Koch LK, Cunze S, Kochmann J, Klimpel S. Bats as putative Zaire ebolavirus reservoir hosts and their habitat suitability in Africa. Scientific Reports. 2020;10(1):14268. doi: 10.1038/s41598-020-71226-0 - DOI - PMC - PubMed
    1. Sharun K, Dhama K, Pawde AM, Gortázar C, Tiwari R, Bonilla-Aldana DK, et al.. SARS-CoV-2 in animals: potential for unknown reservoir hosts and public health implications. The Veterinary Quarterly. 2021;41(1):181–201. doi: 10.1080/01652176.2021.1921311 - DOI - PMC - PubMed

Publication types