. 2024 Feb 23;10(8):eadl1258.
doi: 10.1126/sciadv.adl1258. Epub 2024 Feb 21.

Discovery of a Cushing's syndrome protein kinase A mutant that biases signaling through type I AKAPs

Affiliations

Discovery of a Cushing's syndrome protein kinase A mutant that biases signaling through type I AKAPs

Mitchell H Omar et al. Sci Adv. .

Abstract

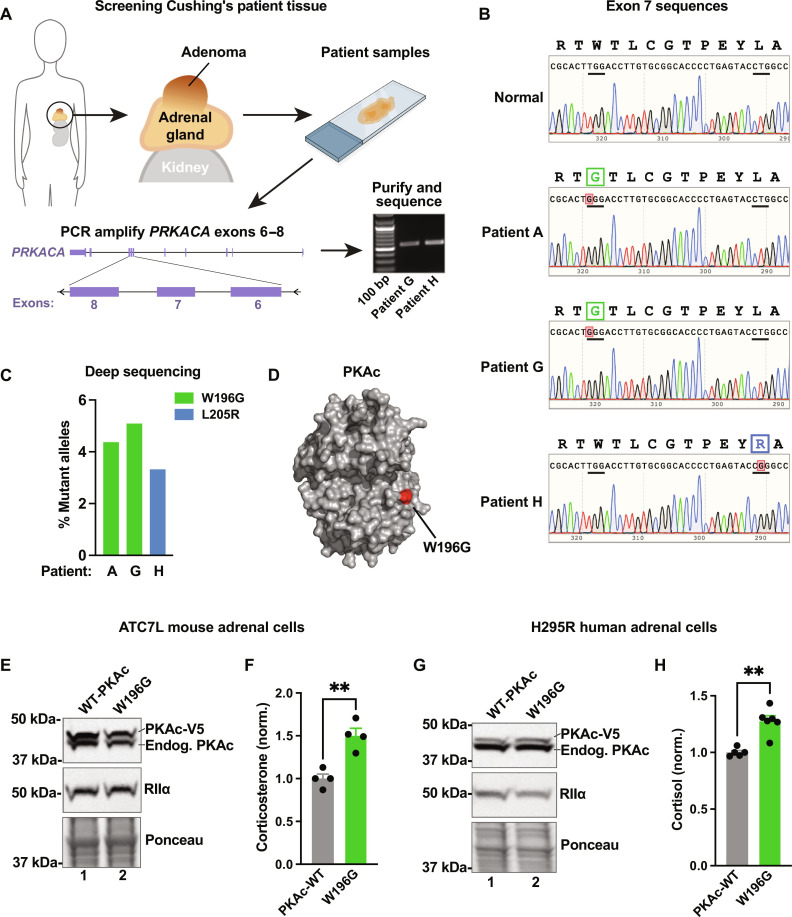
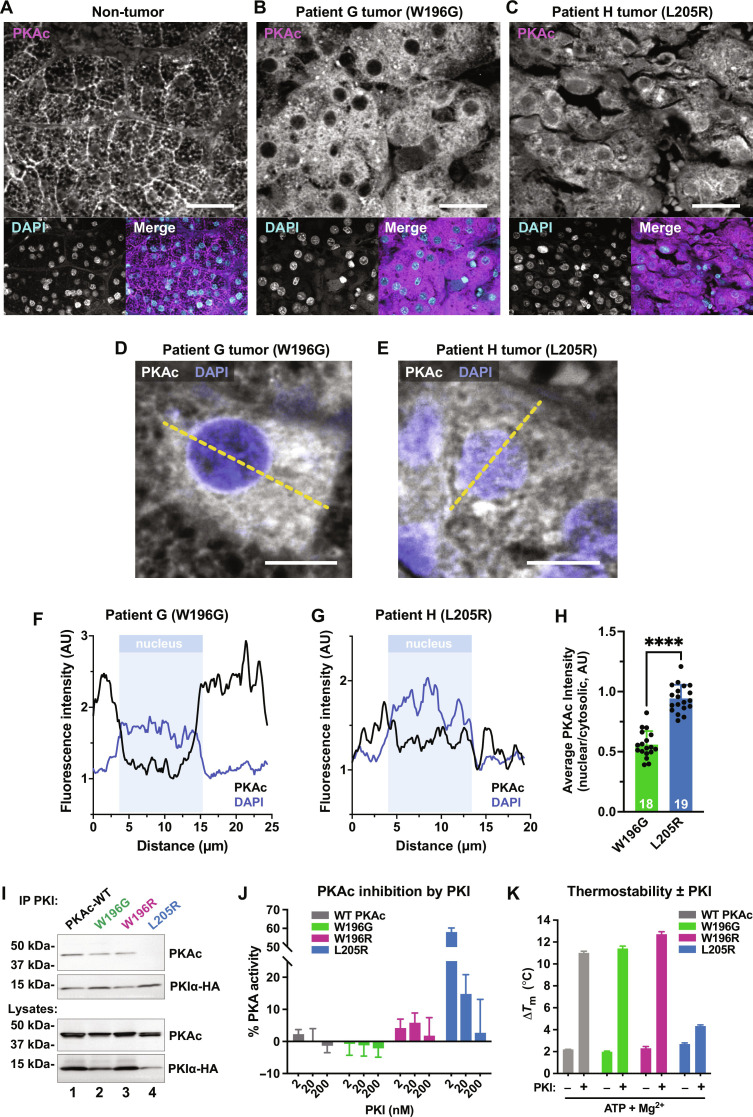
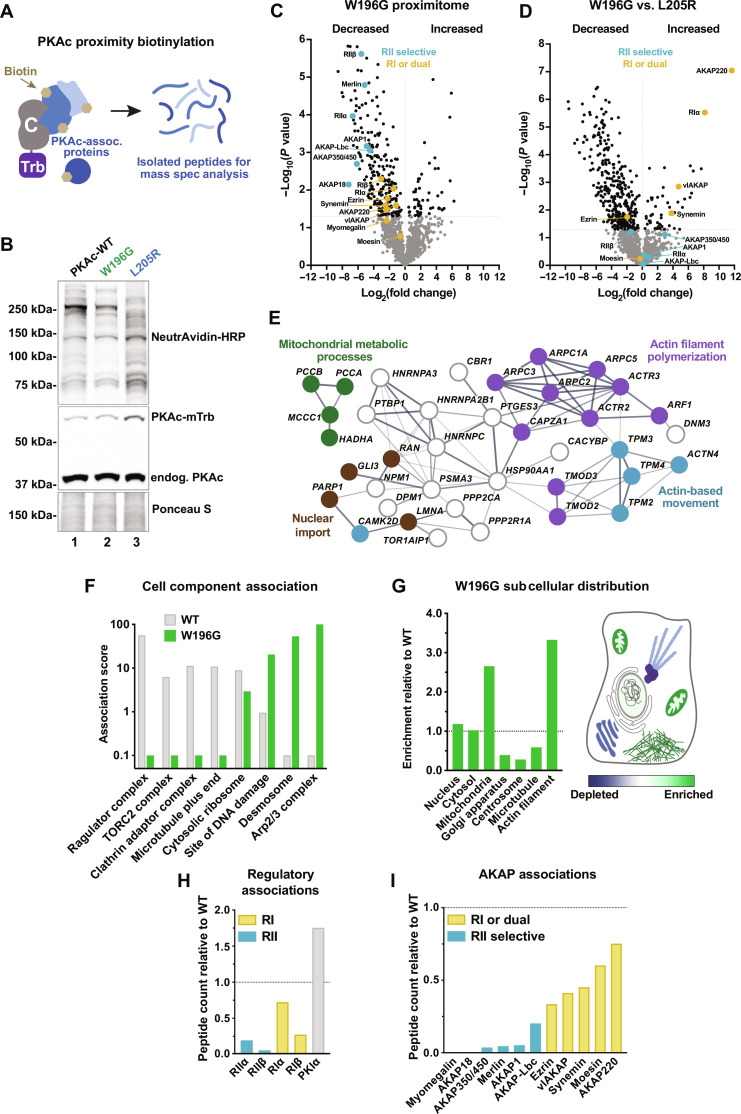
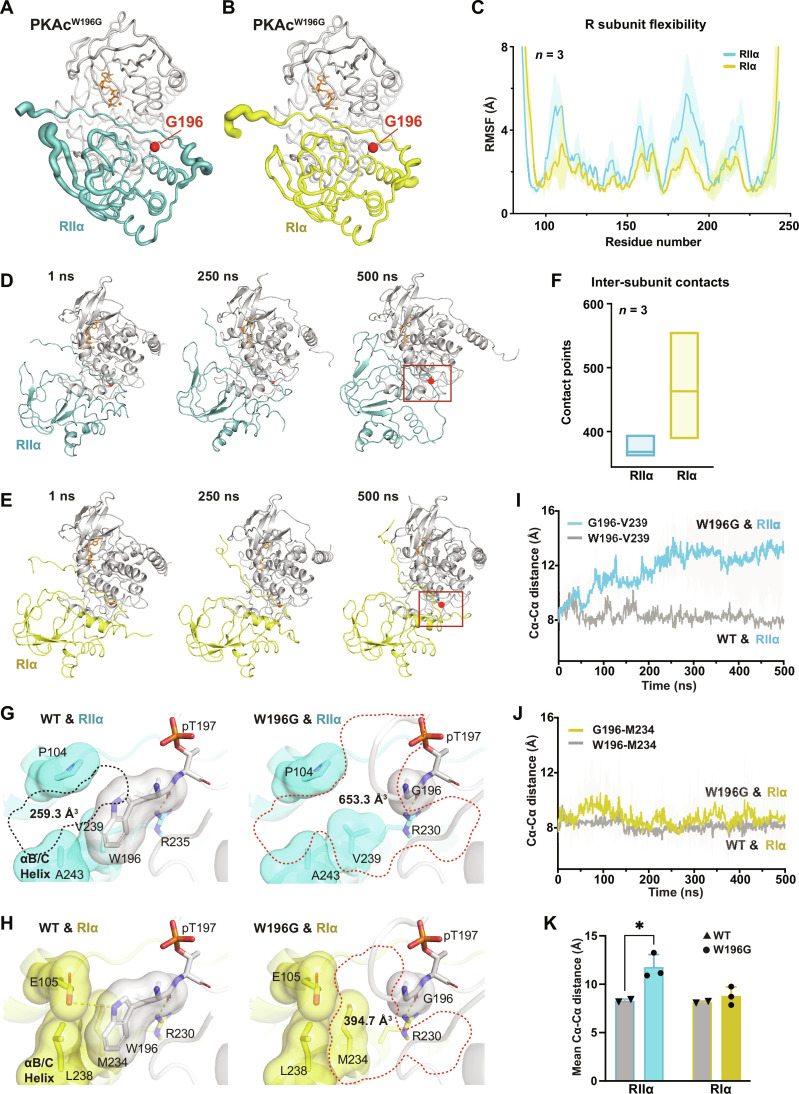
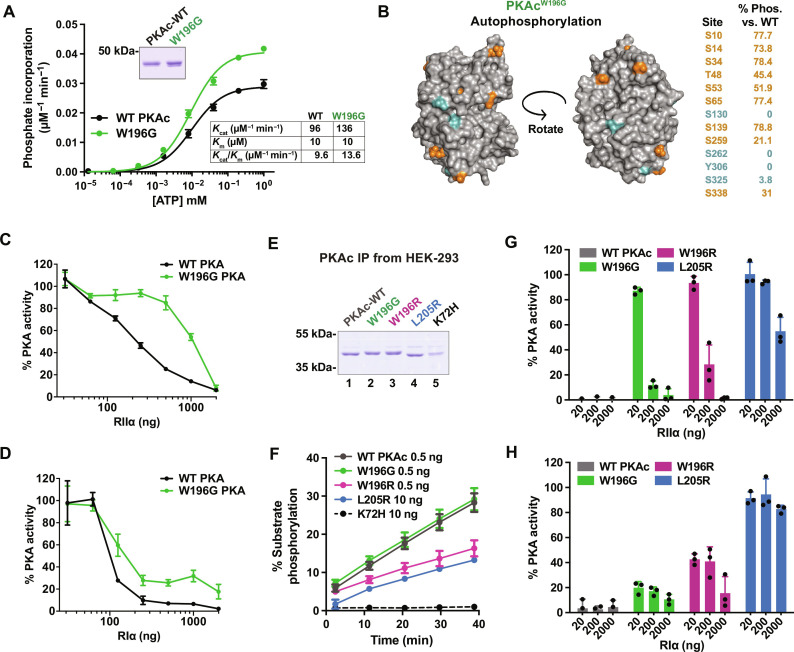
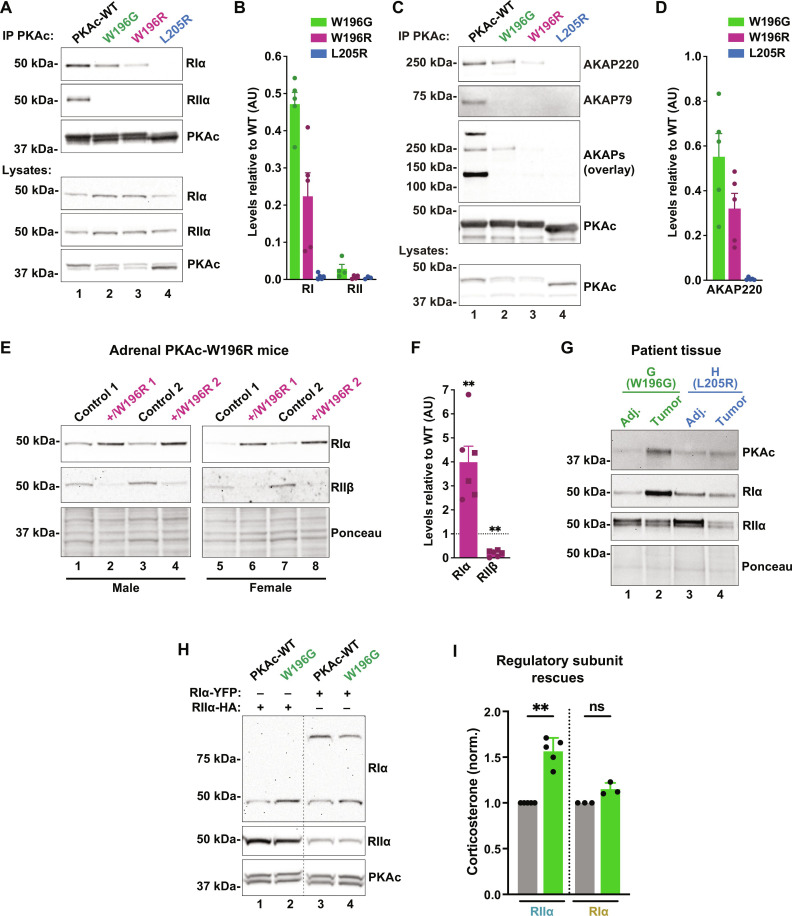
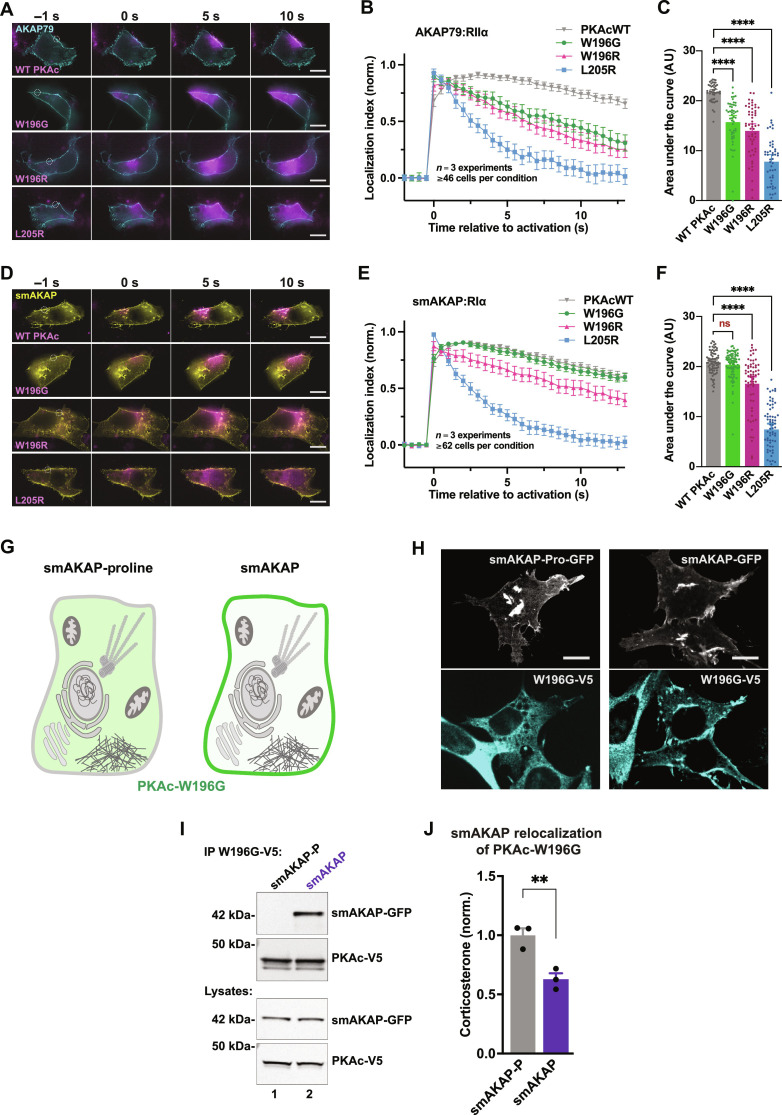
Adrenal Cushing's syndrome is a disease of cortisol hypersecretion often caused by mutations in protein kinase A catalytic subunit (PKAc). Using a personalized medicine screening platform, we discovered a Cushing's driver mutation, PKAc-W196G, in ~20% of patient samples analyzed. Proximity proteomics and photokinetic imaging reveal that PKAcW196G is unexpectedly distinct from other described Cushing's variants, exhibiting retained association with type I regulatory subunits (RI) and their corresponding A kinase anchoring proteins (AKAPs). Molecular dynamics simulations predict that substitution of tryptophan-196 with glycine creates a 653-cubic angstrom cleft between the catalytic core of PKAcW196G and type II regulatory subunits (RII), but only a 395-cubic angstrom cleft with RI. Endocrine measurements show that overexpression of RIα or redistribution of PKAcW196G via AKAP recruitment counteracts stress hormone overproduction. We conclude that a W196G mutation in the kinase catalytic core skews R subunit selectivity and biases AKAP association to drive Cushing's syndrome.


Figures

Fig. 1.
Fig. 1.. Discovery of adrenal Cushing’s syndrome mutation PKAc-W196G.
(A) Workflow for screening Cushing’s syndrome patient samples. (B) PRKACA sequencing traces (amino acids194 to 206) for normal tissue (top) and three patient tumors with PKAc missense mutations. (C) Quantitation of deep sequencing reads for the three patient tumors. Data represented as percentage from up to 300,000 reads. (D) Protein structure model detailing PKAc-W196G mutation. Glycine-196 (red) is indicated. Derived from Protein Data Bank file 6E99. (E) Immunoblot of ATC7L lysates after infection with RIIα and either wild-type (WT) PKAc (lane 1) or PKAc-W196G (lane 2). (F) ATC7L cell corticosterone measurements. Means ± SE; n = 4; **P ≤ 0.01, Student’s t test. (G) Immunoblot of H295R lysates after infection with RIIα and either WT PKAc (lane 1) or PKAc-W196G (lane 2). (H) H295R cell cortisol measurements. Means ± SE; n ≥ 5; **P ≤ 0.01, Student’s t test.
Fig. 2.
Fig. 2.. Patient tissue analyses reveal a distinct subcellular distribution of PKAcW196G.
(A to C) Patient adrenal tissue and Cushing’s adenomas stained for PKAc (magenta) and nuclei [4′,6-diamidino-2-phenylindole (DAPI), cyan]; patient G adjacent non-tumor (A), patient G tumor (B), and patient H tumor (C). Scale bars, 30 μm. (D and E) High magnification of patient tumors stained for PKAc (white) and nuclei (DAPI, blue); patient G (D), and patient H (E). Yellow dashed line represents measurements depicted in (F) and (G). Scale bars, 10 μm. (F and G) Line plot quantification of PKAc subcellular distribution. Example trace of PKAc (black) and DAPI (blue) signals versus distance. Nuclear bounds are indicated (pale blue shading); patient G, PKAcW196G (F); patient H, PKAcL205R (G). (H) Quantitation of PKAc intensity measurements, nuclear/cytosolic. Means ± SD; n ≥ 18; ****P ≤ 0.0001, Student’s t test. AU, arbitrary units. (I) Immunoprecipitation of PKI from human embryonic kidney (HEK) 293T cells expressing PKIα-HA along with V5-tagged PKAc variants: WT PKAc (lane 1), PKAc-W196G (lane 2), PKAc-W196R (lane 3), and PKAc-L205R (lane 4). Representative of three experimental replicates. (J) Inhibition of PKAc activity toward Kemptide peptide substrate relative to buffer controls for each variant upon increasing concentrations of PKI. Means ± SE; n = 3. (K) Thermostability measurements for each PKAc variant ± PKI. Experiments conducted in the presence and absence of Mg2+ adenosine 5′-triphosphate (ATP). Means ± SE; n = 3.
Fig. 3.
Fig. 3.. PKAcW196G is differentially compartmentalized in adrenal cells.
(A) Diagram depicts biotin-labeled proteins surrounding PKAc-miniTurbo in live cells and the final isolated peptides after streptavidin capture and trypsin digest. Labels: C, PKAc; Trb, miniTurbo. (B) Immunoblot of lysates from stable PKAc-miniTurbo H295R cell lines upon 48 hours of doxycycline induction and 2 hours of biotin incubation. NeutrAvidin-HRP labels biotinylated proteins. Expression of each PKAc-miniTurbo variant is indicated above each lane. Representative of four biological replicates. (C and D) Volcano plots of proximity proteomics for PKAc-W196G versus WT PKAc (C) and PKAc-W196G versus PKAc-L205R (D). Proteins underrepresented (left) and enriched (right) in the PKAcW196G proximity proteome. Gray dots indicate proteins with a corrected P value lower than 0.05. Colored dots indicate RII-selective (teal) and RI-recruiting (yellow) complex components. Data from four biological replicates. (E) STRING network depiction of proteins with increased PKAcW196G association versus WT PKAc. (F) Selected gene ontology cell component enrichment scores for highly disparate categories between WT PKAc (gray) and PKAc-W196G (green). (G) Left: PKAc-W196G gene ontology enrichment for major cell compartments and organelles relative to WT PKAc. Right: Schematic depiction of results in a prototypic cell. (H) PKAc-W196G association with PKA regulatory components relative to WT PKAc. (I) PKAc-W196G association with AKAPs relative to WT PKAc. Colors indicate likely RII-selective (teal) and RI-recruiting (yellow) AKAPs.
Fig. 4.
Fig. 4.. A mechanistic explanation for R selectivity of PKAcW196G.
(A and B) B-factor putty diagram of PKAcW196G complexed with RIIα (A) or RIα (B). Thicker lines represent higher fluctuations. ATP and magnesium ions are shown in orange. (C) Plot showing the root mean square fluctuation (RMSF) values of RIIα (teal) and RIα (yellow) subunits plotted against residue number when complexed with PKAcW196G. Fluctuations were calculated for Cα atoms over the entire trajectory. Means ± SD; n = 3 independent simulations. (D and E) Molecular dynamics (MD) time-course montages for PKAcW196G complexed with RIIα (D) and RIα (E). Red dot indicates glycine-196. Box indicates regions expanded and featured in (G) and (H). (F) Box plot showing the total number of contacts made during the 500-ns simulation between PKAc-W196G and each regulatory subunit. PyContact was used to calculate the total number of contacts. n = 3 independent simulations. (G and H) Cavities (dotted lines) at the interface between PKA catalytic and either RIIα (G) or RIα (H) regulatory subunits. Key residues at interfaces are shown as both sticks and surface representations. Polar contacts are indicated by yellow dashed lines. Cavity volumes were calculated using F pocket version 3.0. Representative of three independent replicates. (I) Plot of the Cα-Cα distance between V239 in RIIα and residue 196 in PKAc variants. PKAcW196G (teal; n = 3) experiences much greater displacement from RIIα than does the WT kinase (gray; n = 2) over 500-ns simulations. Means ± SD. (J) Plot of the Cα-Cα distance between M234 in RIα and residue 196 in PKAc variants. PKAcW196G (yellow; n = 3) experiences the same displacement as the WT kinase (gray; n = 2) over 500-ns simulations. (K) Bar graph of the 500-ns time points from (I) and (J). Means ± SE. *P ≤ 0.05, Student’s t test.
Fig. 5.
Fig. 5.. PKAcW196G is preferentially inhibited by RI subunits.
(A) Top inset: Coomassie blue–stained SDS–polyacrylamide gel electrophoresis (PAGE) of bacterially purified recombinant WT PKAc and PKAcW196G. Graph: PKA-catalyzed Kemptide phosphorylation (pmol phosphate/min per ng protein) with increasing concentrations of ATP, normalized to the maximum rate of phosphorylation for each protein. Lower inset: Kcat, Km[ATP], and Kcat/Km[ATP] determination for WT and mutant PKAc. Means ± SD; n = 4 independent experiments. (B) Structural depictions and quantification of phosphorylated sites on bacterially purified PKAcW196G as measured by quantitative MS. Orange > 21%, turquoise < 4% phosphorylation as compared to WT PKAc levels. Average data from three independent replicates. (C and D) PKAc kinase activity measurements in the presence of RIIα (C) or RIα (D) shown as % buffer control for WT PKAc (black) and PKAcW196G (green). Kinase activity measurements used Kemptide as a substrate. Means ± SD; n = 4. (E) Coomassie blue staining of SDS-PAGE showing PKAc and Cushing’s variants purified from HEK-293T cells by immunoprecipitation. (F) Real-time measurements of Kemptide phosphorylation among HEK-293T–purified PKAc variants. L205R and K72H mutants were used at 20× concentration for presentation purposes. Means ± SD; n = 3. (G and H) PKAc activity toward Kemptide relative to buffer controls for each HEK-293T–purified variant upon increasing concentrations of RIIα (G) or RIα (H). Means ± SD; n = 3.
Fig. 6.
Fig. 6.. PKAcW196G is recruited into type I AKAP complexes.
(A) Immunoprecipitation of V5-tagged PKAc variants from H295R adrenal cells demonstrating coprecipitation of RIα (top panel) and RIIα (second panel). Representative of four replicates. (B) Quantitation of immunoblot intensity for RIα (left) and RIIα (right) coimmunoprecipitation relative to WT PKAc. Means ± SE; n ≥ 4. (C) Immunoprecipitation of V5-tagged PKAc variants from H295R adrenal cells demonstrating coprecipitation of the dual-specific AKAP220 (top panel) and the RII-selective AKAP79 (second panel). Representative of four replicates. (D) Quantitation of AKAP220 coprecipitation by Cushing’s mutants relative to WT PKAc. Means ± SE; n = 5. (E) Immunoblot of RIα (top panel) and RIIβ (second panel) levels in adrenal lysates from adrenal-specific PRKACA+/W196R heterozygous mice, an animal model of adrenal Cushing’s syndrome (25). Sex-matched littermates were used as controls for male (lanes 1 to 4) and female (lanes 5 to 8) mutant mice. Ponceau S staining (bottom panel) served as a loading control. (F) Quantification of RIα and RIIβ protein levels from (E). Means ± SE; n = 6; **P ≤ 0.01, Student’s t test. (G) Immunoblot analysis of PKA Cα (top), RIα (top middle), and RIIα (bottom middle) subunit levels in adrenal tissue lysates from patients with Cushing’s syndrome. Adj, tumor-adjacent tissue. Ponceau S staining (bottom panel) served as a loading control. (H) Immunoblot of ATC7L cells virally infected with either WT or W196G PKAc and either RIα–yellow fluorescent protein (YFP) or RIIα–hemagglutinin (HA). Doublet for PKAc shows V5-tagged (top) and endogenous (bottom) kinase. Representative of at least three biological replicates. (I) Corticosterone measurements from conditions shown in (H). Excess RIα rescues hormone overproduction by PKAcW196G expressing cells. Means ± SD; n ≥ 3; **P ≤ 0.01, analysis of variance (ANOVA) with Dunn’s multiple comparisons.
Fig. 7.
Fig. 7.. Sequestrating PKAcW196G corrects cortisol overproduction.
(A to F) Type II (A) and type I (D) photoactivation time courses in H295R cells. PKAc variants tagged with photoactivatable mCherry were expressed along with either AKAP79-YFP and RIIα-iRFP [(A) to (C)] or small membrane-bound AKAP (smAKAP)–green fluorescent protein (GFP) and RIα-iRFP [(D) to (F)]. Plotting PKAc localization after photoactivation [(B) and (E)] and area under the curve [(C) and (F)] demonstrates differences among mutants. Localization index = [(intensity of activated region − background intensity)/(intensity of cytosolic region 6 to 8 μm distal − background intensity)]. Scale bars, 10 μm; means ± SE; n = 3 replicates with a total of at least 46 [(A) to (C)] and 62 [(D) to (F)] cells per condition; ****P ≤ 0.0001, one-way ANOVA with Dunnett’s correction. ns, not significant. (G) Cartoon depiction of experimental design for the PKA anchoring defective smAKAP-proline mutant (left) and smAKAP (right) sequestration experiments. Green demarks expected localization of PKAc-W196G. (H) Fluorescent images of ATC7L cells stably expressing PKAc-W196G-V5 (cyan) along with GFP-tagged constructs of either smAKAP-proline (white) or WT smAKAP (white). Scale bars, 10 μm. See also fig. S4. (I) Immunoprecipitation of PKAc-W196G from stable W196G/smAKAP-proline (lane 1) or W196G/smAKAP (lane 2) ATC7L adrenal cells. Representative of three biological replicates. (J) Corticosterone measurements from stable ATC7L cells coexpressing PKAcW196G with either smAKAP-proline (gray) or smAKAP (purple). Means ± SE; n = 3; **P ≤ 0.01, Student’s t test.

Similar articles

Cited by

References

    1. Dessauer C. W., Adenylyl cyclase–A-kinase anchoring protein complexes: The next dimension in cAMP signaling. Mol. Pharmacol. 76, 935–941 (2009). - PMC - PubMed
    1. Newton A. C., Bootman M. D., Scott J. D., Second messengers. Cold Spring Harb. Perspect. Biol. 8, a005926 (2016). - PMC - PubMed
    1. Anton S. E., Kayser C., Maiellaro I., Nemec K., Möller J., Koschinski A., Zaccolo M., Annibale P., Falcke M., Lohse M. J., Bock A., Receptor-associated independent cAMP nanodomains mediate spatiotemporal specificity of GPCR signaling. Cell 185, 1130–1142.e11 (2022). - PubMed
    1. Bock A., Annibale P., Konrad C., Hannawacker A., Anton S. E., Maiellaro I., Zabel U., Sivaramakrishnan S., Falcke M., Lohse M. J., Optical mapping of cAMP signaling at the nanometer scale. Cell 184, 2793 (2021). - PubMed
    1. Irannejad R., Tsvetanova N. G., Lobingier B. T., von Zastrow M., Effects of endocytosis on receptor-mediated signaling. Curr. Opin. Cell Biol. 35, 137–143 (2015). - PMC - PubMed

Publication types

Substances