

Different profiles of chemokines, cytokines and cell growth factors in plasma samples from patients with leprosy, leprosy reactions and households contacts
- PMID: 38381878
- PMCID: PMC10876044
- DOI: 10.1590/0074-02760230129
Different profiles of chemokines, cytokines and cell growth factors in plasma samples from patients with leprosy, leprosy reactions and households contacts
Abstract
Background: Leprosy is a highly neglected disease that is considered a serious public health problem in many countries. This illness is characterised by a variety of clinical and histopathological manifestations that are related to the patient immune response.
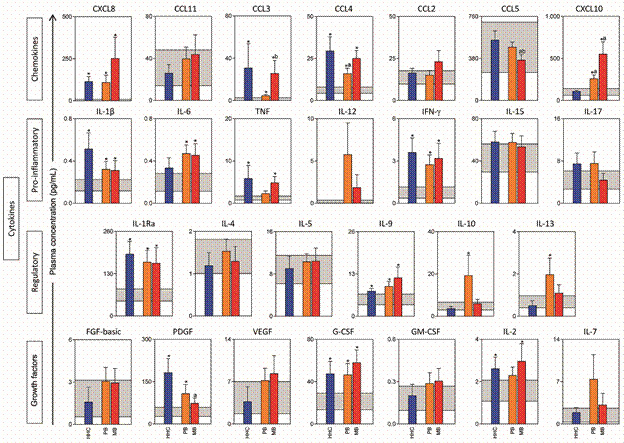
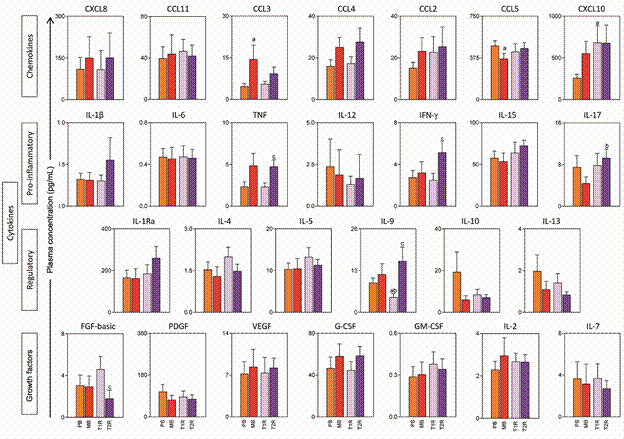
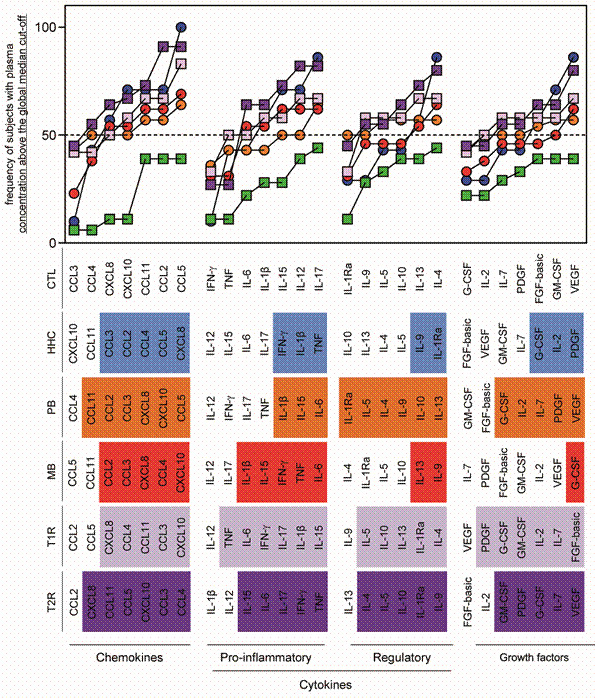
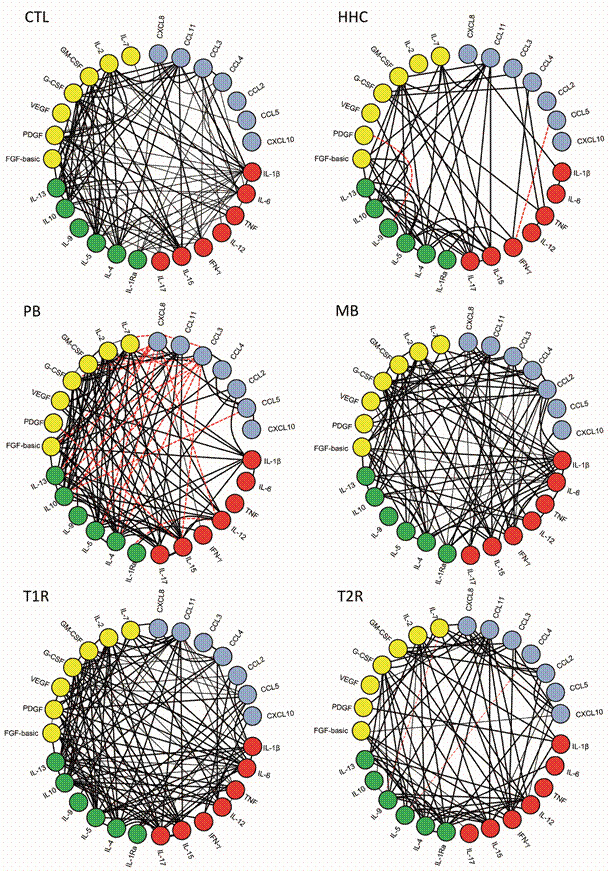
Objectives: This work aimed evaluate the profile of circulating immune mediators in the plasma from patients classified clinically as paucibacillary (PB), multibacillary (MB), households contacts (HHC), type1 leprosy reaction (T1R), type2 leprosy reaction (T2R) and control individuals without medical history of leprosy (CTL).
Methods: To assessment of the plasma immune mediators was used multiplex microbeads immunoassay "Luminex".
Findings: The results showed that patients (PB) had a regulatory-biased profile, while MB revealed a pro-inflammatory trend of highly expressed biomarkers. HHC display conspicuously increased levels in the plasma of the chemokines (CCL2, CCL3, CCL4, CCL5 and CXCL8), pro-inflammatory cytokines (IFN-γ,TNF and IL-1β), modulating cytokines (IL-9 and IL-1Ra) and growth factors (PDGF, G-CSF and IL-2). Interestingly, HHC displayed superior production of IFN-γ as compared to other leprosy groups, indicating a putative protective role for this cytokine during chronic Mycobacterium leprae exposure.
Main conclusion: Further investigations are currently underway to elucidate the potential of these mediators as biomarkers applicable to the diagnosis/prognosis of leprosy and also T1R and T2R leprosy reactions.
Figures
Similar articles
-
The landscape of chemokine and cytokine is associated with the distinct clinical status of leprosy patients and their respective household contacts.Front Immunol. 2024 Dec 18;15:1476450. doi: 10.3389/fimmu.2024.1476450. eCollection 2024. Front Immunol. 2024. PMID: 39744632 Free PMC article.
-
Interplay among differential exposure to Mycobacterium leprae and TLR4 polymorphism impacts the immune response in household contacts of leprosy patients.Front Immunol. 2023 Apr 28;14:1130137. doi: 10.3389/fimmu.2023.1130137. eCollection 2023. Front Immunol. 2023. PMID: 37187734 Free PMC article.
-
Immune mediators as plasma biomarkers for identifying household contacts and classifying clinical forms and leprosy reactions.Front Immunol. 2025 Mar 5;16:1513060. doi: 10.3389/fimmu.2025.1513060. eCollection 2025. Front Immunol. 2025. PMID: 40109344 Free PMC article.
-
CCL2 and IFN-γ serum levels as biomarkers for subclinical infection in household contacts of leprosy patients.Microb Pathog. 2021 Jan;150:104725. doi: 10.1016/j.micpath.2020.104725. Epub 2021 Jan 2. Microb Pathog. 2021. PMID: 33400985
-
Xenophagy as a Strategy for Mycobacterium leprae Elimination during Type 1 or Type 2 Leprosy Reactions: A Systematic Review.Pathogens. 2023 Dec 15;12(12):1455. doi: 10.3390/pathogens12121455. Pathogens. 2023. PMID: 38133338 Free PMC article. Review.
Cited by
-
The landscape of chemokine and cytokine is associated with the distinct clinical status of leprosy patients and their respective household contacts.Front Immunol. 2024 Dec 18;15:1476450. doi: 10.3389/fimmu.2024.1476450. eCollection 2024. Front Immunol. 2024. PMID: 39744632 Free PMC article.
References
-
- Félix-Lana FC, Lopes RF, Lanza FM, Amaral EP. Leprosy detection and human development index of cities of Minas Gerais, Brazil. Rev Eletr Enf. 2009 doi: 10.5216/ree.v11.47095. - DOI
-
- Ridley DS. The bacteriological interpretation of skin smears and biopsies in leprosy. Trans R Soc Trop Med Hyg. 1955;49:449–452. - PubMed
MeSH terms
Substances
LinkOut - more resources
Full Text Sources
Medical
Miscellaneous
