. 2024 May 8;52(8):4361-4374.
doi: 10.1093/nar/gkae124.

Pathogenic CANVAS (AAGGG)n repeats stall DNA replication due to the formation of alternative DNA structures

Affiliations

Pathogenic CANVAS (AAGGG)n repeats stall DNA replication due to the formation of alternative DNA structures

Julia A Hisey et al. Nucleic Acids Res. .

Abstract

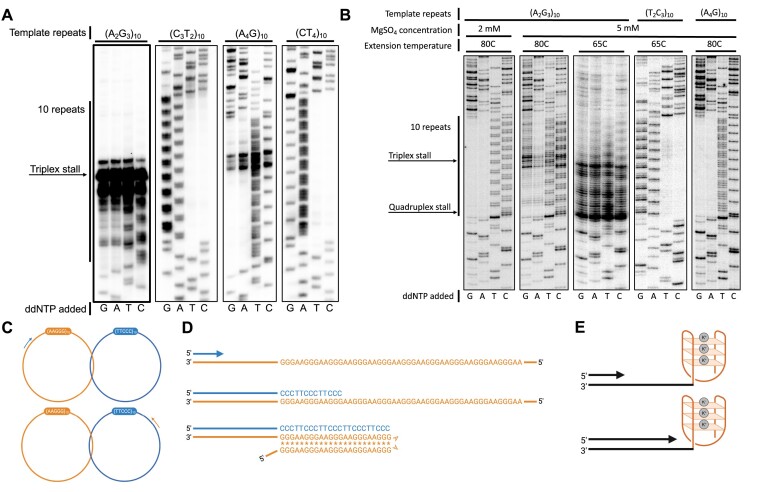
CANVAS is a recently characterized repeat expansion disease, most commonly caused by homozygous expansions of an intronic (A2G3)n repeat in the RFC1 gene. There are a multitude of repeat motifs found in the human population at this locus, some of which are pathogenic and others benign. In this study, we conducted structure-functional analyses of the pathogenic (A2G3)n and nonpathogenic (A4G)n repeats. We found that the pathogenic, but not the nonpathogenic, repeat presents a potent, orientation-dependent impediment to DNA polymerization in vitro. The pattern of the polymerization blockage is consistent with triplex or quadruplex formation in the presence of magnesium or potassium ions, respectively. Chemical probing of both repeats in vitro reveals triplex H-DNA formation by only the pathogenic repeat. Consistently, bioinformatic analysis of S1-END-seq data from human cell lines shows preferential H-DNA formation genome-wide by (A2G3)n motifs over (A4G)n motifs. Finally, the pathogenic, but not the nonpathogenic, repeat stalls replication fork progression in yeast and human cells. We hypothesize that the CANVAS-causing (A2G3)n repeat represents a challenge to genome stability by folding into alternative DNA structures that stall DNA replication.


Figures

Graphical Abstract
Graphical Abstract
Figure 1.
Figure 1.
Thermo Sequenase and Vent (exo-) polymerases stall during polymerization through the pathogenic (A2G3)10 repeat in vitro. (A) Sequencing reaction by Thermo Sequenase stalls in the middle of the pathogenic (A2G3)10 repeats when they serve as the template strand. Polyacrylamide gel electrophoresis separation of Thermo Sequenase sequencing reactions performed as described in Materials and Methods. Briefly, 5 μg of each plasmid and 0.5 pmol of primer were denatured and pre-annealed and the USBio Thermo Sequenase Cycle Sequencing Kit's 3′-dNTP internal label cycling sequencing instructions were followed. Radioactive labeling was performed at 60°C for 30 s and primer extension reactions were performed at 72°C for 5 min. (B) Sequencing reaction by Vent polymerase stalls at the beginning or middle of the pathogenic (A2G3)10 repeats, depending on surrounding ions, when they serve as the template strand. Polyacrylamide gel electrophoresis separation of Vent sequencing reactions were performed as described in Materials and Methods. Briefly, 5 μg of each plasmid and 0.5 pmol of primer were denatured and pre-annealed, radioactive labeling was carried out at 60°C for 30 s, and primer extension was carried out at 65 or 80°C for 5 min. (C) Schematic of denatured, intertwined double-stranded plasmid with primers annealed to allow for primer extension reactions through the purine- or pyrimidine-rich strand of (A2G3)10 or (A4G)10 in the template strand. Primers are 98 base pairs or 75 base pairs away from repeats for the purine-rich or pyrimidine-rich template, respectively. Created with BioRender. (D) Model for triplex formation as polymerase progresses through the repeats with the purine-rich strand as the template. Created with BioRender. (E) Model for G-quadruplex formation as the polymerase reaches the beginning of the repeats with the purine-rich strand as the template. Created with BioRender.
Figure 2.
Figure 2.
Potassium permanganate probing of pathogenic and nonpathogenic repeats reveals H-r3 formation by the (A2G3)10 repeat. (A) Polyacrylamide gel electrophoresis separation of sequencing reactions and primer extension reactions on potassium permanganate- or water-treated repeat-containing plasmids using the pyrimidine-rich strand as a template. 5 μg of repeat-containing supercoiled DNA was incubated in 10 mM Tris–HCl pH 7.5, 2 mM MgCl2 buffer with either 6 mM KMnO4 or the same volume of water for 2 min at 37°C. The reaction was quenched, resuspended in water, and used as a template for primer extension as described in the Materials and Methods. The Thermo Sequenase sequencing reactions alongside were performed as described in Figure 1. (B) H-r3 triplex predicted from chemical probing for (A2G3)10 repeats. (C) DNA unwinding element (DUE) predicted from chemical probing for (A4G)10 repeats. Purple stars in (B) and (C) represent possible KMnO4 modification sites. Created with BioRender.
Figure 3.
Figure 3.
Triplex-formation in (A2G3)n repeats genome-wide in human cells. S1-END-seq data from Matos-Rodrigues et al. 2022 (28) were used for these analyses. (A) Comparison of pathogenic (A2G3)n and (A4G)n motifs genome-wide. Overlapping S1-END-seq peak genomic coordinates from the five cell lines were combined into non-overlapping peaks and the coordinates converted to GRCh38. A set of control coordinates were randomly generated, matching the number of S1-END-seq peaks in total number, length of each peak, and proportion on each chromosome. S1-END-seq peaks and control coordinates were compared to a previously generated repetitive sequence database (33). For each category or subtype of repeat, the proportion of those falling within 100 nucleotides of the S1-END-seq peaks or control coordinates was calculated for each repeat length and graphed on the Y-axis. Best-fit line and R2 value produced using R. Top: graph depicting the percentage of repeats found within 100 nucleotides of S1-END-seq peaks as the repeat length increases. Bottom: graph depicting the number of repeat sequences of each repeat length as the repeat length increases. The X-axis of the upper and lower panel of each graph is the repeat length. Comparison of distributions along repeat lengths were made by Wilcoxon signed-rank test, restricted to length bins containing at least three repeats, P< 2.7 × 10−7. The test was applied via the Scipy package in Python (https://docs.scipy.org/doc/scipy/reference/generated/scipy.stats.wilcoxon.html#scipy.stats.wilcoxon). (B) S1-END-seq peaks from Matos-Rodrigues et al. (28) that overlap with (A2G3)n repeats annotated in hg19 human genome in asynchronous or G1-arrested (via CDK4/6 inhibitor Palbociclib 10mM for 24 h) KM12 cells. Data and experimental methods can be found in Matos-Rodrigues et al. (28). RPKM = reads per kilobase per million mapped reads. KM12 cells were compared using the Mann–Whitney U test, **** P< 0.0001. (C) Representation of S1 nuclease cleavage of triplex H-DNA, yielding one double-stranded end available for sequencing adapter ligation and one triple-stranded end that is unavailable for sequencing adaptor ligation. The red line indicates the homopurine strand, while the blue line indicates the homopyrimidine strand of an H-r triplex, although the same end products would exist for an H-y triplex.
Figure 4.
Figure 4.
Analysis of yeast replication intermediates using two-dimensional gel electrophoresis demonstrates orientation-dependent stalling at (A2G3)60 repeats. Details of replication intermediate collection and two-dimensional gel electrophoresis are described in Materials and Methods. Repeats were placed on the descending arm of the Y-arc. (A) Representative gels of the no repeat control, (A2G3)60, (C3T2)60 and (A4G)60 in the lagging strand template of replication in yeast from the yeast 2μ origin of replication. Three replicates were performed per repeat or orientation. The red arrow indicates replication fork stalling where the repeats are predicted to fall on the Y-arc. The blue arrow indicates the X-spot along the X-line. 1n, 1.5n and 2n mark replication intermediates at the beginning (1n), middle (1.5n) and end (2n) of replication. (B) Densitometry profiles along the arc starting from the 1.5n spot to the 2n spot. A custom script was used to plot these profiles (24). The density of the stall spot compared with the density along the Y-arc as well as the density of the background above and below the arc were graphed and used for quantification as described in Materials and Methods and shown in Supplementary Figure S7. (C) Quantification of replication fork slowing via area analysis. Error bars represent standard error of the mean. The signal of the stall over the arc intensity was compared using unpaired t-test with Welch's correction, P< 0.0212. Graph and statistical analysis performed using prism.
Figure 5.
Figure 5.
Analysis of human cell replication intermediates using two-dimensional gel electrophoresis demonstrates orientation-dependent stalling at (A2G3)60 repeats. Details of replication intermediate collection and two-dimensional gel electrophoresis are described in Materials and methods. Repeats are placed on the ascending arm of the Y-arc. (A) Representative gels of the no repeat control, (A2G3)60, (C3T2)60 and (A4G)60 in the lagging strand template of replication from the SV40 origin of replication. Three replicates were performed per repeat orientation. The red arrow indicates replication fork stalling where the repeats are predicted to fall on the Y-arc. 1n, 1.5n and 2n mark replication intermediates at the beginning (1n), middle (1.5n) and end (2n) of replication. (B) Densitometry profiles along the arc starting at the 1n spot to the 1.5n spot. A custom script was used to plot these profiles (24). The density of the stall spot compared with the density along the Y-arc as well as the density of the background above and below the arc were graphed and used for quantification as described in Materials and Methods and shown in Supplementary Figure S7. (C) Quantification of replication fork slowing via area analysis. Error bars represent standard error of the mean. The signal of the stall over the arc intensity was compared using Welch's ANOVA test with Dunnett's multiple comparisons, (A2G3)60 versus (C3T2)60P< 0.0005, (A2G3)60 versus (A4G)60P< 0.0016. Graph and statistical analysis performed using prism.
Figure 6.
Figure 6.
Analysis of human cell replication intermediates using two-dimensional gel electrophoresis demonstrates fork reversal at (A2G3)60 repeats. Details of replication intermediate collection and two-dimensional gel electrophoresis are described in Materials and Methods. Repeats are placed on the descending arm of the Y-arc. Representative gel of (A2G3)60 in the lagging strand template of replication from the SV40 origin of replication. Red arrow = replication fork stalling replication intermediates at the repeats on the Y-arc. Purple arrow = replication fork reversal intermediates. Blue arrow = cone structure with converging replication fork intermediates.

Update of

References

    1. Cortese A., Simone R., Sullivan R., Vandrovcova J., Tariq H., Yau W.Y., Humphrey J., Jaunmuktane Z., Sivakumar P., Polke J.et al. .. Biallelic expansion of an intronic repeat in RFC1 is a common cause of late-onset ataxia. Nat. Genet. 2019; 51:649–658. - PMC - PubMed
    1. Rafehi H., Szmulewicz D.J., Bennett M.F., Sobreira N.L.M., Pope K., Smith K.R., Gillies G., Diakumis P., Dolzhenko E., Eberle M.A.et al. .. Bioinformatics-based identification of expanded repeats: a non-reference intronic pentamer expansion in RFC1 causes CANVAS. Am. J. Hum. Genet. 2019; 105:151–165. - PMC - PubMed
    1. Arteche-López A., Avila-Fernandez A., Damian A., Soengas-Gonda E., de la Fuente R.P., Gómez P.R., Merlo J.G., Burgos L.H., Fernández C.C., Rosales J.M.L.et al. .. New Cerebellar Ataxia, Neuropathy, Vestibular Areflexia Syndrome cases are caused by the presence of a nonsense variant in compound heterozygosity with the pathogenic repeat expansion in the RFC1 gene. Clin. Genet. 2023; 103:236–241. - PubMed
    1. Cortese A., Curro’ R., Vegezzi E., Yau W.Y., Houlden H., Reilly M.M. Cerebellar ataxia, neuropathy and vestibular areflexia syndrome (CANVAS): genetic and clinical aspects. Pract. Neurol. 2022; 22:14–18. - PubMed
    1. Cortese A., Tozza S., Yau W.Y., Rossi S., Beecroft S.J., Jaunmuktane Z., Dyer Z., Ravenscroft G., Lamont P.J., Mossman S.et al. .. Cerebellar ataxia, neuropathy, vestibular areflexia syndrome due to RFC1 repeat expansion. Brain. 2020; 143:480–490. - PMC - PubMed

Publication types