. 2024 May 15;84(10):1659-1679.
doi: 10.1158/0008-5472.CAN-23-2521.

PABPC1L Induces IDO1 to Promote Tryptophan Metabolism and Immune Suppression in Renal Cell Carcinoma

Affiliations

PABPC1L Induces IDO1 to Promote Tryptophan Metabolism and Immune Suppression in Renal Cell Carcinoma

Guannan Shu et al. Cancer Res. .

Abstract

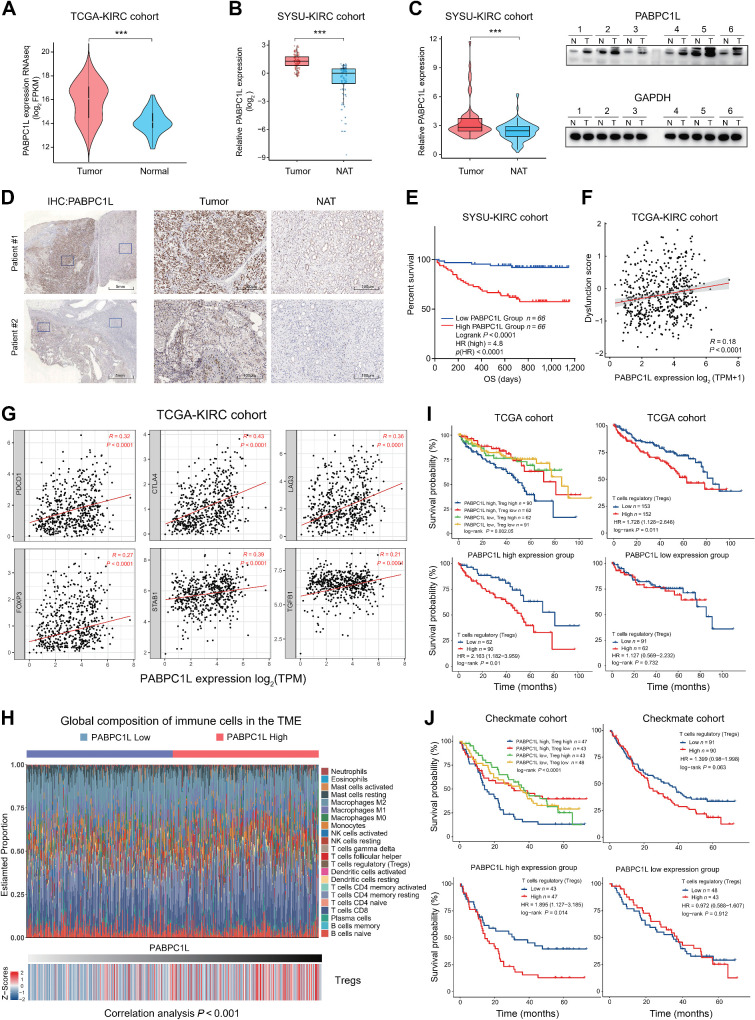
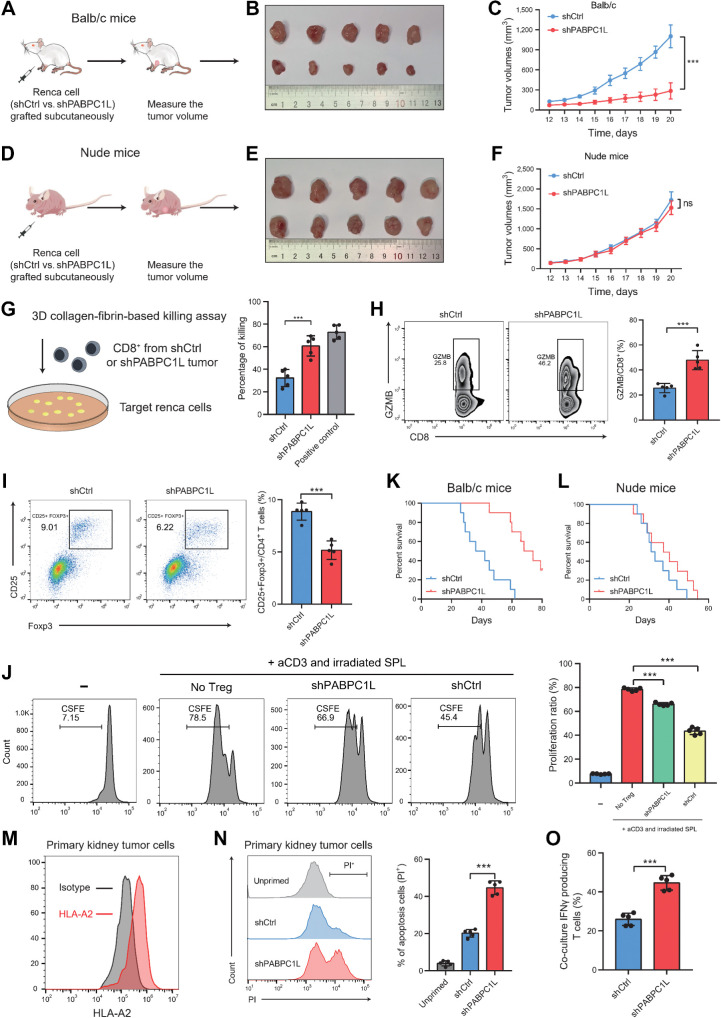
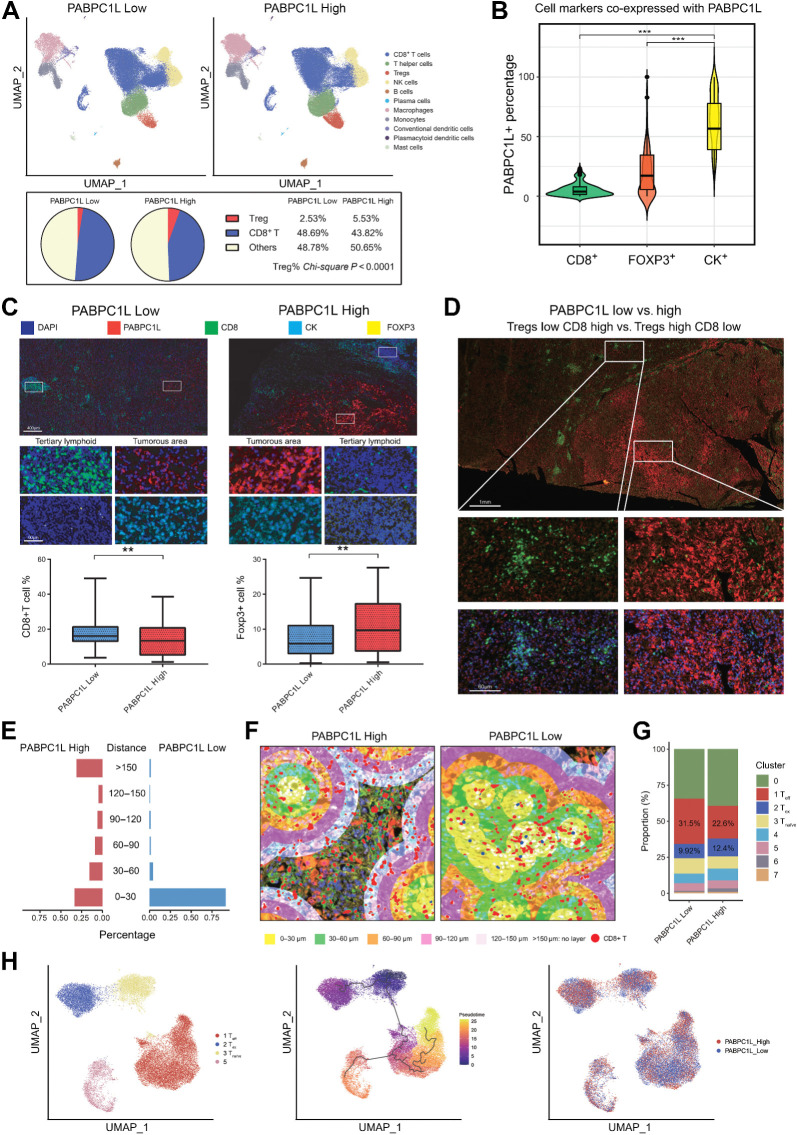
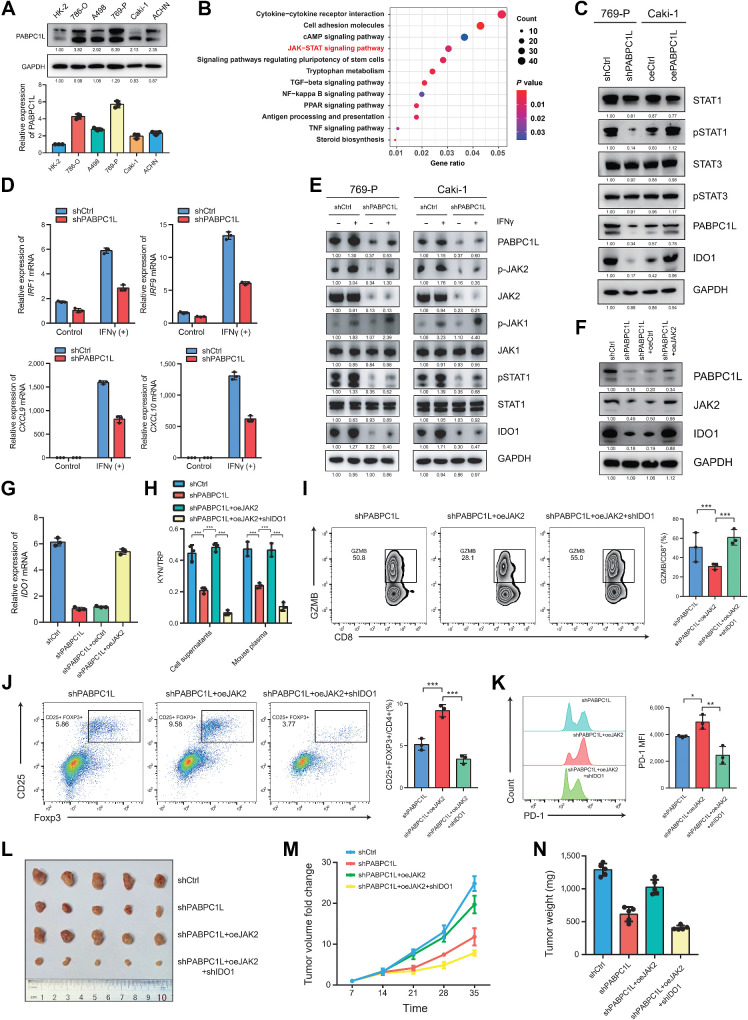
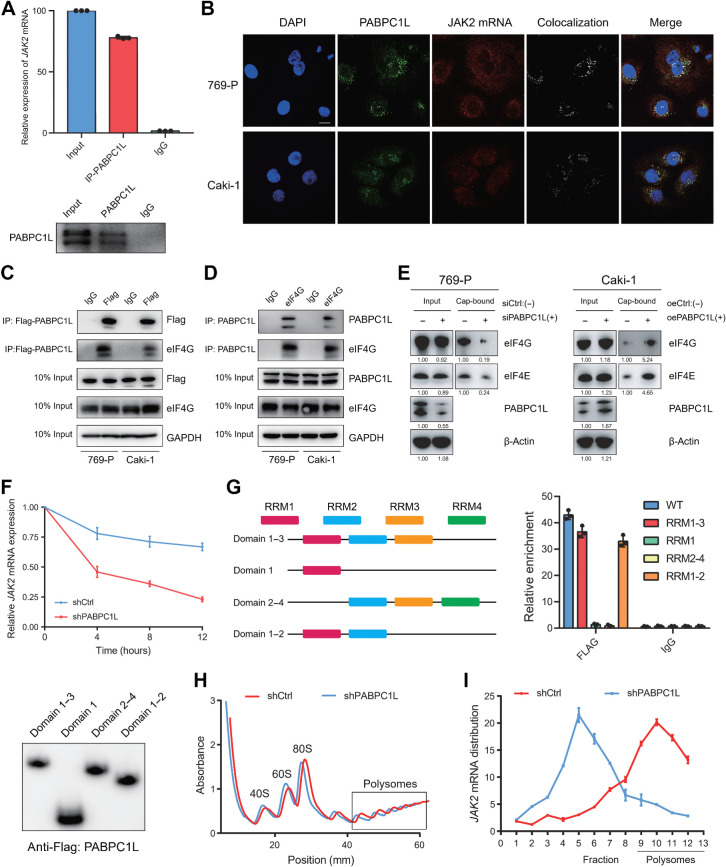
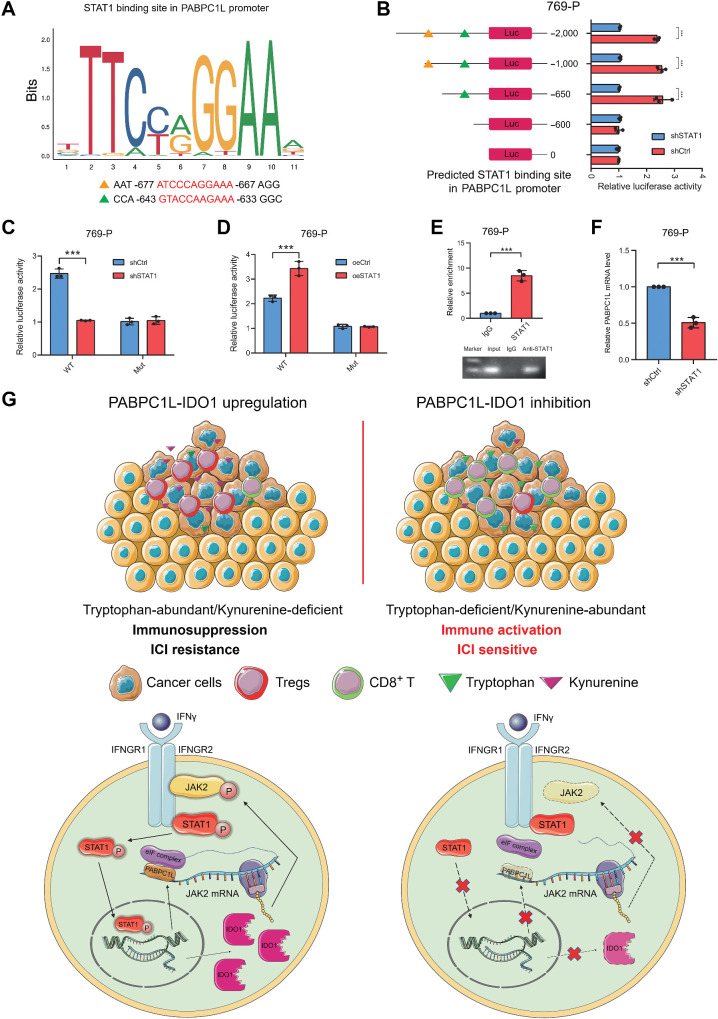
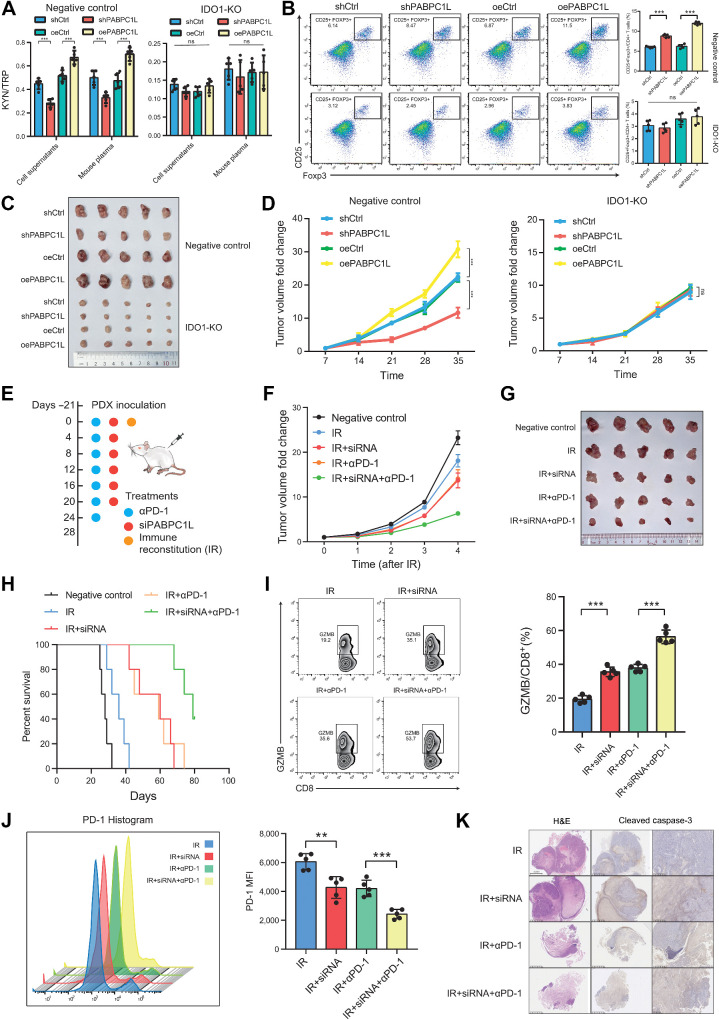
The tumor microenvironment (TME) in renal cell carcinomas (RCC) is marked by substantial immunosuppression and immune resistance despite having extensive T-cell infiltration. Elucidation of the mechanisms underlying immune evasion could help identify therapeutic strategies to boost the efficacy of immune checkpoint blockade (ICB) in RCC. This study uncovered a mechanism wherein the polyadenylate-binding protein PABPC1L modulates indoleamine 2,3-dioxygenase 1 (IDO1), a prospective target for immunotherapy. PABPC1L was markedly upregulated in RCC, and high PABPC1L expression correlated with unfavorable prognosis and resistance to ICB. PABPC1L bolstered tryptophan metabolism by upregulating IDO1, inducing T-cell dysfunction and Treg infiltration. PABPC1L enhanced the stability of JAK2 mRNA, leading to increased JAK2-STAT1 signaling that induced IDO1 expression. Additionally, PABPC1L-induced activation of the JAK2-STAT1 axis created a positive feedback loop to promote PABPC1L transcription. Conversely, loss of PABPC1L diminished IDO1 expression, mitigated cytotoxic T-cell suppression, and enhanced responsiveness to anti-PD-1 therapy in patient-derived xenograft models. These findings reveal the crucial role of PABPC1L in facilitating immune evasion in RCC and indicate that inhibiting PABPC1L could be a potential immunotherapeutic approach in combination with ICB to improve patient outcomes.

Significance: PABPC1L functions as a key factor in renal cell carcinoma immune evasion, enhancing IDO1 and impeding T-cell function, and represents a potential target to enhance the efficacy of immune checkpoint blockade therapy.


Figures

Figure 1. PABPC1L is upregulated in RCC and is correlated with immunosuppression in RCC. A, PABPC1L mRNA levels in RCC tumor tissues and normal tissues from TCGA database. B, Relative RNA expression of PABPC1L in human RCC tumors (T) and matched normal adjacent tissues (NAT) according to qRT-PCR in SYSU-KIRC cohort. C, Representative Western blot (right) and statistical analysis (left) of PABPC1L protein expression levels in SYSU-KIRC cohort. D, Representative IHC images showing the expression of PABPC1L in tumors and matched normal adjacent tissues. E, OS of patients with RCC with low (n = 66) or high (n = 66) PABPC1L expression in SYSU-KIRC cohort. F, TIDE analysis revealed that PABPC1L was positively associated with immune dysfunction score in TCGA-KIRC dataset. G, PABPC1L was positively associated with inhibitory checkpoints, Treg marker and M2 tumor-associated macrophage markers according to TCGA database. H, PABPC1L expression group and proportions of TME cells for 305 patients in TCGA-KIRC cohort and the elevated infiltration level of Tregs upon higher expression of PABPC1L. I, OS of patients with RCC in the TCGA-KIRC cohort, stratified by both PABPC1L expression and Treg infiltration. J, OS of patients with RCC in the Checkmate cohort, stratified by both PABPC1L expression and Treg infiltration. ***, P < 0.001.
Figure 1.
PABPC1L is upregulated in RCC and is correlated with immunosuppression in RCC. A,PABPC1L mRNA levels in RCC tumor tissues and normal tissues from TCGA database. B, Relative RNA expression of PABPC1L in human RCC tumors (T) and matched normal adjacent tissues (NAT) according to qRT-PCR in SYSU-KIRC cohort. C, Representative Western blot (right) and statistical analysis (left) of PABPC1L protein expression levels in SYSU-KIRC cohort. D, Representative IHC images showing the expression of PABPC1L in tumors and matched normal adjacent tissues. E, OS of patients with RCC with low (n = 66) or high (n = 66) PABPC1L expression in SYSU-KIRC cohort. F, TIDE analysis revealed that PABPC1L was positively associated with immune dysfunction score in TCGA-KIRC dataset. G,PABPC1L was positively associated with inhibitory checkpoints, Treg marker and M2 tumor-associated macrophage markers according to TCGA database. H,PABPC1L expression group and proportions of TME cells for 305 patients in TCGA-KIRC cohort and the elevated infiltration level of Tregs upon higher expression of PABPC1L. I, OS of patients with RCC in the TCGA-KIRC cohort, stratified by both PABPC1L expression and Treg infiltration. J, OS of patients with RCC in the Checkmate cohort, stratified by both PABPC1L expression and Treg infiltration. ***, P < 0.001.
Figure 2. PABPC1L deficiency improves antitumor immunity in murine and human RCC. A and D, Schematic of Renca cells with/without PABPC1L knockdown subcutaneously injected into BALB/c (A) and nude (D) mice. B and C, Images of tumors (B) and growth curves (C) in BALB/c mice (n = 5/group). E and F, Tumor images (E) and growth curves (F) in nude mice (n = 5/group). G, Schematic of the experimental setup for the 3D collagen-fibrin gel killing assay (left) and quantification of target cell killing by tumor-isolated CD8+ T cells or tumor antigen–specific CD8+ T cells (right). H, Flow cytometry analysis of GZMB in CD8+ T cells isolated from indicated Renca tumors in BALB/c mice. I, Flow cytometric analysis of Foxp3 expression in tumor-infiltrating CD4+ populations isolated from indicated Renca tumors in BALB/c mice. J, In vitro suppressive activity of tumor-isolated Tregs isolated from shPABPC1L or shCtrl mice. Left, representative histograms of CD8+ T-cell proliferation. Right, FACS quantification of T-cell proliferation. K and L, Survival curves of BALB/c (K) and nude (L) mice with Renca cells (n = 10/group). M, Flow cytometry analysis of HLA-A2 expression in primary kidney tumor cells. N, Representative flow cytometry histograms (left) and statistical analysis (right) of apoptosis rate (PI+) of primary kidney tumor cells with or without PABPC1L knockdown cocultured with primary kidney tumor-specific CD8+ T cells. O, The proportion of IFNγ-producing T cells in shPABPC1L or shCtrl samples. A–F, Data represent one independent experiment with 5 mice per group. G, Data are representative of five independent experiments. H–J, Each experiment was repeated three times with 5 mice per group, and data shown are the representative group of three independent experiments. K and L, Data represent one independent experiment with 10 mice per group. N and O, Data represent five independent biological replicates. ***, P < 0.001.
Figure 2.
PABPC1L deficiency improves antitumor immunity in murine and human RCC. A and D, Schematic of Renca cells with/without PABPC1L knockdown subcutaneously injected into BALB/c (A) and nude (D) mice. B and C, Images of tumors (B) and growth curves (C) in BALB/c mice (n = 5/group). E and F, Tumor images (E) and growth curves (F) in nude mice (n = 5/group). G, Schematic of the experimental setup for the 3D collagen-fibrin gel killing assay (left) and quantification of target cell killing by tumor-isolated CD8+ T cells or tumor antigen–specific CD8+ T cells (right). H, Flow cytometry analysis of GZMB in CD8+ T cells isolated from indicated Renca tumors in BALB/c mice. I, Flow cytometric analysis of Foxp3 expression in tumor-infiltrating CD4+ populations isolated from indicated Renca tumors in BALB/c mice. J,In vitro suppressive activity of tumor-isolated Tregs isolated from shPABPC1L or shCtrl mice. Left, representative histograms of CD8+ T-cell proliferation. Right, FACS quantification of T-cell proliferation. K and L, Survival curves of BALB/c (K) and nude (L) mice with Renca cells (n = 10/group). M, Flow cytometry analysis of HLA-A2 expression in primary kidney tumor cells. N, Representative flow cytometry histograms (left) and statistical analysis (right) of apoptosis rate (PI+) of primary kidney tumor cells with or without PABPC1L knockdown cocultured with primary kidney tumor-specific CD8+ T cells. O, The proportion of IFNγ-producing T cells in shPABPC1L or shCtrl samples. AF, Data represent one independent experiment with 5 mice per group. G, Data are representative of five independent experiments. HJ, Each experiment was repeated three times with 5 mice per group, and data shown are the representative group of three independent experiments. K and L, Data represent one independent experiment with 10 mice per group. N and O, Data represent five independent biological replicates. ***, P < 0.001.
Figure 3. Effect of RCC PABPC1L expression in Tregs infiltration at single-cell resolution and Tregs spatial distribution in the TME. A, Top, UMAP plots of tumor-infiltrating immune cells in tumor tissues with high or low expression of PABPC1L. Bottom, distribution of tumor-infiltrating immune cell clusters across tumor tissues with high or low expression of PABPC1L. B, Cell markers coexpressed with PABPC1L+ cells. C, Multiplex IF detected the infiltration levels of Tregs and CD8+ T cells in tumor tissues from patients with high or low PABPC1L expression. Scale bars, 400 or 60 μm. D, The level of infiltration of CD8+ T in the high expression region of PABPC1L was significantly different from that in the low expression region. Scale bars, 1 mm or 60 μm. E, Statistical analysis of CD8+ T cells spatial distribution in tumor tissues with high and low expression of PABPC1L. F, Representative spatial distribution scatterplots of CD8+ T cells in tumor tissues with high and low expression of PABPC1L. G, Percentage distribution of T-cell clusters in tumor tissues with high or low expression of PABPC1L. H, The potential developmental trajectory of T-cell clusters in TME. Each dot represents a single cell, colored according to clusters (left), pseudotime (middle), or PABPC1L expression group. **, P < 0.01; ***, P < 0.001.
Figure 3.
Effect of RCC PABPC1L expression in Tregs infiltration at single-cell resolution and Tregs spatial distribution in the TME. A, Top, UMAP plots of tumor-infiltrating immune cells in tumor tissues with high or low expression of PABPC1L. Bottom, distribution of tumor-infiltrating immune cell clusters across tumor tissues with high or low expression of PABPC1L. B, Cell markers coexpressed with PABPC1L+ cells. C, Multiplex IF detected the infiltration levels of Tregs and CD8+ T cells in tumor tissues from patients with high or low PABPC1L expression. Scale bars, 400 or 60 μm. D, The level of infiltration of CD8+ T in the high expression region of PABPC1L was significantly different from that in the low expression region. Scale bars, 1 mm or 60 μm. E, Statistical analysis of CD8+ T cells spatial distribution in tumor tissues with high and low expression of PABPC1L. F, Representative spatial distribution scatterplots of CD8+ T cells in tumor tissues with high and low expression of PABPC1L. G, Percentage distribution of T-cell clusters in tumor tissues with high or low expression of PABPC1L. H, The potential developmental trajectory of T-cell clusters in TME. Each dot represents a single cell, colored according to clusters (left), pseudotime (middle), or PABPC1L expression group. **, P < 0.01; ***, P < 0.001.
Figure 4. Loss of PABPC1L impairs JAK-STAT-IDO1 pathway in RCC. A, Representative Western blot (top) and statistical analysis (bottom) in the immortalized HK-2 renal epithelial cell line and RCC cell lines. GAPDH was used as a loading control. B, KEGG analysis showed the significantly altered signaling pathways after PABPC1L silencing in RCC cells. C, Representative Western blot analysis of STAT1, STAT3, pSTAT1, and pSTAT3 protein expression levels in 769-P cells with PABPC1L knockdown (left) and in Caki-1 cells with PABPC1L overexpression (right). D, mRNA expression of JAK-STAT1 target genes in shCtrl and shPABPC1L 769-P cells with or without IFNγ stimulation. Cells were treated with 100 U/mL IFNγ. E, Representative Western blot analysis showing JAK1, p-JAK1, JAK2, p-JAK2, STAT1, pSTAT1, and IDO1 protein expression levels in 769-P (left) and Caki-1 (right) cells with PABPC1L knockdown. Cells were stimulated with or without 100 U/mL IFNγ. F, Effects of JAK2 overexpression on IDO1 protein expression in shCtrl and shPABPC1L 769-P cells. G, Effects of JAK2 overexpression on IDO1 mRNA expression in shCtrl and shPABPC1L 769-P cells. A–G, All experiments were performed with three independent biological replicates, and data shown are representative of three independent experiments. H, Differently treated cells were cultured for 24 hours without KYNU treatment. KYN and TRP levels in cell supernatants were determined by ELISA. Differently treated cells were injected subcutaneously into BALB/c mice. HPLC/MS-MS analysis was used to generate the TRP metabolomic profiles of mouse plasma, and the KYN/TRP ratio in the mouse plasma was calculated. I, Flow cytometry analysis of GZMB+ in CD8+ T cells. J, Flow cytometry analysis of CD25+ and Foxp3+ Tregs in CD4+ T cells. K, Representative flow cytometry histograms and statistical analysis of cell surface PD-1 with the indicated treatments. L and M, Representative images of tumors (L) and growth curves (M) of indicated Renca tumors in BALB/c mice (n = 5 per group). N, Tumor weight measured after surgical dissection (n = 5 per group). *, P < 0.05; **, P < 0.01; ***, P < 0.001.
Figure 4.
Loss of PABPC1L impairs JAK-STAT-IDO1 pathway in RCC. A, Representative Western blot (top) and statistical analysis (bottom) in the immortalized HK-2 renal epithelial cell line and RCC cell lines. GAPDH was used as a loading control. B, KEGG analysis showed the significantly altered signaling pathways after PABPC1L silencing in RCC cells. C, Representative Western blot analysis of STAT1, STAT3, pSTAT1, and pSTAT3 protein expression levels in 769-P cells with PABPC1L knockdown (left) and in Caki-1 cells with PABPC1L overexpression (right). D, mRNA expression of JAK-STAT1 target genes in shCtrl and shPABPC1L 769-P cells with or without IFNγ stimulation. Cells were treated with 100 U/mL IFNγ. E, Representative Western blot analysis showing JAK1, p-JAK1, JAK2, p-JAK2, STAT1, pSTAT1, and IDO1 protein expression levels in 769-P (left) and Caki-1 (right) cells with PABPC1L knockdown. Cells were stimulated with or without 100 U/mL IFNγ. F, Effects of JAK2 overexpression on IDO1 protein expression in shCtrl and shPABPC1L 769-P cells. G, Effects of JAK2 overexpression on IDO1 mRNA expression in shCtrl and shPABPC1L 769-P cells. AG, All experiments were performed with three independent biological replicates, and data shown are representative of three independent experiments. H, Differently treated cells were cultured for 24 hours without KYNU treatment. KYN and TRP levels in cell supernatants were determined by ELISA. Differently treated cells were injected subcutaneously into BALB/c mice. HPLC/MS-MS analysis was used to generate the TRP metabolomic profiles of mouse plasma, and the KYN/TRP ratio in the mouse plasma was calculated. I, Flow cytometry analysis of GZMB+ in CD8+ T cells. J, Flow cytometry analysis of CD25+ and Foxp3+ Tregs in CD4+ T cells. K, Representative flow cytometry histograms and statistical analysis of cell surface PD-1 with the indicated treatments. L and M, Representative images of tumors (L) and growth curves (M) of indicated Renca tumors in BALB/c mice (n = 5 per group). N, Tumor weight measured after surgical dissection (n = 5 per group). *, P < 0.05; **, P < 0.01; ***, P < 0.001.
Figure 5. Binding of PABPC1L to JAK2 mRNA promotes its stability and translation. A, RIP assays showed the association of PABPC1L with JAK2 mRNA. Relative enrichment representing RNA levels associated with PABPC1L compared with input control. IgG antibody served as a control. B, IF-FISH assay showing that JAK2 mRNA is colocalized with PABPC1L protein in the cytoplasm. Scale bar, 10 μm. C, Representative Western blot analysis showing the coimmunoprecipitation of overexpressed PABPC1L-Flag and endogenous eIF4G in both 769-P and Caki-1 cells. D, Representative Western blot analysis showing the coimmunoprecipitation of endogenous PABPC1L and eIF4G in both 769-P and Caki-1 cells. E, PABPC1L expression was altered and cell lysates were incubated with m7GTP (5′mRNA cap analog). Cap-associated proteins were then eluted and immunoblotted using the antibodies indicated. F, Reduced stability of JAK2 mRNA upon PABPC1L knockdown. G, Left, schematic representation of PABPC1L and its truncated forms. Sequence and structure analyses indicate the presence of RRM1–4. Right, relative enrichment represented JAK2 mRNA levels associated with truncated PABPC1L relative to input control. Bottom, immunoblot analysis with anti-FLAG of cells transfected with plasmids encoding FLAG-tagged truncated PABPC1Ls. H, Representative traces of polyribosome profiles obtained from shCtrl or shPABPC1L cells. I, qRT-PCR analysis of JAK2 mRNA levels in each fraction obtained from shCtrl or shPABPC1L cells. All experiments were performed with three independent biological replicates, and data shown are representative of three independent experiments.
Figure 5.
Binding of PABPC1L to JAK2 mRNA promotes its stability and translation. A, RIP assays showed the association of PABPC1L with JAK2 mRNA. Relative enrichment representing RNA levels associated with PABPC1L compared with input control. IgG antibody served as a control. B, IF-FISH assay showing that JAK2 mRNA is colocalized with PABPC1L protein in the cytoplasm. Scale bar, 10 μm. C, Representative Western blot analysis showing the coimmunoprecipitation of overexpressed PABPC1L-Flag and endogenous eIF4G in both 769-P and Caki-1 cells. D, Representative Western blot analysis showing the coimmunoprecipitation of endogenous PABPC1L and eIF4G in both 769-P and Caki-1 cells. E, PABPC1L expression was altered and cell lysates were incubated with m7GTP (5′mRNA cap analog). Cap-associated proteins were then eluted and immunoblotted using the antibodies indicated. F, Reduced stability of JAK2 mRNA upon PABPC1L knockdown. G, Left, schematic representation of PABPC1L and its truncated forms. Sequence and structure analyses indicate the presence of RRM1–4. Right, relative enrichment represented JAK2 mRNA levels associated with truncated PABPC1L relative to input control. Bottom, immunoblot analysis with anti-FLAG of cells transfected with plasmids encoding FLAG-tagged truncated PABPC1Ls. H, Representative traces of polyribosome profiles obtained from shCtrl or shPABPC1L cells. I, qRT-PCR analysis of JAK2 mRNA levels in each fraction obtained from shCtrl or shPABPC1L cells. All experiments were performed with three independent biological replicates, and data shown are representative of three independent experiments.
Figure 6. PABPC1L is a transcriptional target of STAT1. A, Conserved STAT binding sites at the PABPC1L promoter were predicted by JASPAR. B, Luciferase reporter assays for 769-P cells with or without STAT1 silencing transfected with indicated reporter plasmids containing full length and truncated PABPC1L promoters. C, Luciferase reporter assays for 769-P cells with or without STAT1 silencing transfected with indicated reporter plasmids containing wild-type (WT) and mutant (Mut) PABPC1L promoters. D, Luciferase reporter assays indicated that STAT1 enhanced wild-type but not mutant PABPC1L promoter activity. E, ChIP assays showed that STAT1 bound to the PABPC1L promoter in 769-P cells (top). The ChIP products were analyzed by electrophoresis (bottom). F, Relative RNA expression level of PABPC1L by qPCR in 769-P cells with STAT1 silencing. G, Top, schematic representations of the role of the PABPC1L/IDO1 axis in immune suppression and ICB resistance in RCC. Bottom, schematic model depicting the molecular mechanism of PABPC1L regulating IDO1 expression and JAK2-STAT1 signaling contributing to PABPC1L upregulation in RCC through a positive feedback loop. All experiments were performed with three independent biological replicates, and data shown are representative of three independent experiments. ***, P < 0.001.
Figure 6.
PABPC1L is a transcriptional target of STAT1. A, Conserved STAT binding sites at the PABPC1L promoter were predicted by JASPAR. B, Luciferase reporter assays for 769-P cells with or without STAT1 silencing transfected with indicated reporter plasmids containing full length and truncated PABPC1L promoters. C, Luciferase reporter assays for 769-P cells with or without STAT1 silencing transfected with indicated reporter plasmids containing wild-type (WT) and mutant (Mut) PABPC1L promoters. D, Luciferase reporter assays indicated that STAT1 enhanced wild-type but not mutant PABPC1L promoter activity. E, ChIP assays showed that STAT1 bound to the PABPC1L promoter in 769-P cells (top). The ChIP products were analyzed by electrophoresis (bottom). F, Relative RNA expression level of PABPC1L by qPCR in 769-P cells with STAT1 silencing. G, Top, schematic representations of the role of the PABPC1L/IDO1 axis in immune suppression and ICB resistance in RCC. Bottom, schematic model depicting the molecular mechanism of PABPC1L regulating IDO1 expression and JAK2-STAT1 signaling contributing to PABPC1L upregulation in RCC through a positive feedback loop. All experiments were performed with three independent biological replicates, and data shown are representative of three independent experiments. ***, P < 0.001.
Figure 7. PABPC1L deficiency reverses immune suppression and therapeutic potential of PABPC1L knockdown and ICB combination therapy in RCC PDX models. A, IDO1-KO cells and control cells were subjected to PABPC1L knockdown or overexpression. KYN and TRP levels in cell supernatants were determined by ELISA. HPLC/MS-MS analysis was used to generate the TRP metabolomic profiles of mouse plasma, and the KYN/TRP ratio in the mouse plasma was calculated. B, Flow cytometry analysis of CD25+ and Foxp3+ Tregs. C and D, IDO1-KO cells and control cells were subjected to PABPC1L knockdown or overexpression. C, Tumor images. D, Tumor growth curves (n = 5 per group). E, Schematic diagram showing that RCC PDX mice were treated with adoptive T-cell transfer, anti-PD-1 antibody, and siRNA at the indicated time points. In the figure, −21 indicates the day of subcutaneous inoculation of RCC PDXs. F–H, The anti-PD-1 and siPABPC1L combination therapy synergistically suppressed the growth of tumors in RCC PDX mice (n = 5 per group). Tumor growth curves (F), tumor images (G), and survival curves (H). I, Flow cytometry analysis of GZMB in CD8+ T cells isolated from PDX tumors, with the indicated treatments. J, Representative flow cytometry histograms (left) and statistical analysis (right) of cell surface PD-1 isolated from PDX tumors with the indicated treatments. K, Representative images and quantification of cleaved caspase-3–positive cells as analyzed by IHC staining. Scale bars, 2.5 mm (n = 5 per group). ns, nonsignificant; ***, P < 0.001.
Figure 7.
PABPC1L deficiency reverses immune suppression and therapeutic potential of PABPC1L knockdown and ICB combination therapy in RCC PDX models. A, IDO1-KO cells and control cells were subjected to PABPC1L knockdown or overexpression. KYN and TRP levels in cell supernatants were determined by ELISA. HPLC/MS-MS analysis was used to generate the TRP metabolomic profiles of mouse plasma, and the KYN/TRP ratio in the mouse plasma was calculated. B, Flow cytometry analysis of CD25+ and Foxp3+ Tregs. C and D, IDO1-KO cells and control cells were subjected to PABPC1L knockdown or overexpression. C, Tumor images. D, Tumor growth curves (n = 5 per group). E, Schematic diagram showing that RCC PDX mice were treated with adoptive T-cell transfer, anti-PD-1 antibody, and siRNA at the indicated time points. In the figure, −21 indicates the day of subcutaneous inoculation of RCC PDXs. F–H, The anti-PD-1 and siPABPC1L combination therapy synergistically suppressed the growth of tumors in RCC PDX mice (n = 5 per group). Tumor growth curves (F), tumor images (G), and survival curves (H). I, Flow cytometry analysis of GZMB in CD8+ T cells isolated from PDX tumors, with the indicated treatments. J, Representative flow cytometry histograms (left) and statistical analysis (right) of cell surface PD-1 isolated from PDX tumors with the indicated treatments. K, Representative images and quantification of cleaved caspase-3–positive cells as analyzed by IHC staining. Scale bars, 2.5 mm (n = 5 per group). ns, nonsignificant; ***, P < 0.001.

Similar articles

Cited by

References

    1. Siegel RL, Miller KD, Fuchs HE, Jemal A. Cancer statistics, 2021. CA Cancer J Clin 2021;71:7–33. - PubMed
    1. Cho YH, Kim MS, Chung HS, Hwang EC. Novel immunotherapy in metastatic renal cell carcinoma. Investig Clin Urol 2017;58:220–7. - PMC - PubMed
    1. Motzer RJ, Jonasch E, Agarwal N, Alva A, Baine M, Beckermann K, et al. . Kidney Cancer, Version 3.2022, NCCN clinical practice guidelines in oncology. J Natl Compr Canc Netw 2022;20:71–90. - PMC - PubMed
    1. Williamson SR, Taneja K, Cheng L. Renal cell carcinoma staging: pitfalls, challenges, and updates. Histopathology 2019;74:18–30. - PubMed
    1. Fridman WH, Pagès F, Sautès-Fridman C, Galon J. The immune contexture in human tumours: impact on clinical outcome. Nat Rev Cancer 2012;12:298–306. - PubMed

MeSH terms

Grants and funding