. 2024 Feb 20;16(4):3880-3895.
doi: 10.18632/aging.205566. Epub 2024 Feb 20.

Comprehensive analysis identifies crucial genes associated with immune cells mediating progression of carotid atherosclerotic plaque

Affiliations

Comprehensive analysis identifies crucial genes associated with immune cells mediating progression of carotid atherosclerotic plaque

Zhen Li et al. Aging (Albany NY). .

Abstract

Backgrounds: Carotid atherosclerosis is prone to rupture and cause ischemic stroke in advanced stages of development. Our research aims to provide markers for the progression of atherosclerosis and potential targets for its treatment.

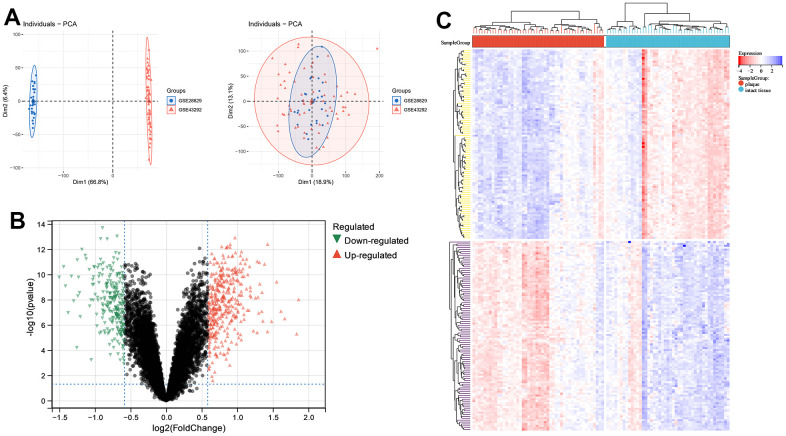
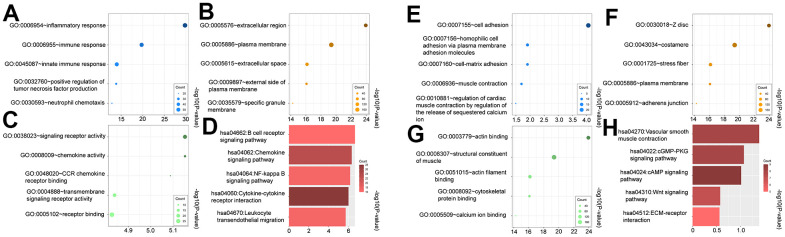
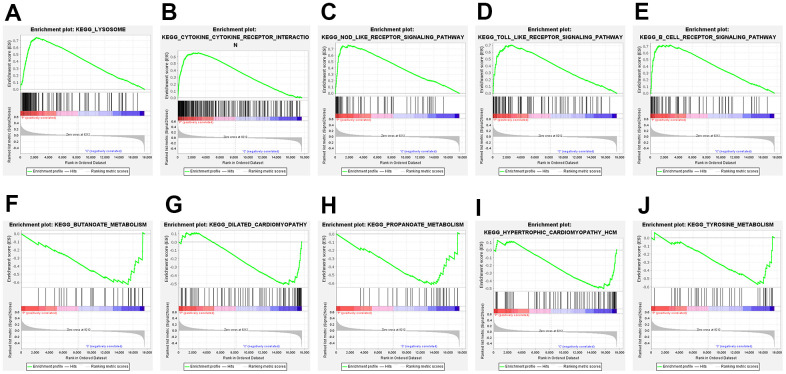
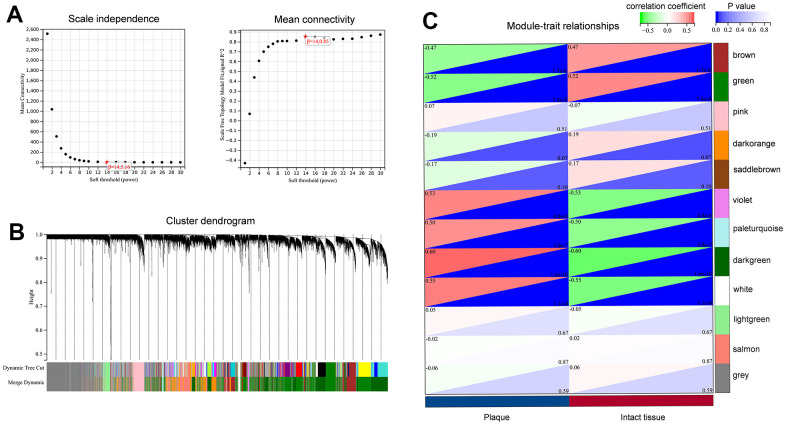
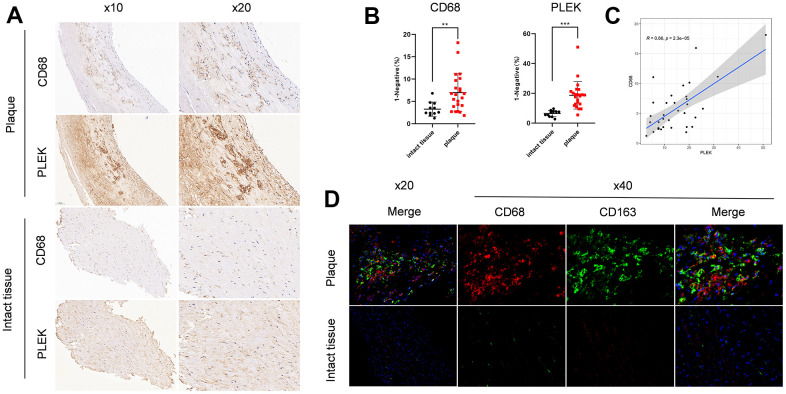
Methods: We performed a thorough analysis using various techniques including DEGs, GO/KEGG, xCell, WGCNA, GSEA, and other methods. The gene expression omnibus datasets GSE28829 and GSE43292 were utilized for this comprehensive analysis. The validation datasets employed in this study consisted of GSE41571 and GSE120521 datasets. Finally, we validated PLEK by immunohistochemistry staining in clinical samples.

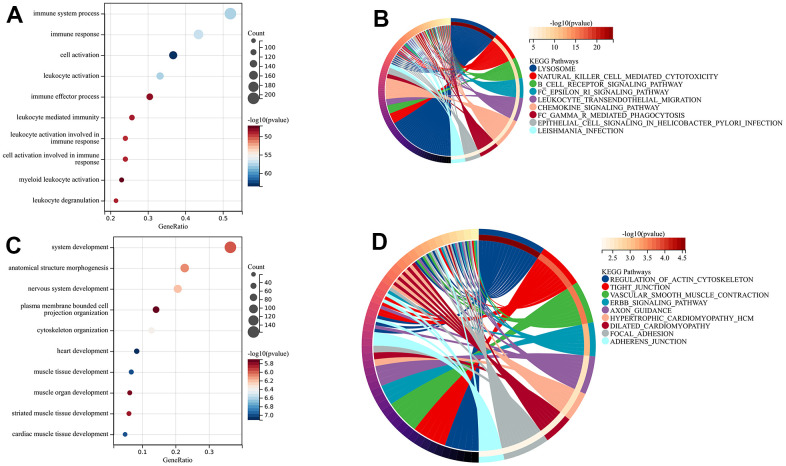
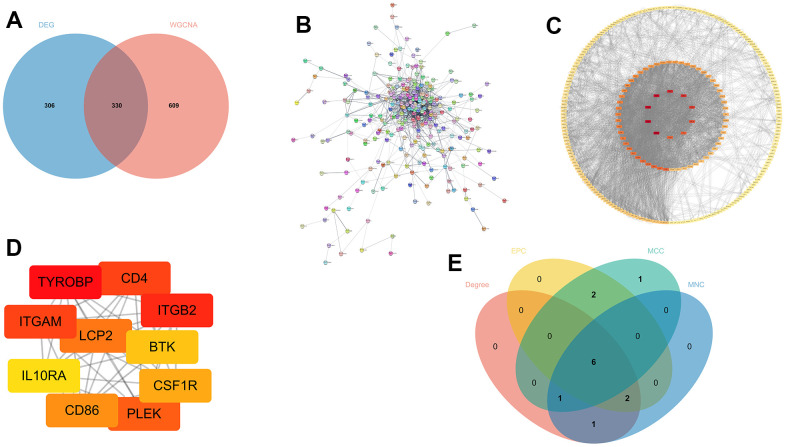
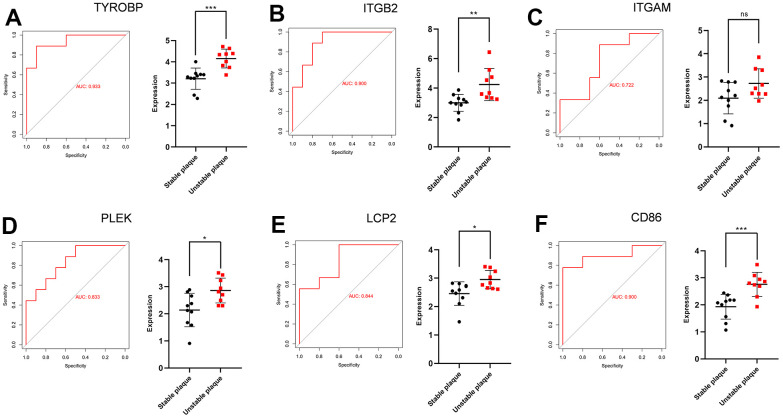
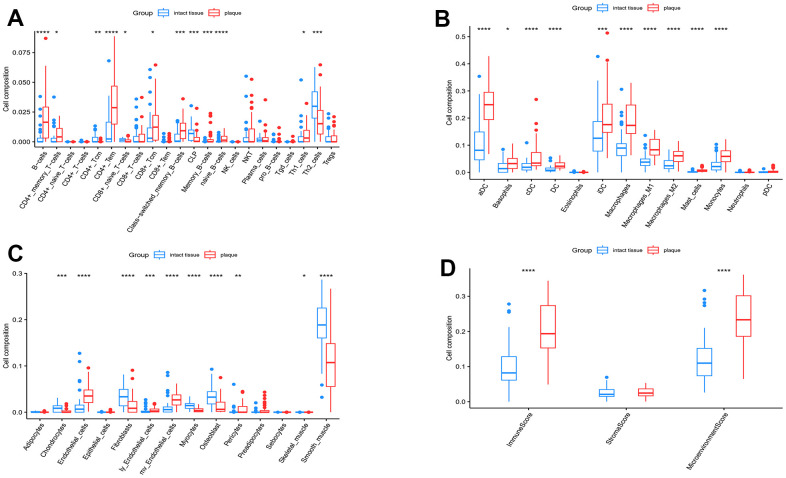
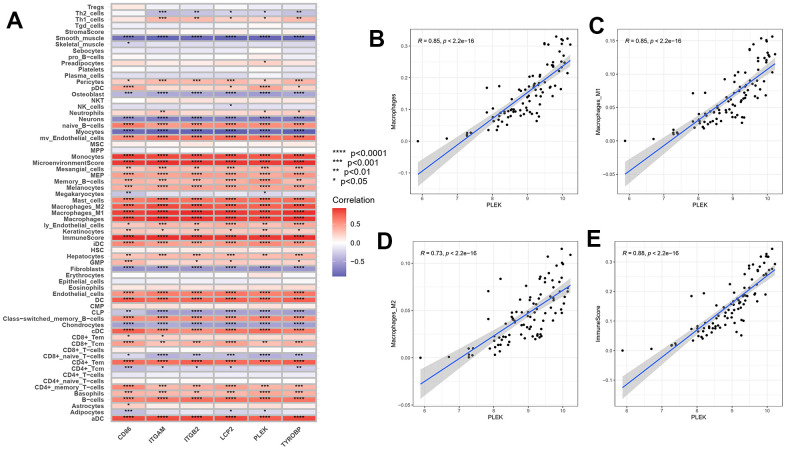
Results: Using the WGCNA technique, we discovered 636 differentially expressed genes (DEGs) and obtained 12 co-expression modules. Additionally, we discovered two modules that were specifically associated with atherosclerotic plaque. A total of 330 genes that were both present in DEGs and WGCNA results were used to create a protein-protein network in Cytoscape. We used four different algorithms to get the top 10 genes and finally got 6 overlapped genes (TYROBP, ITGB2, ITGAM, PLEK, LCP2, CD86), which are identified by GSE41571 and GSE120521 datasets. Interestingly, the area under curves (AUC) of PLEK is 0.833. Besides, we found PLEK is strongly positively correlated with most lymphocytes and myeloid cells, especially monocytes and macrophages, and negatively correlated with most stromal cells (e.g, neurons, myocytes, and fibroblasts). The expression of PLEK were consistent with the immunohistochemistry results.

Conclusions: Six genes (TYROBP, ITGB2, ITGAM, PLEK, LCP2, CD86) were found to be connected with carotid atherosclerotic plaques and PLEK may be an important biomarker and a potential therapeutic target.

Keywords: RNA sequencing; WGCNA; bioinformatics; carotid atherosclerotic plaque; immunity.


Conflict of interest statement

CONFLICTS OF INTEREST: The authors declare that they have no conflicts of interest.

Figures

Figure 1
Figure 1
Principle components analysis (PCA) and analysis of differentially expressed genes (DEGs) between carotid atherosclerotic plaque and intact tissue samples. (A) PCA; (B) volcano plot; (C) heatmap of top 100 DEGs.
Figure 2
Figure 2
Gene ontology (GO) and kyoto encyclopedia of genes and genomes (KEGG) of upregulated (AD) and downregulated DEGs (EH). (A, E) biological process (BP) analysis, (B, F) cellular components (CC) analysis, (C, G) molecular function (MF) analysis, (D, H) KEGG pathway analysis.
Figure 3
Figure 3
Gene set enrichment analysis (GSEA) of the top 5 upregulated and downregulated GSEA pathways. (A) lysosome; (B) cytokine-cytokine-receptor interaction; (C) NOD-like-receptor signaling pathway; (D) TOLL-like-receptor signaling pathway; (E) B-cell-receptor signaling pathway; (F) butanoate metabolism; (G) dilated cardiomyopathy; (H) propanoate metabolism; (I) hypertrophic cardiomyopathy HCM; (J) tyrosine metabolism.
Figure 4
Figure 4
Construction of the co-expression network for carotid atherosclerotic plaque. (A) Identification of soft threshold power (β); (B) Clustering dendrogram to find co-expression modules; (C) The identification of key modules related to sample traits.
Figure 5
Figure 5
The enrichment analysis of key modules. (A, B) BP and KEGG analysis of the darkgreen module; (C, D) BP and KEGG analysis of green module.
Figure 6
Figure 6
Screening out potential genes. (A) The overlapping of DEGs and key module genes from WGCNA; (B) Protein-protein interaction (PPI) networks; (C, D) All the genes and the top 10 genes calculated by the Degree algorithm of cytoHubba; (E) The overlapped hub genes from four different algorithms.
Figure 7
Figure 7
ROC curves and statistic of expression for TYROBP, ITGB2, ITGAM, PLEK, LCP2 and CD86. (A) The AUC for TYROBP was 0.933. (B) The AUC for ITGB2 was 0.900. (C) The AUC for ITGAM was 0.722. (D) The AUC for PLEK was 0.833. (E) The AUC for LCP2 was 0.844. (F) The AUC for CD86 was 0.900.
Figure 8
Figure 8
xCell analysis. (A) The enrichment scores of lymphoid cells; (B) Enrichment scores of myeloid cells; (C) Enrichment scores of stromal cells; (D) Total enrichment scores of the immune and stromal microenvironment. Significance level was denoted by *p-value<0.05, **p-value<0.01, ***p-value<0.001, ****p-value<0.0001.
Figure 9
Figure 9
Correlation between gene expressions and the relative percentages of 64 cell types. (A) The heatmap of correlation between six hub genes and lymphoid cells, myeloid cells and stomal cells. (BE) Scatterplots illustrate the exact relationship between the PLEK expression and the relative proportion of macrophages M0(R=0.85, p<2.2e-16), macrophages M1(R=0.85, p<2.2e-16), macrophages M2(R=0.73, p<2.2e-16) and immuneScore (R=0.88, p<2.2e-16).
Figure 10
Figure 10
Validation of PLEK importance in carotid atherosclerotic plaque. (A) Staining images of PLEK protein expression in carotid atherosclerotic plaque and intact tissue samples. (B) Statistic of PLEK protein expression in carotid atherosclerotic plaque and intact tissue samples. (C) The scatterplot of correlation between PLEK and CD68. (D) Macrophage infiltration of plaque versus intact tissue by immunofluorescence.

Similar articles

Cited by

References

    1. Brown AA, Viñuela A, Delaneau O, Spector TD, Small KS, Dermitzakis ET. Predicting causal variants affecting expression by using whole-genome sequencing and RNA-seq from multiple human tissues. Nat Genet. 2017; 49:1747–51. 10.1038/ng.3979 - DOI - PubMed
    1. Martorell-Marugan J, Toro-Dominguez D, Alarcon-Riquelme ME, Carmona-Saez P. MetaGenyo: a web tool for meta-analysis of genetic association studies. BMC Bioinformatics. 2017; 18:563. 10.1186/s12859-017-1990-4 - DOI - PMC - PubMed
    1. Stears RL, Martinsky T, Schena M. Trends in microarray analysis. Nat Med. 2003; 9:140–5. 10.1038/nm0103-140 - DOI - PubMed
    1. Toro-Domínguez D, Martorell-Marugán J, López-Domínguez R, García-Moreno A, González-Rumayor V, Alarcón-Riquelme ME, Carmona-Sáez P. ImaGEO: integrative gene expression meta-analysis from GEO database. Bioinformatics. 2019; 35:880–2. 10.1093/bioinformatics/bty721 - DOI - PubMed
    1. Fan JB, Chen X, Halushka MK, Berno A, Huang X, Ryder T, Lipshutz RJ, Lockhart DJ, Chakravarti A. Parallel genotyping of human SNPs using generic high-density oligonucleotide tag arrays. Genome Res. 2000; 10:853–60. 10.1101/gr.10.6.853 - DOI - PMC - PubMed

Publication types

MeSH terms