Raman and Surface-Enhanced Raman Scattering Detection in Flowing Solutions for Complex Mixture Analysis
- PMID: 38382105
- PMCID: PMC11254575
- DOI: 10.1146/annurev-anchem-061522-035207
Raman and Surface-Enhanced Raman Scattering Detection in Flowing Solutions for Complex Mixture Analysis
Abstract
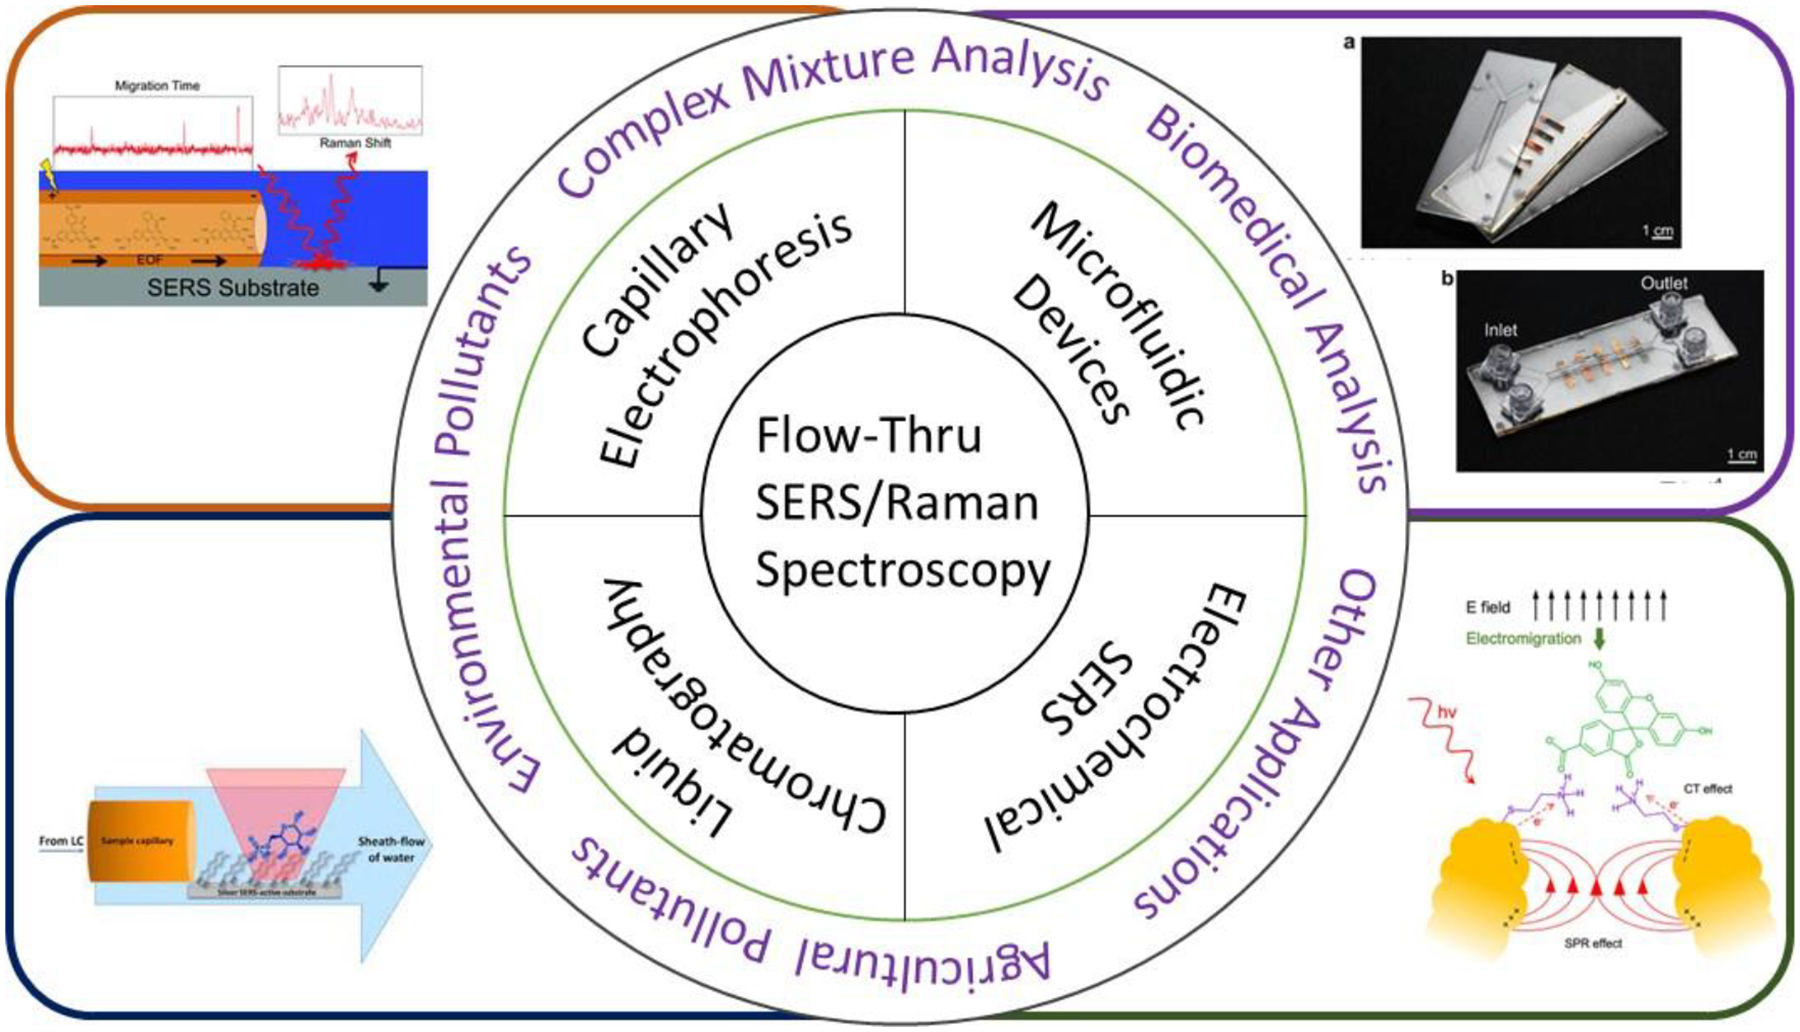
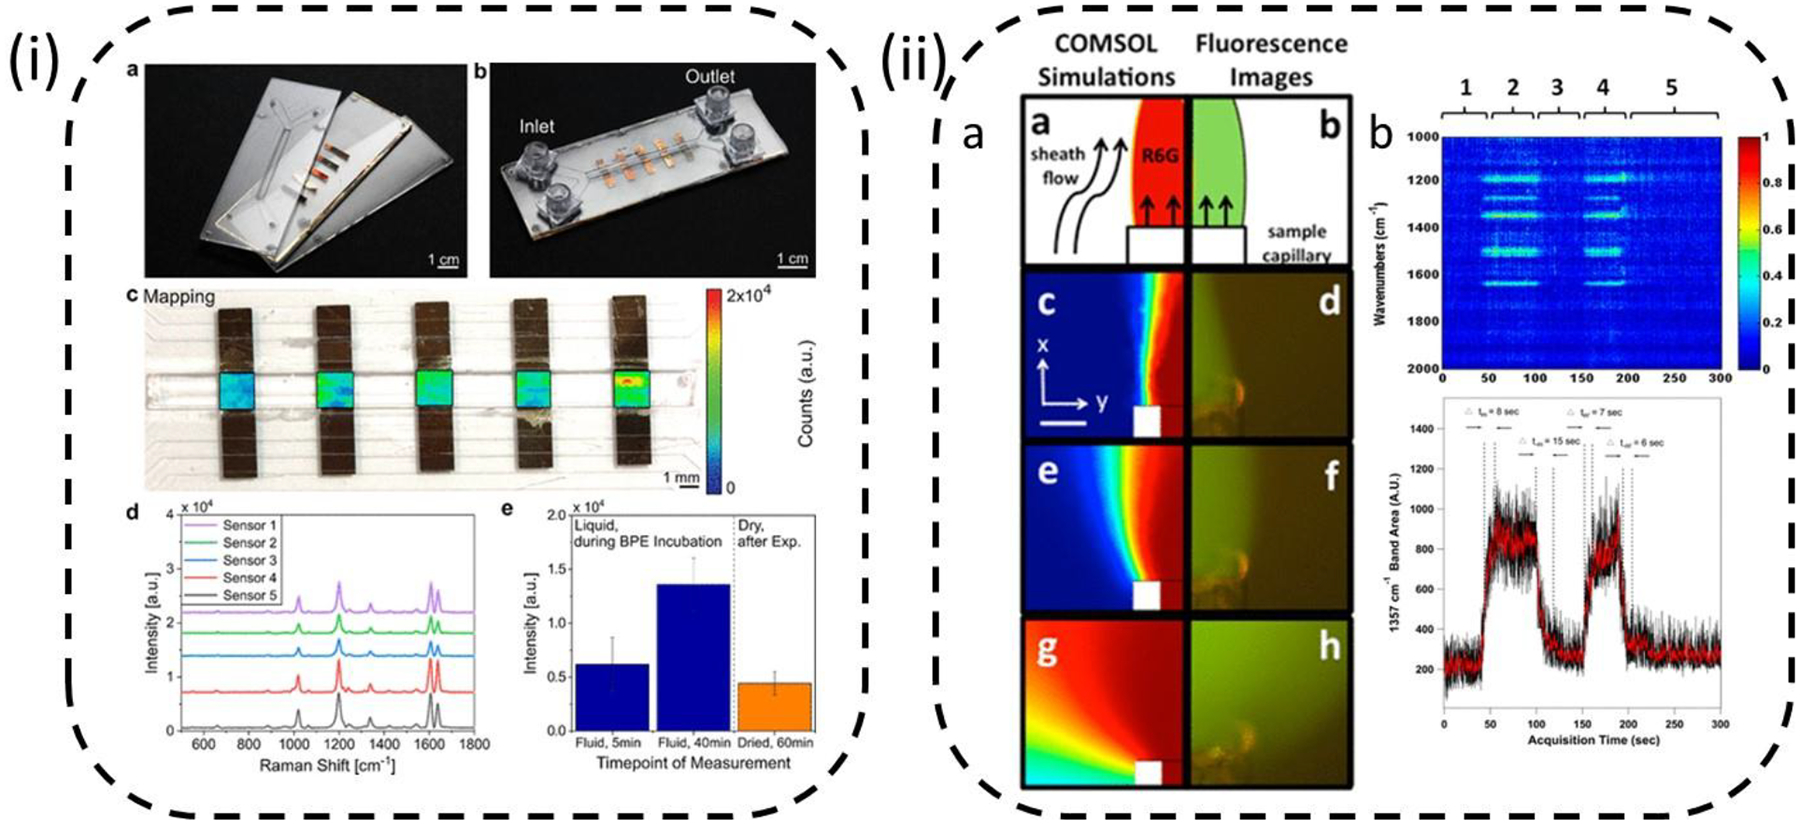
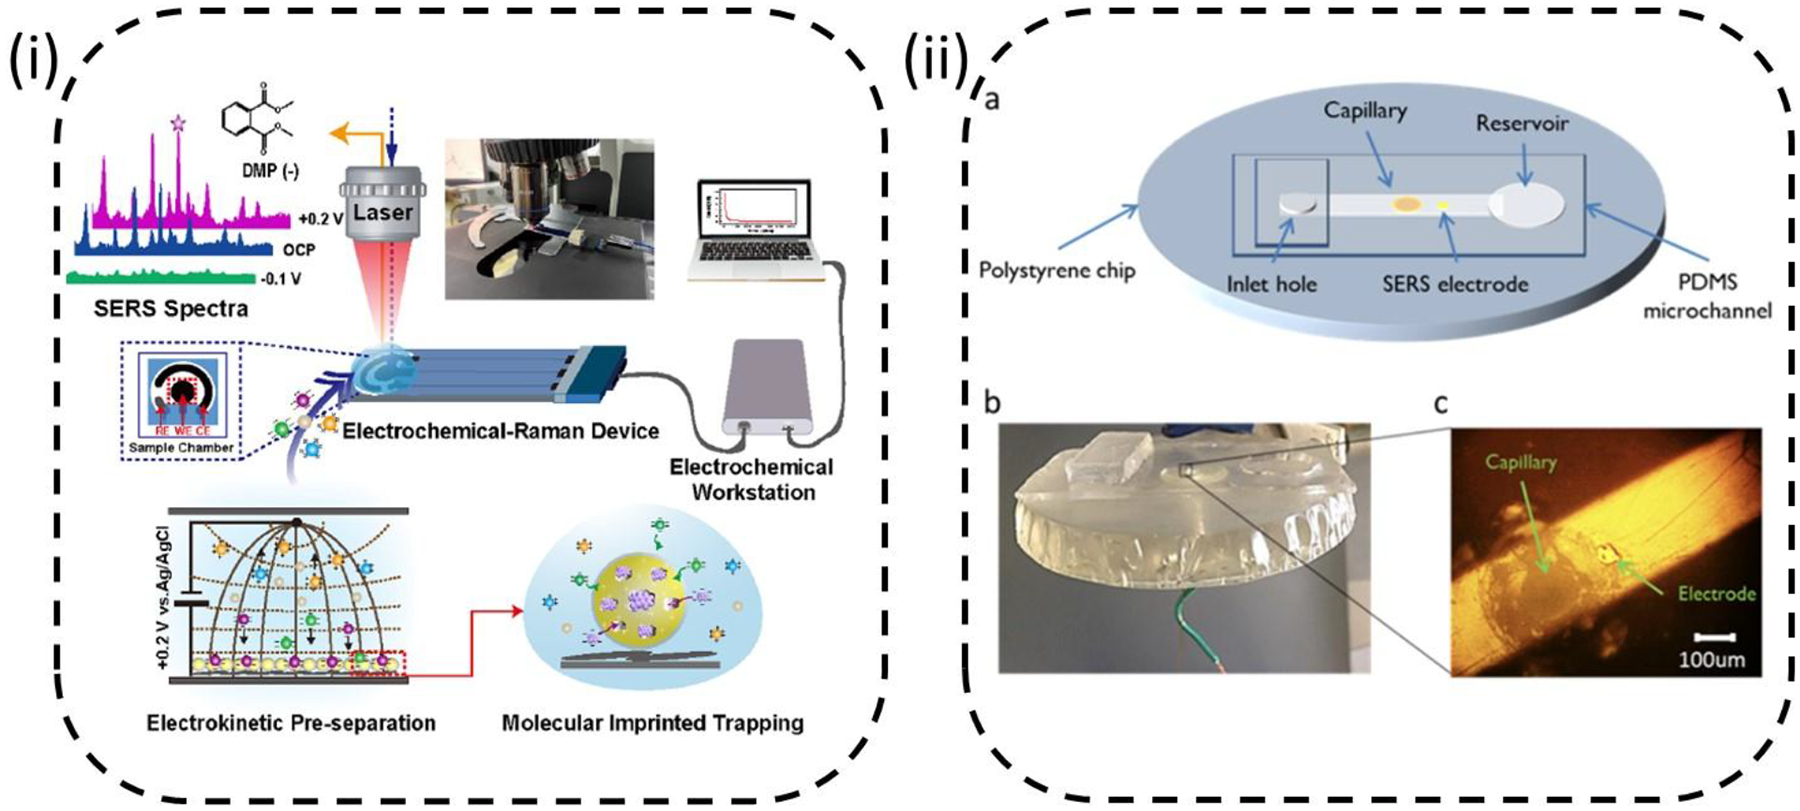
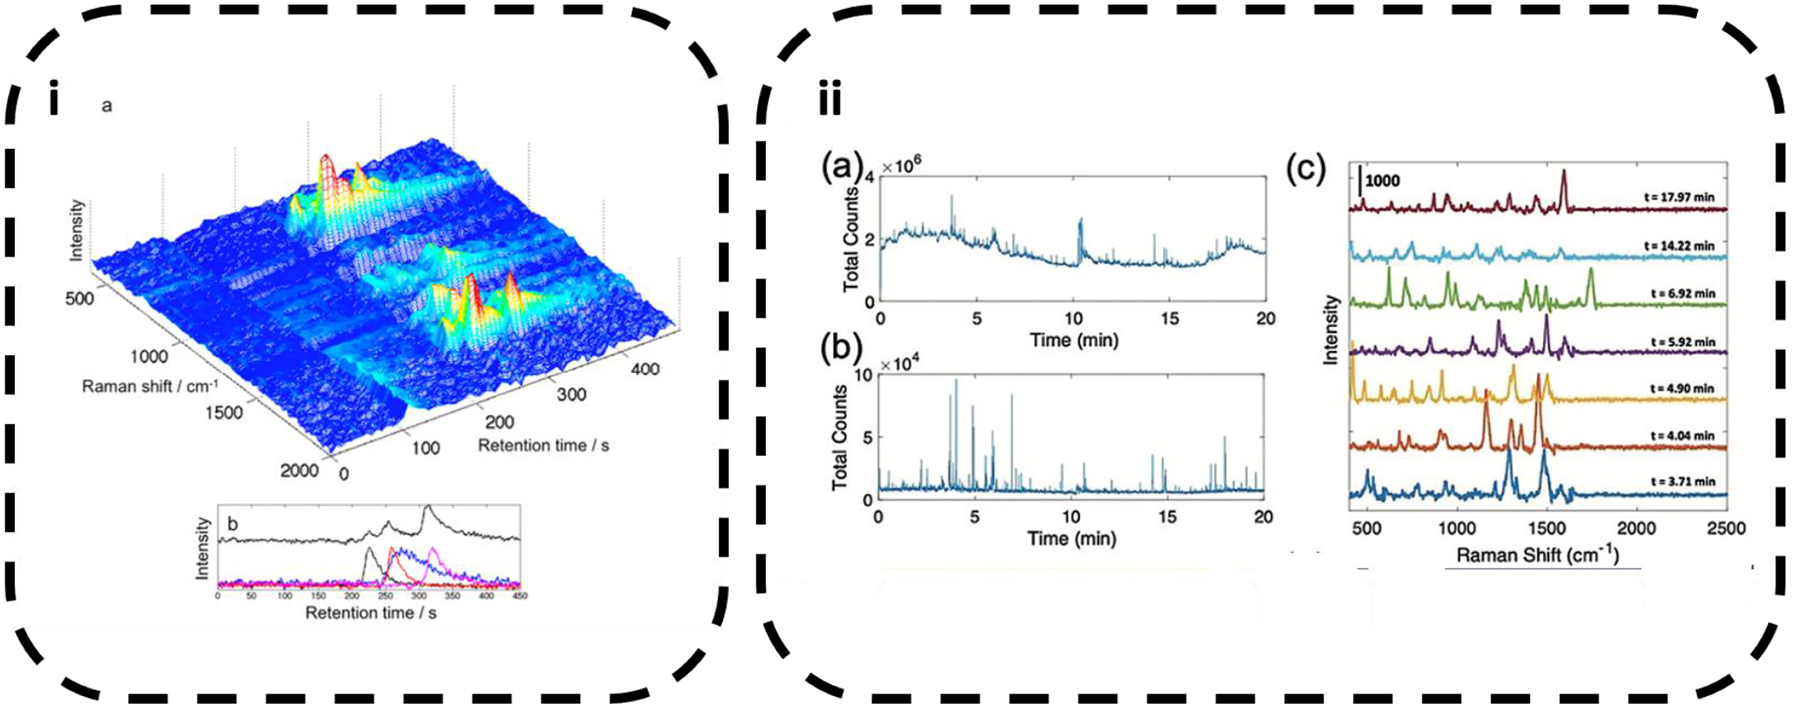
Raman scattering provides a chemical-specific and label-free method for identifying and quantifying molecules in flowing solutions. This review provides a comprehensive examination of the application of Raman spectroscopy and surface-enhanced Raman scattering (SERS) to flowing liquid samples. We summarize developments in online and at-line detection using Raman and SERS analysis, including the design of microfluidic devices, the development of unique SERS substrates, novel sampling interfaces, and coupling these approaches to fluid-based chemical separations (e.g., chromatography and electrophoresis). The article highlights the challenges and limitations associated with these techniques and provides examples of their applications in a variety of fields, including chemistry, biology, and environmental science. Overall, this review demonstrates the utility of Raman and SERS for analysis of complex mixtures and highlights the potential for further development and optimization of these techniques.
Keywords: Raman; SERS; chromatography; electrophoresis; microfluidics; online detection; surface-enhanced Raman scattering.
Figures
Similar articles
-
Recent advances in surface enhanced Raman spectroscopy for bacterial pathogen identifications.J Adv Res. 2023 Sep;51:91-107. doi: 10.1016/j.jare.2022.11.010. Epub 2022 Dec 19. J Adv Res. 2023. PMID: 36549439 Free PMC article.
-
Surface-Enhanced Raman Scattering Nanotags: Design Strategies, Biomedical Applications, and Integration of Machine Learning.Wiley Interdiscip Rev Nanomed Nanobiotechnol. 2025 May-Jun;17(3):e70015. doi: 10.1002/wnan.70015. Wiley Interdiscip Rev Nanomed Nanobiotechnol. 2025. PMID: 40391396 Review.
-
Surface-Enhanced Raman Spectroscopy for Biomedical Applications: Recent Advances and Future Challenges.ACS Appl Mater Interfaces. 2025 Mar 19;17(11):16287-16379. doi: 10.1021/acsami.4c17502. Epub 2025 Feb 24. ACS Appl Mater Interfaces. 2025. PMID: 39991932 Free PMC article. Review.
-
Reaction-Based SERS Probes for the Detection of Raman-Inactive Species.ACS Appl Mater Interfaces. 2024 Dec 11;16(49):67134-67154. doi: 10.1021/acsami.4c16059. Epub 2024 Nov 27. ACS Appl Mater Interfaces. 2024. PMID: 39604209 Review.
-
Innovative applications of quantum dots-based surface-enhanced Raman spectroscopy for food safety detection.Crit Rev Food Sci Nutr. 2025 Jul 17:1-20. doi: 10.1080/10408398.2025.2531224. Online ahead of print. Crit Rev Food Sci Nutr. 2025. PMID: 40671534 Review.
Cited by
-
Digital surface enhanced Raman spectroscopy for quantifiable single molecule detection in flow.Analyst. 2024 Jul 8;149(14):3711-3715. doi: 10.1039/d4an00801d. Analyst. 2024. PMID: 38895849 Free PMC article.
-
Sugar Analysis Using Hydrophilic Liquid Chromatography Combined with Raman Spectroscopy.Anal Chem. 2025 Jul 1;97(25):12981-12988. doi: 10.1021/acs.analchem.4c06076. Epub 2025 Jun 14. Anal Chem. 2025. PMID: 40515678 Free PMC article.
References
-
- Lima C, Muhamadali H, Goodacre R. 2021. The role of raman spectroscopy within quantitative metabolomics. Annu. Rev. Anal. Chem 14 : 323–45 - PubMed
-
- Chen W, Yu H. 2021. Advances in the characterization and monitoring of natural organic matter using spectroscopic approaches. Water research (Oxford). 190 : 116759 - PubMed
Publication types
Grants and funding
LinkOut - more resources
Full Text Sources
Miscellaneous