Meta-Analysis
. 2024 Feb 20;5(2):101430.
doi: 10.1016/j.xcrm.2024.101430.

Novel ancestry-specific primary open-angle glaucoma loci and shared biology with vascular mechanisms and cell proliferation

Affiliations
Meta-Analysis

Novel ancestry-specific primary open-angle glaucoma loci and shared biology with vascular mechanisms and cell proliferation

Valeria Lo Faro et al. Cell Rep Med. .

Abstract

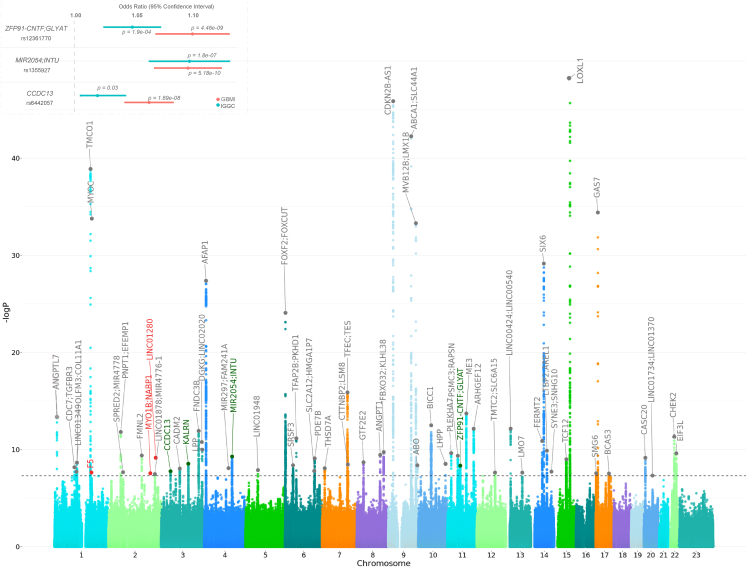
Primary open-angle glaucoma (POAG), a leading cause of irreversible blindness globally, shows disparity in prevalence and manifestations across ancestries. We perform meta-analysis across 15 biobanks (of the Global Biobank Meta-analysis Initiative) (n = 1,487,441: cases = 26,848) and merge with previous multi-ancestry studies, with the combined dataset representing the largest and most diverse POAG study to date (n = 1,478,037: cases = 46,325) and identify 17 novel significant loci, 5 of which were ancestry specific. Gene-enrichment and transcriptome-wide association analyses implicate vascular and cancer genes, a fifth of which are primary ciliary related. We perform an extensive statistical analysis of SIX6 and CDKN2B-AS1 loci in human GTEx data and across large electronic health records showing interaction between SIX6 gene and causal variants in the chr9p21.3 locus, with expression effect on CDKN2A/B. Our results suggest that some POAG risk variants may be ancestry specific, sex specific, or both, and support the contribution of genes involved in programmed cell death in POAG pathogenesis.

Keywords: GWAS; PRS; cross-ancestry; disease disparity; disease prediction; genetic interactions; genetics; glaucoma; pleiotropy; transcriptomic.


Conflict of interest statement

Declaration of interests E.R.G. received an honorarium from the journal Circulation Research of the American Heart Association as a member of the Editorial Board. S.M. is a co-founder and holds stock in Seonix Pty Ltd.

Figures

None
Graphical abstract
Figure 1
Figure 1
Workflow of this study A total of 15 biobanks joined the GBMI POAG meta-analysis (n = 1,487,441: 26,848 cases, 1,460,593 controls), where phenotyping was harmonized across biobanks, biobank-specific quality control was performed and standardized genome-wide association study (GWAS) was conducted. This was followed by a meta-analysis of GBMI, IGGC of European ancestry, and GGLAD (n = 1,478,037: 46,325 cases, 1,431,712 controls). On the Meta-GBMI multi-ethnic biobanks summary data, we performed functional impact, enrichment analysis, transcriptome-wide association study (TWAS), and fine-mapping. Polygenic risk scores (PRSs) for POAG were constructed from the leave-biobank-out GBMI-IGGC-GGLAD meta-analysis summary statistics with PRS-CS and validated in six biobanks (BBJ, BioVU, Estonian, GLGS, Lifelines, and UKBB). PRSs were then tested for association using phenome-wide association studies (PheWAS) across four biobanks. Then, to confirm and interpret our results, we examined the expression effects of missense variants in SIX6-CDKN2B-AS1 and TMEM167B loci in GTEx data. MAC, minor allele count.
Figure 2
Figure 2
Genome-wide association study of POAG: Manhattan plot and effect size comparison of novel variants in GBMI and IGGC The x axis is the position on each chromosome and the y axis is the –log10 p value from the GWAS for each SNP. The black line demarcates the threshold for genome-wide significance (p = 5.0e−8). The four replicated novel regions and the nearest genes that reach the threshold for significance are indicated in green, the potentially novel regions and the nearest genes are indicated in red. Previously reported genes are in gray. Details of all genome-wide significant signals are in Table S3. Inset: the effect size comparison of significant novel single nucleotide polymorphism in GBMI and. p indicates the p value of each variant.
Figure 3
Figure 3
Assessment of prediction performance and odds ratio in polygenic risk scores for POAG across multiple biobanks (A) Prediction performance of GBMI-IGGC-GGLAD and IGGC POAG meta-analysis across five biobanks. The proportion of variance in POAG explained by PRS (Nagelkerke’s R2 in liability scale) is reported on the y axis. The source dataset used to estimate the marginal effect size of SNPs are listed in parentheses for each biobank. The PRSs of POAG were generated using PRScs auto. Performance of UKBB and BBJ using IGGC was not checked because data from the two biobanks are part of IGGC meta-analysis. AFR, African ancestry; EAS, East Asian ancestry; EUR, European ancestry. (B) The odds ratio (OR) between top decile and mid-decile PRS POAG across five biobanks. The dashed line indicates OR = 1. The averaged OR was calculated using the inverse-variance weighted method. PRS was stratified into deciles with the mid-decile (40%–60%) used as the reference group. The discovery dataset used to estimate the marginal effect size of SNPs are listed in parentheses for each biobank. AFR, African ancestry; EAS, East Asian ancestry; EUR, European ancestry. (C) Proportion of phecode groups associated with polygenic risk generated from leave-biobank-out POAG GBMI-IGGC-GGLAD meta-analysis across three biobanks. Asterisks indicate groups that are significantly enriched.
Figure 4
Figure 4
Genetic correlations and expression effects in GTEx skeletal muscle tissue: insights into SIX6 and CDKN2B-AS1 loci interactions and pheWAS (A) Correlations in measured gene expressions in GTEx skeletal muscle tissue between genes in the SIX6 and CDKN2B-AS1 loci. (B) Effect of rs33912345 variants in GTEx-measured gene expressions in skeletal muscle tissue (n = 716). Difference in GTEx-measured gene expressions of SIX6 locus genes, SIX6 and SALRNA1, between (i) individuals who carry the rs33912345C causal allele (represented here by proxy variant rs7493429, r2 = 0.74) versus those with the wild-type allele and (ii) different genotype causal/wild-type combination. p values (p) are based on t test (i) and ANOVA tests (ii). (C) Effects of genetic interaction between rs33912345_SIX6 proxy variant and rs10811650_CDKN2B-AS1 on CDKN2B-AS1 locus gene expressions, (i) Expression pattern in individuals who carry wild-type rs33912345_SIX6 proxy variant in combination with rs10811650_CDKN2B-AS1 genotypes in brain cortex, (ii) expression pattern in individuals who carry rs33912345_SIX6 proxy variant causal allele in combination with rs10811650_CDKN2B-AS1 genotypes in brain cortex, and (iii) expression pattern in individuals who carry homozygous rs33912345_SIX6 proxy variant in combination with rs10811650_CDKN2B-AS1 genotypes in skeletal muscle. p values (p) are based on ANOVA tests. (D) GReX-PheWAS for categorizing phenome-wide associations for CDKN2A and CDKN2B genetically regulated expressions in BioVU and UKBB. (i) Miami plot of TWAS Z scores (y axis) across phenotypes, colored by phecode group. The dotted gray line shows the significance threshold for Benjamini-Hochberg FDR correction and phenotypes are labeled if the association passes Bonferroni correction. (ii) Boxplots of –log10 Benjamini-Hochberg FDR-adjusted p values of genetical GTAs across nine phenotype groups. The dotted gray line shows FDR-adjusted p value of 0.05.

References

    1. Quigley H.A., Broman A.T. The number of people with glaucoma worldwide in 2010 and 2020. Br. J. Ophthalmol. 2006;90:262–267. - PMC - PubMed
    1. Gupta N., Ly T., Zhang Q., Kaufman P.L., Weinreb R.N., Yücel Y.H. Chronic ocular hypertension induces dendrite pathology in the lateral geniculate nucleus of the brain. Exp. Eye Res. 2007;84:176–184. - PubMed
    1. Saccà S.C., Pascotto A., Camicione P., Capris P., Izzotti A. Oxidative DNA Damage in the Human Trabecular Meshwork. Arch. Ophthalmol. 2005;123:458–463. doi: 10.1001/archopht.123.4.458. - DOI - PubMed
    1. Nemesure B., Honkanen R., Hennis A., Wu S.Y., Leske M.C., Barbados Eye Studies Group Incident Open-angle Glaucoma and Intraocular Pressure. Ophthalmology. 2007;114:1810–1815. doi: 10.1016/j.ophtha.2007.04.003. - DOI - PubMed
    1. Gramer E., Grehn F. Springer Science & Business Media; 2012. Pathogenesis and Risk Factors of Glaucoma.

Publication types