. 2024 Feb 20;5(2):101415.
doi: 10.1016/j.xcrm.2024.101415.

Disruption of MerTK increases the efficacy of checkpoint inhibitor by enhancing ferroptosis and immune response in hepatocellular carcinoma

Affiliations

Disruption of MerTK increases the efficacy of checkpoint inhibitor by enhancing ferroptosis and immune response in hepatocellular carcinoma

Shun Wang et al. Cell Rep Med. .

Abstract

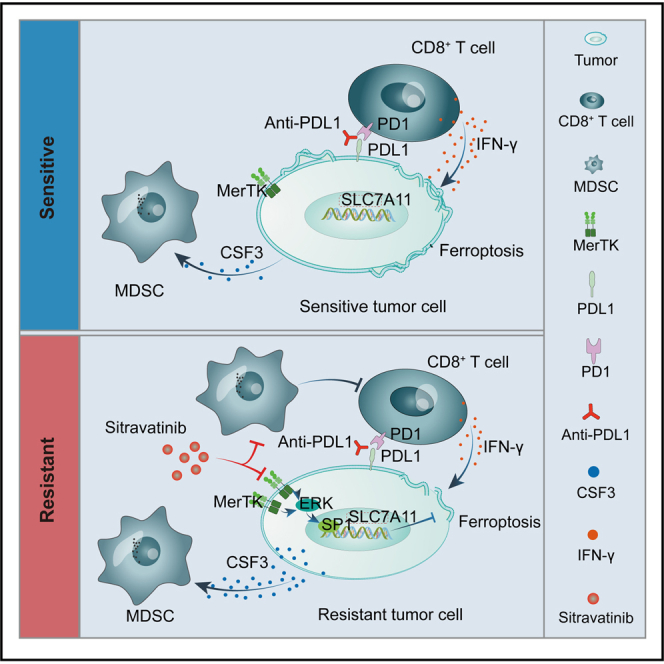
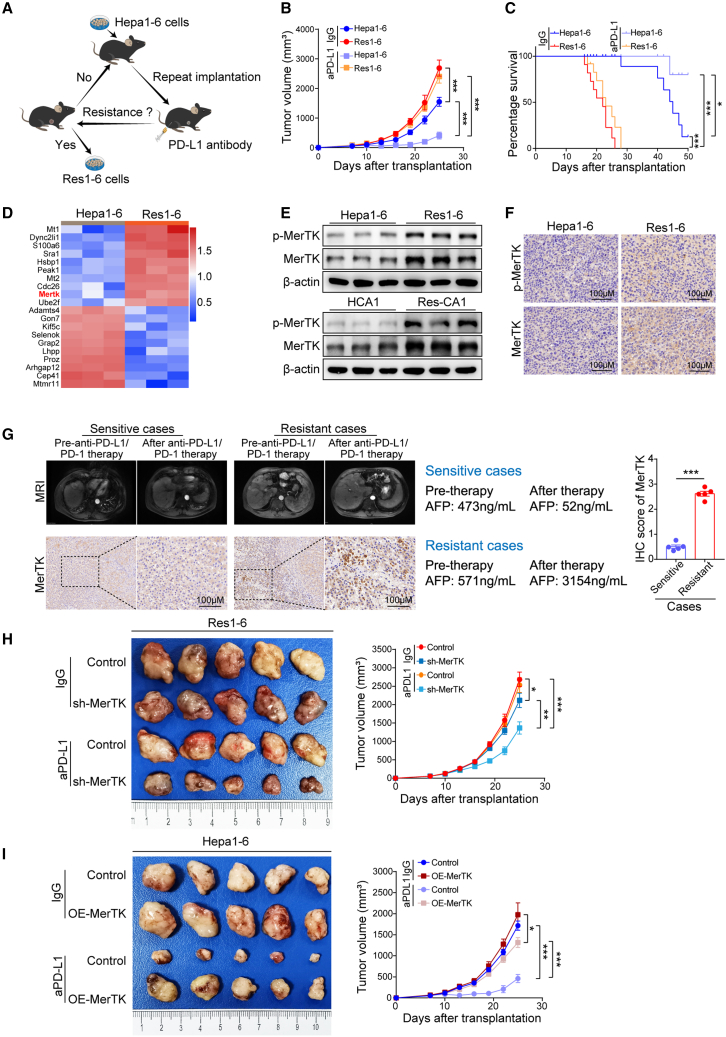
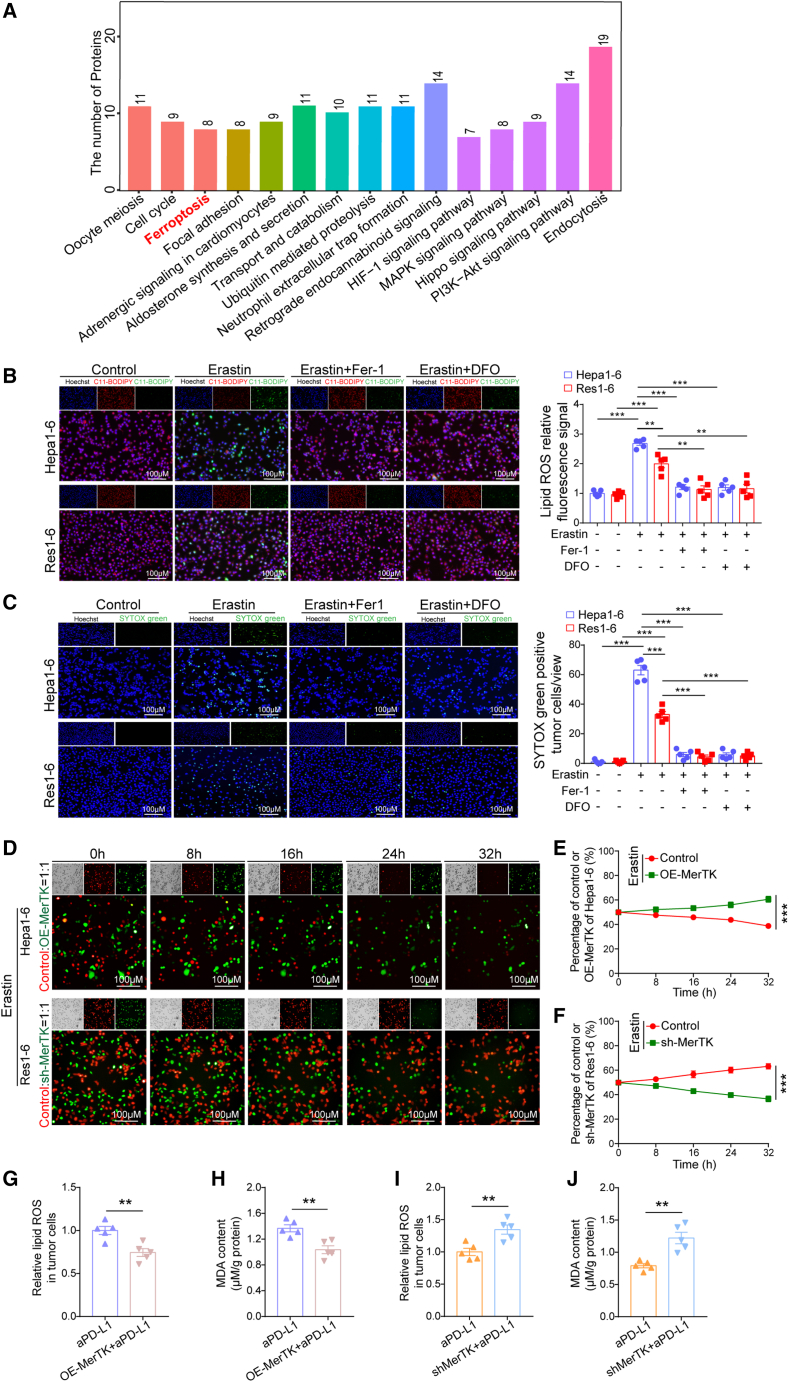
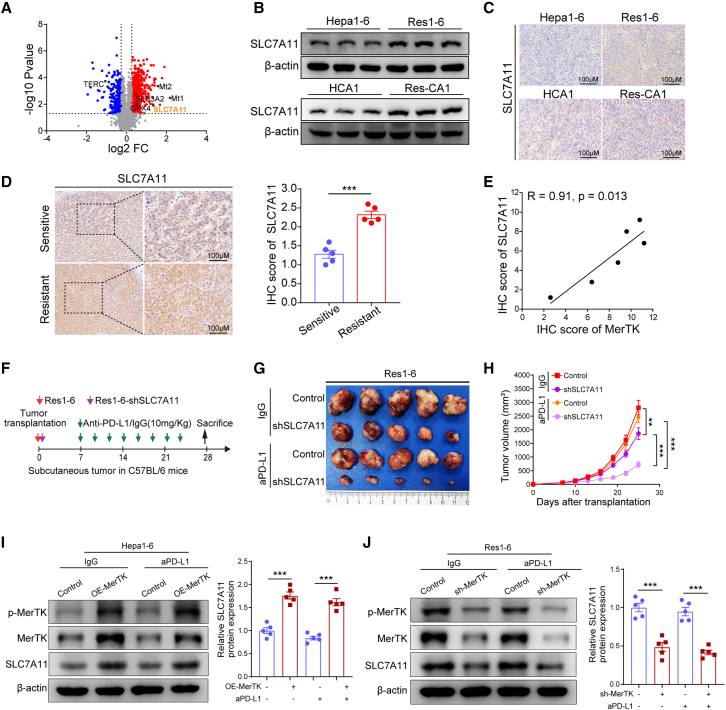
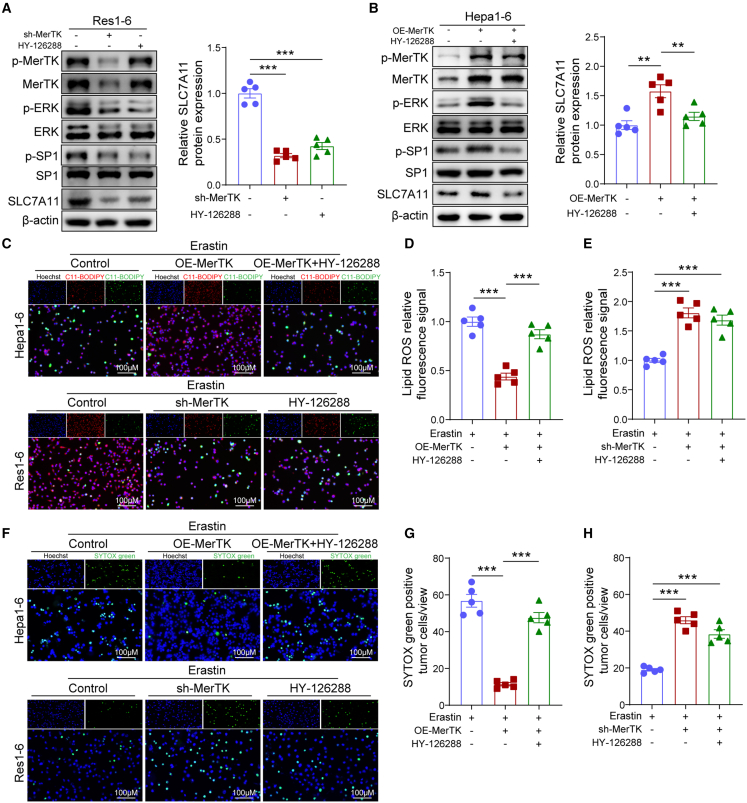
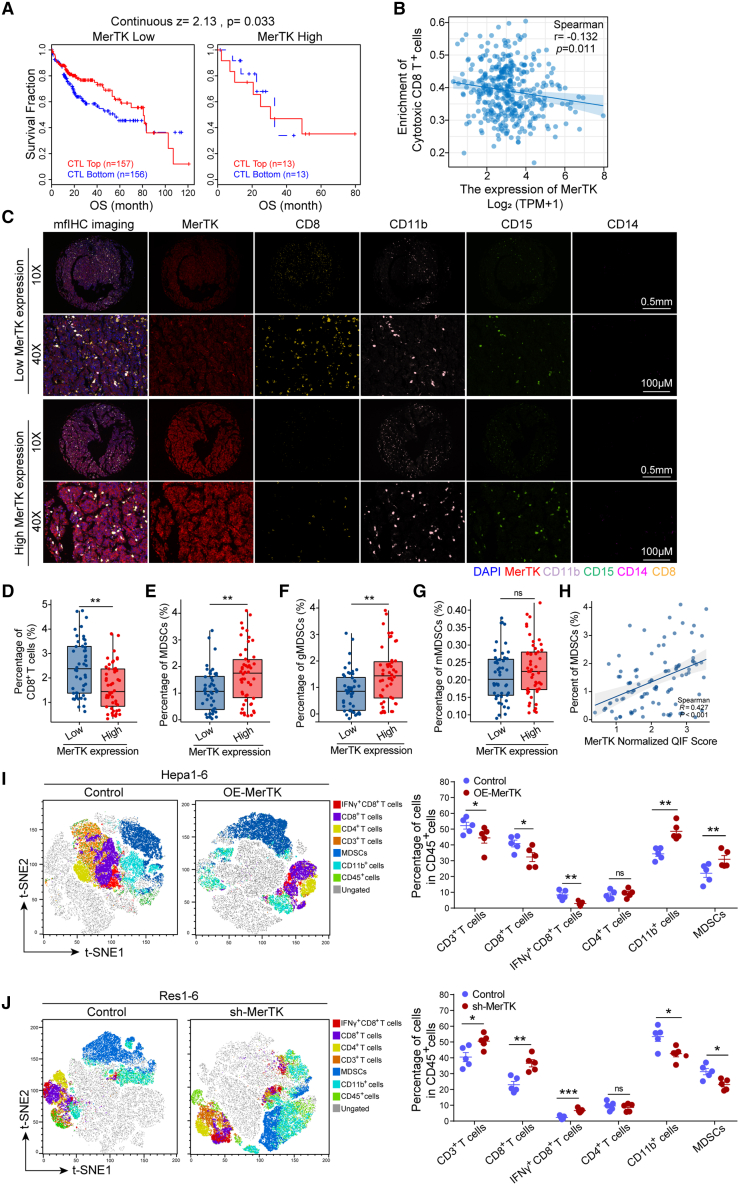
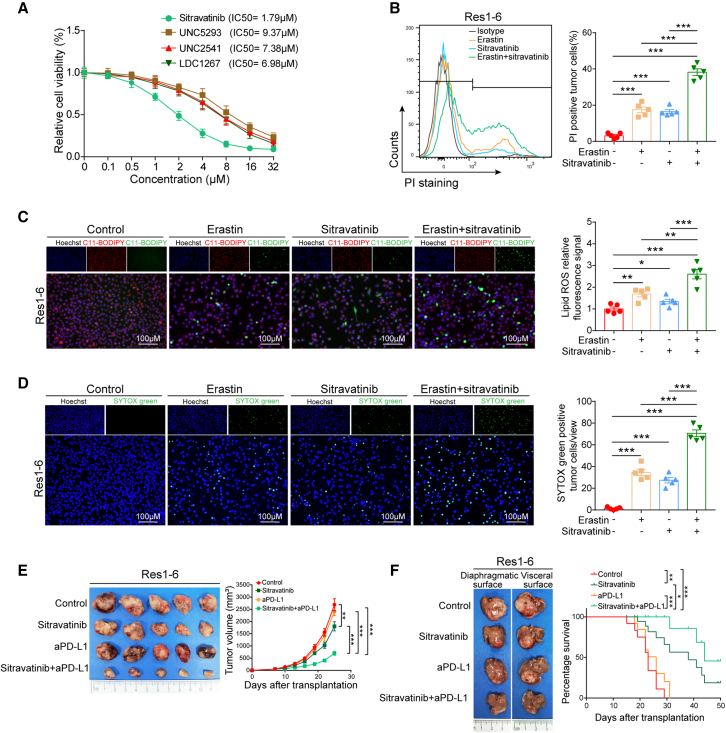
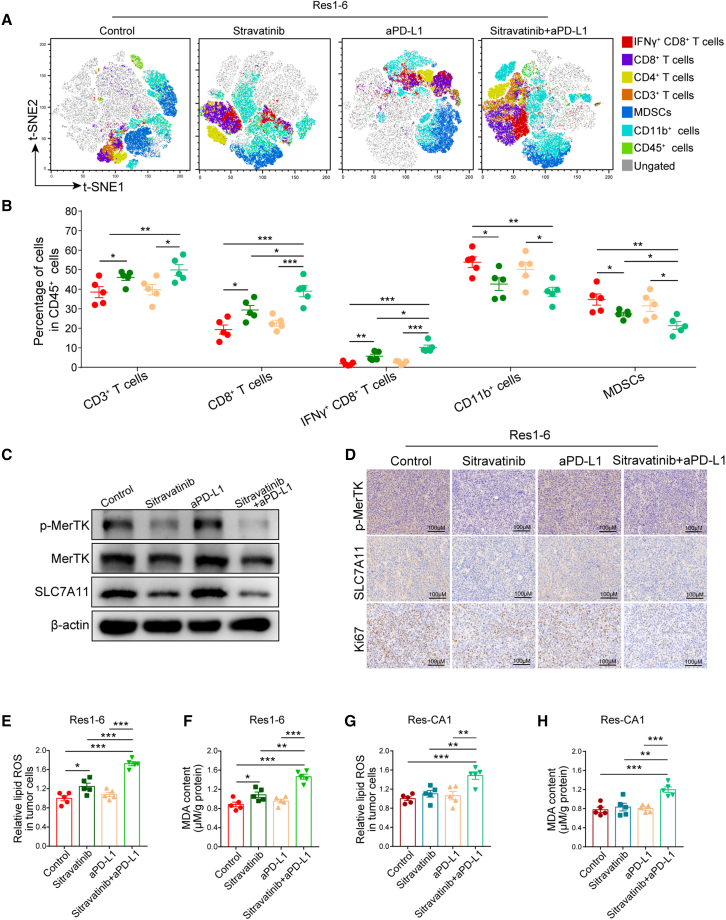
Immune checkpoint inhibitors, particularly PD-1/PD-L1 blockades, have been approved for unresectable hepatocellular carcinoma (HCC). However, high resistance rates still limit their efficacy, highlighting the urgent need to understand the underlying mechanisms and develop strategies for overcoming the resistance. In this study, we demonstrate that HCC with high MER proto-oncogene tyrosine kinase (MerTK) expression exhibits anti-PD-1/PD-L1 resistance in two syngeneic mouse models and in patients who received anti-PD-1/PD-L1 therapy. Mechanistically, MerTK renders HCC resistant to anti-PD-1/PD-L1 by limiting ferroptosis with the upregulation of SLC7A11 via the ERK/SP1 pathway and facilitating the development of an immunosuppressive tumor microenvironment (TME) with the recruitment of myeloid-derived suppressor cells (MDSCs). Sitravatinib, an inhibitor of MerTK, sensitizes resistant HCC to anti-PD-L1 therapy by promoting tumor ferroptosis and decreasing MDSC infiltration into the TME. In conclusion, we find that MerTK could serve as a predictive biomarker for patient stratification and as a promising target to overcome anti-PD-1/PD-L1 resistance in HCC.


Conflict of interest statement

Declaration of interests The authors declare no competing interests.

Figures

None
Graphical abstract
Figure 1
Figure 1
MerTK mediates HCC resistant to anti-PD-L1 treatment (A) Schematic illustrating the establishment of anti-PD-L1-resistant strains in vivo. (B) Tumor growth curves of subcutaneous implantation models in Hepa1-6 and Res1-6 strains treated with anti-PD-L1 (aPD-L1) or IgG. (C) Survival of orthotopic implantation models of Hepa1-6 and Res1-6 strains treated with aPD-L1 or IgG. (D) Proteomic sequencing analysis was used to analyze the differently expressed proteins in Hepa1-6 and Res1-6. The top 20 differently expressed proteins are presented in a heatmap, including 10 upregulated and 10 downregulated proteins. (E) Western blot of p-MerTK, MerTK, and β-actin in Hepa1-6, Res1-6, HCA-1, and Res-CA1 strains. (F) IHC staining of p-MerTK and MerTK in Hepa1-6 and Res1-6 subcutaneous tumor tissues. (G) Locations of sensitive and resistant tumors were exhibited by MRI, and AFP values before and after anti-PD-L1/PD-1 therapy between patient in sensitive group and patient in resistant group. IHC staining of MerTK expression in HCC tissues from sensitive and resistant patients received anti-PD-1/PD-L1 therapy. (H and I) Subcutaneous xenograft mouse model of Res1-6, Res1-6-sh-MerTK, Hepa1-6, and Hepa1-6-OE-MerTK strains treated with anti-PD-L1 or IgG. When the tumor volume approximately reached 100 mm3 in size, tumor volume was measured every 3 days. After 25 days of treatment, mice were sacrificed. Shown are tumor appearance and tumor growth curves. All results are shown as mean ± SEM (n = 5). One- or two-way ANOVA was used to analyze the data; ∗p < 0.05, ∗∗p < 0.01, and ∗∗∗p < 0.001.
Figure 2
Figure 2
MerTK promotes anti-PD-L1 resistance by suppressing ferroptosis in HCC (A) All the differential genes between Hepa1-6 and Res1-6 cells were analyzed using KEGG pathway analysis using the functional gene sets in MSigDB (literature vs. databases containing signaling pathways). (B) Fluorescence detection of lipid ROS by C11-BODIPY (left) and statistical analysis of relative lipid ROS fluorescence signal (right). (C) Fluorescence detection of dead cells by SYTOX Green (left) and statistical analysis of percentage dead cells (right). (D–F) Cell viability of Hepa1-6, Hepa1-6-OE-MerTK, Res1-6, and Res1-6-sh-MerTK strains treated with erastin (5.0 μM) in cocultured condition (left) and statistical analysis of cell survival rate in each time point (right). (G–J) In subcutaneous xenograft mouse model, the statistical analysis of relative lipid ROS and MDA content in Hepa1-6, Hepa1-6-OE-MerTK, Res1-6, and Res1-6-sh-MerTK strains treated with anti-PD-L1 or IgG. All results are shown as mean ± SEM (n = 5). One- or two-way ANOVA was used to analyze the data; ∗∗p < 0.01 and ∗∗∗p < 0.001.
Figure 3
Figure 3
Suppression of SLC7A11 sensitizes anti-PD-L1 treatment caused by MerTK (A) Volcano plot of differentially expressed proteins in protein mass spectrometry. (B) Western blot of SLC7A11 expression in Hepa1-6, Res1-6, HCA-1, and Res-CA1. (C) IHC staining of SLC7A11 in Hepa1-6, Res1-6, HCA-1, and Res-CA1 subcutaneous tumor tissues. (D) IHC staining of SLC7A11 expression in HCC tissues from sensitive and resistant patients with anti-PD-1/PD-L1 therapy, and statistical analysis. (E) The correlation between MerTK and SLC7A11 expression in tumor tissues from HCC patients received anti-PD-1/PD-L1 therapy, Pearson product-moment correlation coefficients and p values are shown. (F and G) (F) Schematic illustrating the procedure of anti-PD-L1 or IgG treatment in Res1-6 and Res1-6-shSLC7A11 subcutaneous tumor model, and (G) the representative images of subcutaneous tumor in different groups. (H) Statistical analysis of tumor growth curves. (I and J) Western blot analysis of p-MerTK, MerTK, SLC7A11, and β-actin expression in Hepa1-6, Hepa1-6-OE-MerTK, Res1-6, and Res1-6-shMerTK subcutaneous tumor treated with anti-PD-L1 or IgG. All results are shown as mean ± SEM (n = 5). One- or two-way ANOVA was used to analyze the data; ∗∗p < 0.01 and ∗∗∗p < 0.001.
Figure 4
Figure 4
MerTK regulates HCC tumor cell ferroptosis via the ERK/SP1 pathway (A) Western blot analysis of p-MerTK, MerTK, p-ERK, ERK, p-SP1, SP1, SLC7A11, and β-actin expression in Res1-6, Res1-6-shMerTK, and Res1-6 treated with ERK1/2 inhibitor (HY-126288). (B) Western blot analysis of p-MerTK, MerTK, p-ERK, ERK, p-SP1, SP1, SLC7A11, and β-actin expression in Hepa1-6, Hepa1-6-OE-MerTK, and Hepa1-6-OE-MerTK treated with ERK1/2 inhibitor. (C–E) (C) Fluorescence detection of lipid ROS by C11-BODIPY and (D) statistical analysis of relative lipid ROS fluorescence signal in Hepa1-6 tumor cells and (E) in Res1-6 tumor cells. (F–H) (F) Fluorescence detection of dead cells by SYTOX Green, (G) statistical analysis of percentage dead cells in Hepa1-6 tumor cells and (H) in Res1-6 tumor cells. All results are shown as mean ± SEM (n = 5). One- or two-way ANOVA was used to analyze the data; ∗∗p < 0.01 and ∗∗∗p < 0.001.
Figure 5
Figure 5
MerTK induces anti-PD-L1 resistance by favoring a protumor microenvironment (A) Relationship between overall survival and CTL levels in HCC patients with low and high MerTK gene copy numbers. (B) The correlations between the mRNA expression levels of MerTK and cytotoxic CD8+ T cells. (C) The representative image of HCC tissue stained with MerTK (red), CD8 (gold), CD11b (purple), CD15 (green), and CD14 (pink). (D–G) (D) The percentage statistical analysis of CD8+ T cells (E) MDSCs, (F) gMDSCs, and (G) mMDSCs in tumor tissues. (H) The correlation analysis between the expression of MerTK and the enrichment of MDSCs. (I and J) T-distributed stochastic neighbor embedding (t-SNE) plot of tumor-infiltrating leukocytes overlaid with color-coded clusters and the frequency of clusters of the indicated immune cell subsets, including CD3+ T cells, CD8+ T cells, IFNγ+CD8+ T cells, CD4+ T cells, CD11b+ cells, and MDSCs in Hepa1-6, Hepa1-6-OE-MerTK, Res1-6, and Res1-6-shMerTK subcutaneous tumor model treated with anti-PD-L1 or IgG (left) and the statistical analysis (right). All results are shown as mean ± SEM (n = 5). One- or two-way ANOVA was used to analyze the data; ∗p < 0.05, ∗∗p < 0.01, and ∗∗∗p < 0.001.
Figure 6
Figure 6
Inhibition of MerTK promotes ferroptosis and increases the efficacy of PD-L1 antibody in resistant HCC (A) Cell viability (percentage) analysis of Res1-6 cells following MerTK inhibitors (sitravatinib, UNC5293, UNC2541, and UNC1267) at different concentrations (0, 0.1, 0.5, 1.0, 2.0, 4.0, 8.0, 16.0, and 32.0 μM). (B) Cell death detection by propidium iodide (PI) staining (left) and statistical analysis (right). (C) Fluorescence detection of lipid ROS by C11-BODIPY (left) and statistical analysis of relative lipid ROS fluorescence signal (right). (D) Fluorescence detection of dead cells by SYTOX Green (left) and statistical analysis of percentage dead cells (right). (E) The representative images of subcutaneous tumor in Res1-6 strains were treated with IgG, sitravatinib, anti-PD-L1 or their combination (left) and the statistical analysis of tumor growth curves (right). (F) The representative images of orthotopic tumor in Res1-6 strains were treated with IgG, sitravatinib, anti-PD-L1 or their combination (left) and the statistical analysis of survival curves (right). All results are shown as mean ± SEM (n = 5). One- or two-way ANOVA was used to analyze the data; ∗p < 0.05, ∗∗p < 0.01, and ∗∗∗p < 0.001.
Figure 7
Figure 7
Sitravatinib combined with PD-L1 antibody increases ferroptosis and reduces MDSC infiltration in HCC microenvironment (A and B) (A) T-SNE plot of tumor-infiltrating leukocytes overlaid with color-coded clusters and the frequency of clusters of the indicated immune cell subsets, including CD3+ T cells, CD8+ T cells, IFNγ+CD8+ T cells, CD4+ T cells, CD11b+ cells, and MDSCs in Res1-6 strains treated with IgG, sitravatinib, anti-PD-L1, or their combination and (B) the statistical analysis. (C) Western blot analysis of p-MerTK, MerTK, SLC7A11, and β-actin expression in different groups. (D) The representative imagines of IHC staining of p-MerTK, MerTK, and Ki-67 from subcutaneous tumors treated with IgG, sitravatinib, anti-PD-L1 or their combination. Scale bar: 100 μm. (E–H) In subcutaneous xenograft mouse model, the statistical analysis of relative lipid ROS and MDA content in Res1-6 and Res-CA1 strains treated with IgG, sitravatinib, anti-PD-L1, or their combination. All results are shown as mean ± SEM (n = 5). One- or two-way ANOVA was used to analyze the data; ∗p < 0.05, ∗∗p < 0.01, and ∗∗∗p < 0.001.

References

    1. Llovet J.M., Kelley R.K., Villanueva A., Singal A.G., Pikarsky E., Roayaie S., Lencioni R., Koike K., Zucman-Rossi J., Finn R.S. Hepatocellular carcinoma. Nat. Rev. Dis. Prim. 2021;7:6. doi: 10.1038/s41572-020-00240-3. - DOI - PubMed
    1. El-Khoueiry A.B., Sangro B., Yau T., Crocenzi T.S., Kudo M., Hsu C., Kim T.Y., Choo S.P., Trojan J., Welling T.H., Rd, et al. Nivolumab in patients with advanced hepatocellular carcinoma (CheckMate 040): an open-label, non-comparative, phase 1/2 dose escalation and expansion trial. Lancet. 2017;389:2492–2502. doi: 10.1016/S0140-6736(17)31046-2. - DOI - PMC - PubMed
    1. Zhu A.X., Finn R.S., Edeline J., Cattan S., Ogasawara S., Palmer D., Verslype C., Zagonel V., Fartoux L., Vogel A., et al. Pembrolizumab in patients with advanced hepatocellular carcinoma previously treated with sorafenib (KEYNOTE-224): a non-randomised, open-label phase 2 trial. Lancet Oncol. 2018;19:940–952. doi: 10.1016/S1470-2045(18)30351-6. - DOI - PubMed
    1. Finn R.S., Qin S., Ikeda M., Galle P.R., Ducreux M., Kim T.Y., Kudo M., Breder V., Merle P., Kaseb A.O., et al. Atezolizumab plus Bevacizumab in Unresectable Hepatocellular Carcinoma. N. Engl. J. Med. 2020;382:1894–1905. doi: 10.1056/NEJMoa1915745. - DOI - PubMed
    1. Llovet J.M., Castet F., Heikenwalder M., Maini M.K., Mazzaferro V., Pinato D.J., Pikarsky E., Zhu A.X., Finn R.S. Immunotherapies for hepatocellular carcinoma. Nat. Rev. Clin. Oncol. 2022;19:151–172. doi: 10.1038/s41571-021-00573-2. - DOI - PubMed

Publication types

Associated data