. 2024 Feb 20;5(2):101420.
doi: 10.1016/j.xcrm.2024.101420.

PD-L1-expressing tumor-associated macrophages are immunostimulatory and associate with good clinical outcome in human breast cancer

Affiliations

PD-L1-expressing tumor-associated macrophages are immunostimulatory and associate with good clinical outcome in human breast cancer

Lei Wang et al. Cell Rep Med. .

Abstract

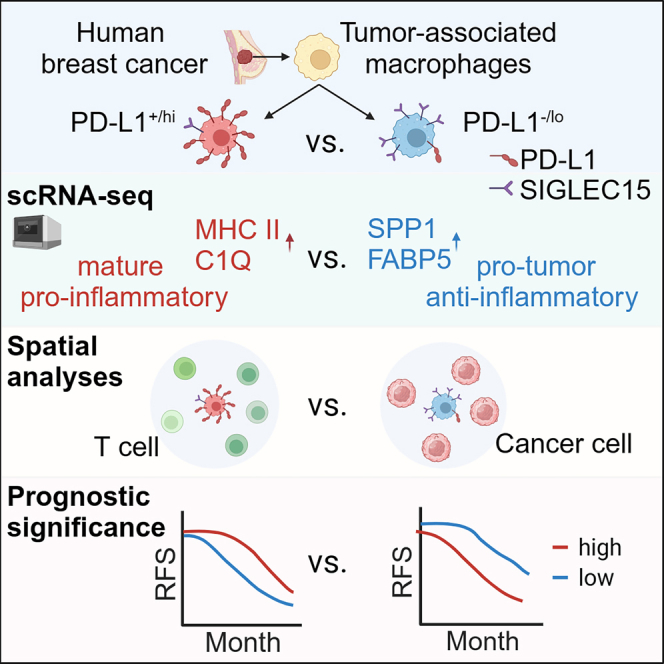
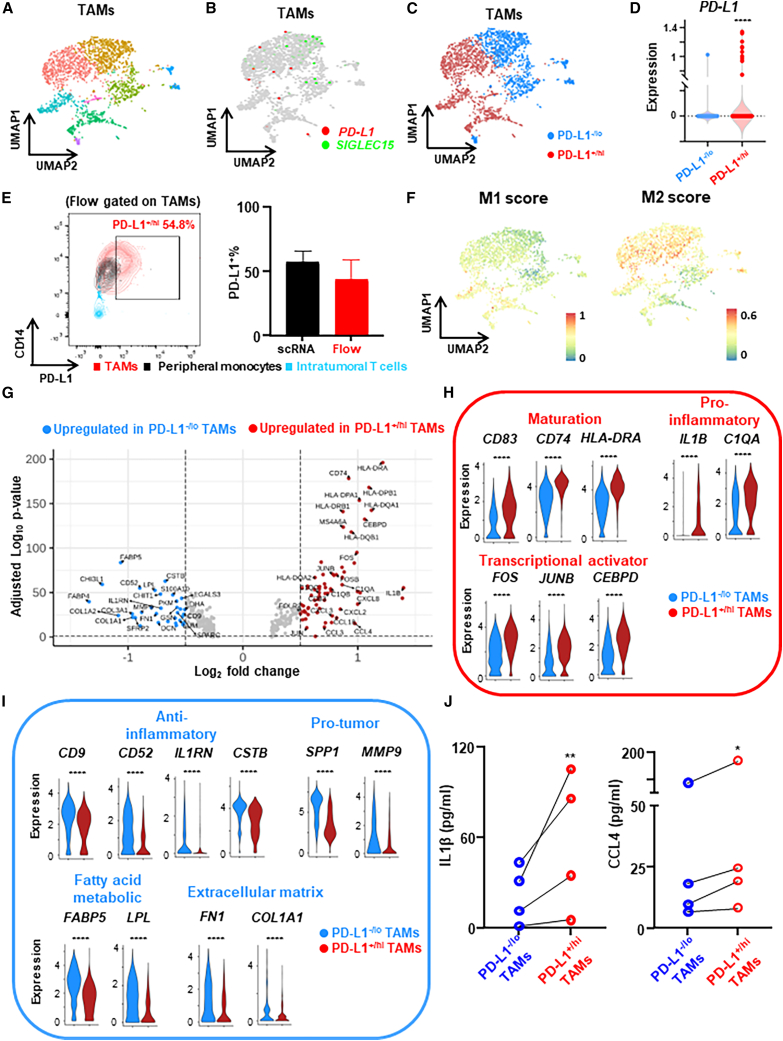
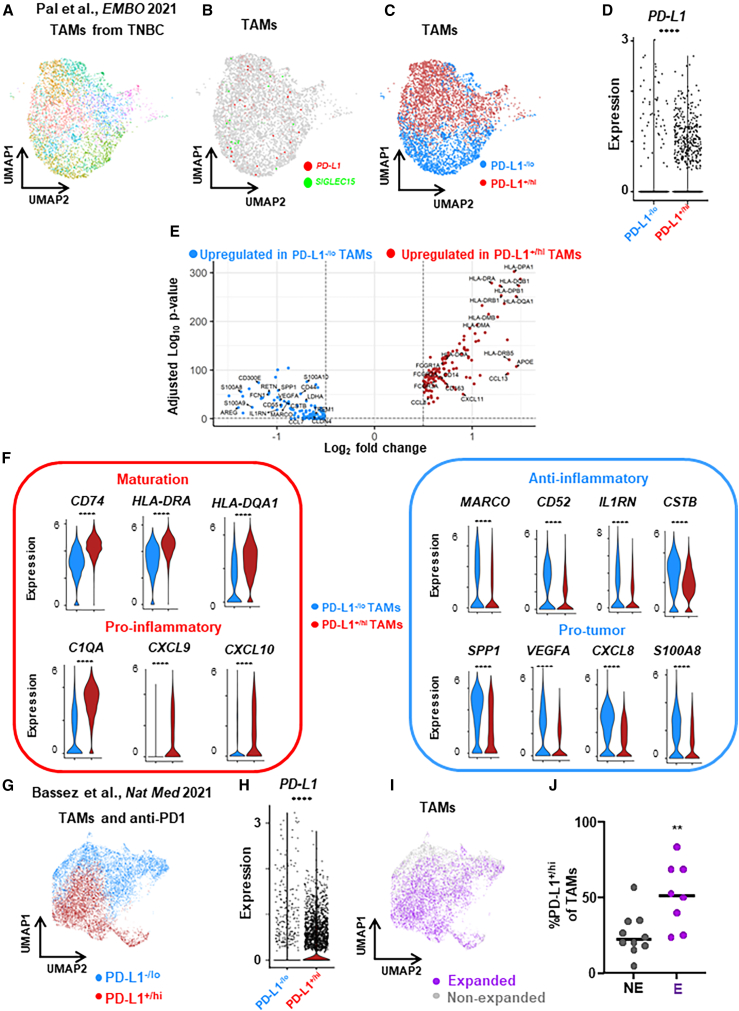
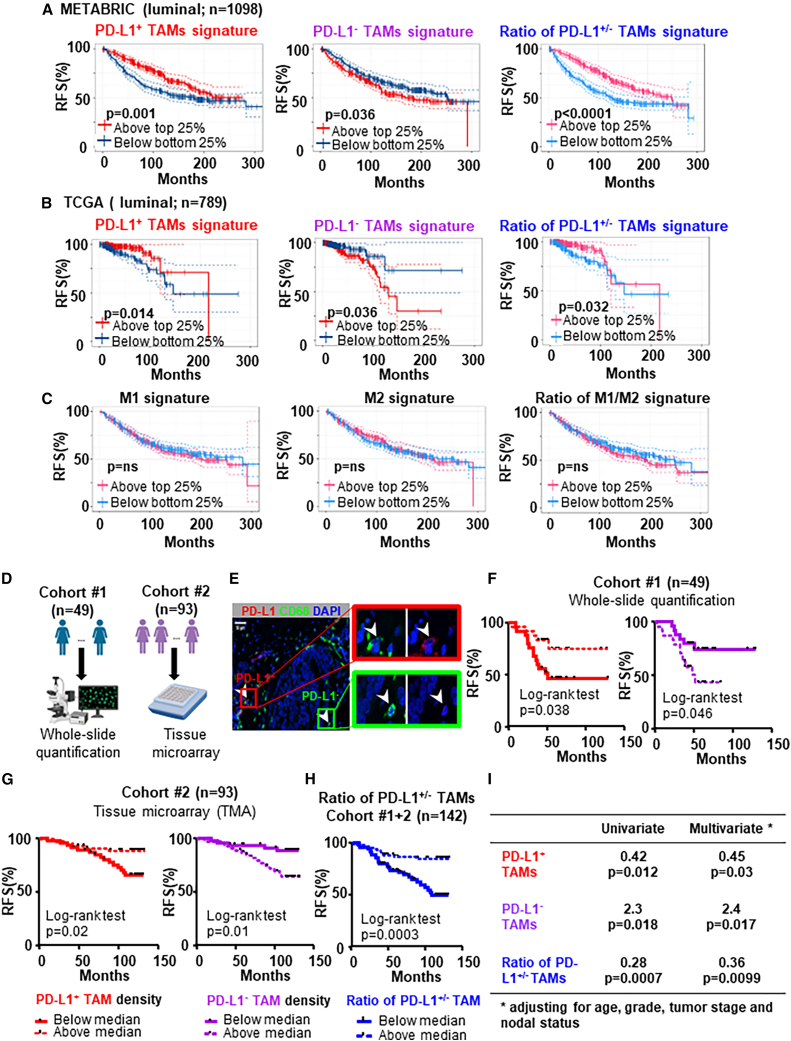
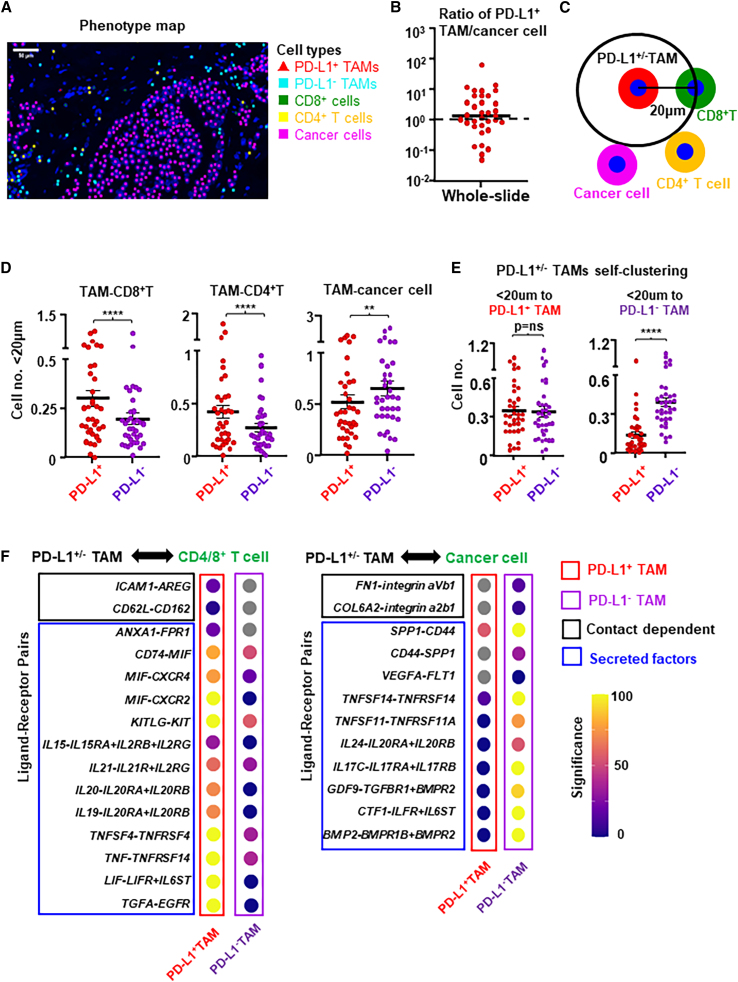
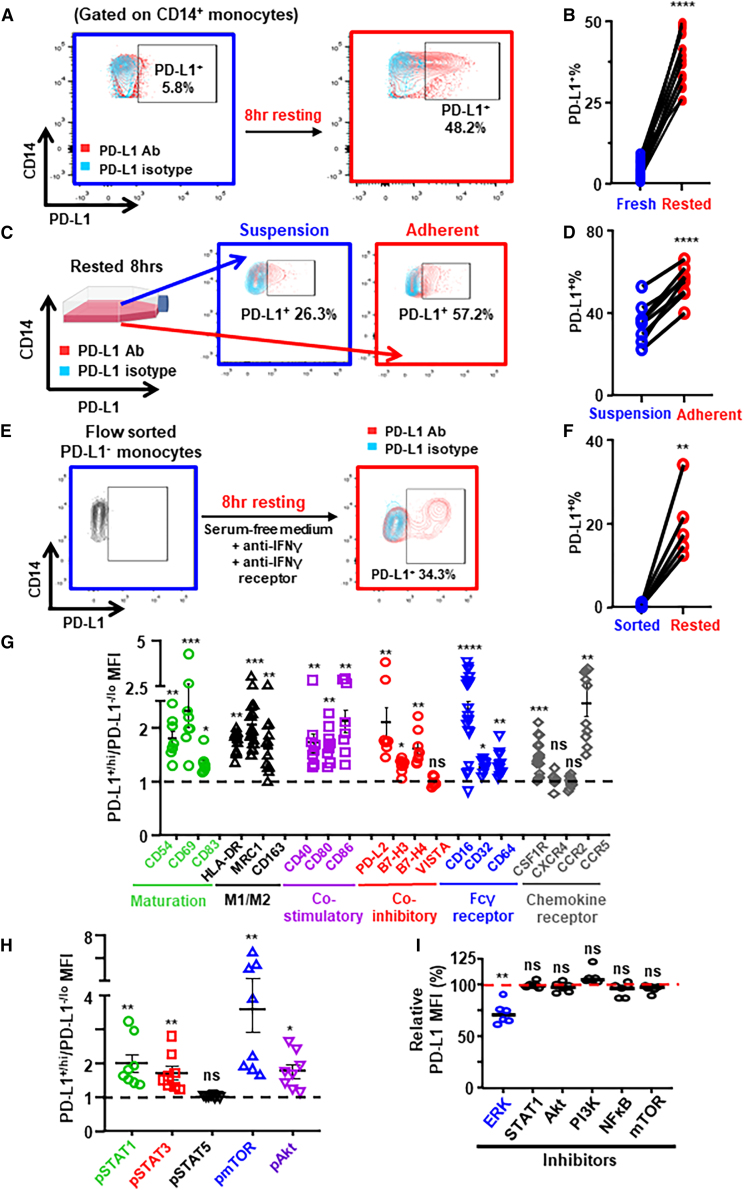
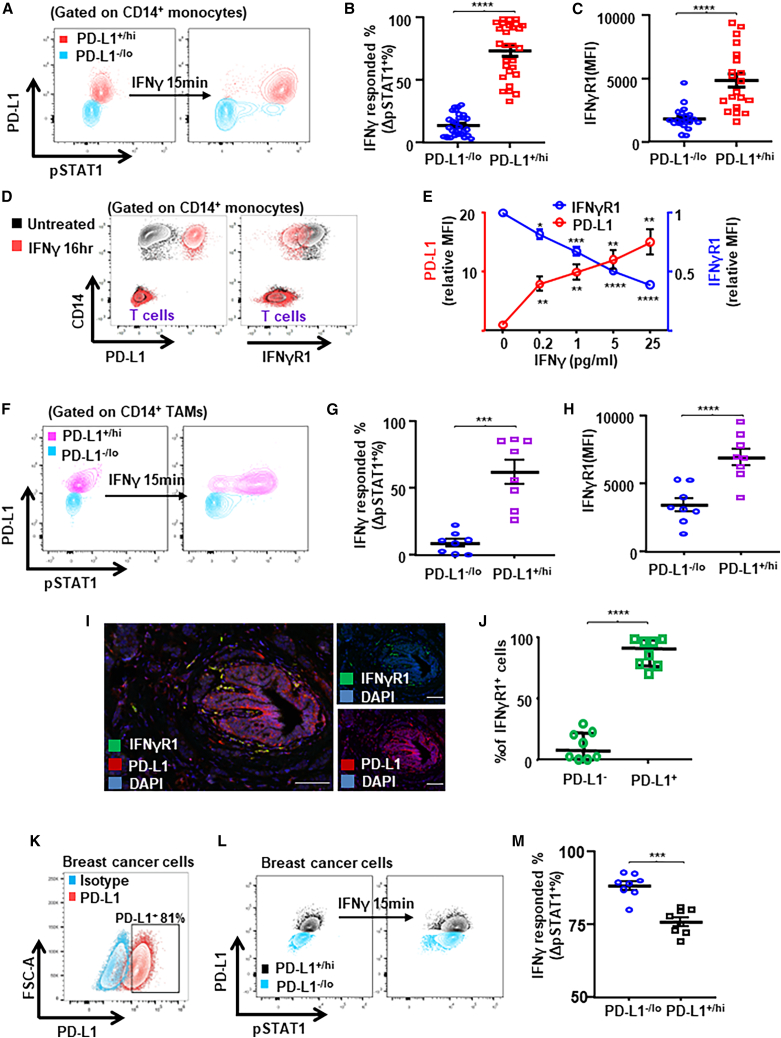
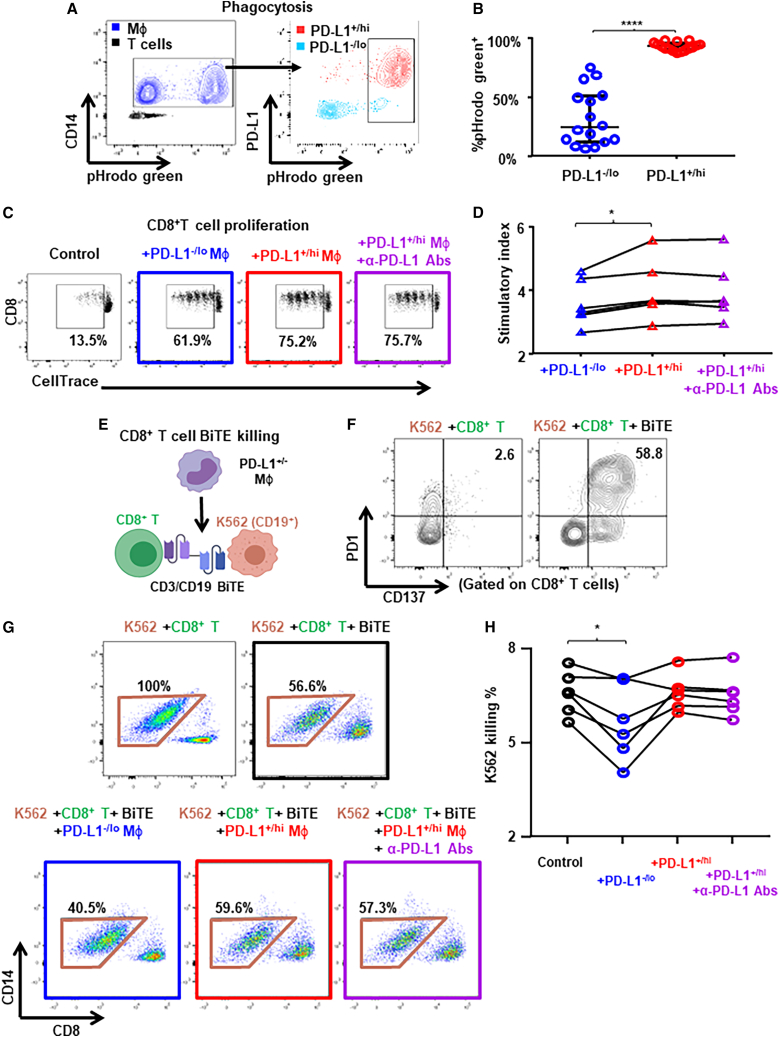
Tumor-associated macrophages (TAMs) are the predominant cells that express programmed cell death ligand 1 (PD-L1) within human tumors in addition to cancer cells, and PD-L1+ TAMs are generally thought to be immunosuppressive within the tumor immune microenvironment (TIME). Using single-cell transcriptomic and spatial multiplex immunofluorescence analyses, we show that PD-L1+ TAMs are mature and immunostimulatory with spatial preference to T cells. In contrast, PD-L1- TAMs are immunosuppressive and spatially co-localize with cancer cells. Either higher density of PD-L1+ TAMs alone or ratio of PD-L1+/PD-L1- TAMs correlate with favorable clinical outcome in two independent cohorts of patients with breast cancer. Mechanistically, we show that PD-L1 is upregulated during the monocyte-to-macrophage maturation and differentiation process and does not require external IFN-γ stimulus. Functionally, PD-L1+ TAMs are more mature/activated and promote CD8+ T cells proliferation and cytotoxic capacity. Together, our findings reveal insights into the immunological significance of PD-L1 within the TIME.


Conflict of interest statement

Declaration of interests The authors declare no competing interests.

Figures

None
Graphical abstract
Figure 1
Figure 1
Expression profile differences between PD-L1+/hi vs. PD-L1–/lo TAMs from human breast tumors revealed by scRNA-seq (A) scRNA-seq analysis of TAMs (n = 2,220 cells) from untreated primary breast tumor (n = 5 patients, ER+) shown as a UMAP, highlighting identified clusters. (B) UMAP showing mutually exclusive expression of PD-L1 and SIGLEC15 in TAMs. (C) Dichotomization of TAM clusters into PD-L1+/hi and PD-L1–/lo subpopulations. (D) PD-L1 expression of PD-L1+/hi and PD-L1–/lo subpopulations. (E) Representative flow cytometry plot showing PD-L1+% TAMs, peripheral monocytes, and intratumoral T cells from the same tumor tissue used for scRNA-seq (left panel), and PD-L1+% quantification was compared between analysis via scRNA-seq and flow cytometry (right panel). (F) Overlay of the expression of common M1 and M2 signature genes in the PD-L1+/hi vs. PD-L1–/lo TAM dichotomization. (G) Volcano plot showing differentially expressed genes (DEGs) between PD-L1+/hi vs. PD-L1–/lo TAMs. (H and I) Expression distribution of selected genes involved in maturation, pro-inflammatory or transcriptional activator (H), and anti-inflammatory, pro-tumor, fatty acid metabolic, or extracellular matrix (I) between PD-L1+/hi and PD-L1–/lo TAMs. ∗∗∗∗p < 0.0001. Wilcoxon rank-sum test. (J) PD-L1+/hi and PD-L1–/lo TAMs were flow sorted from freshly prepared single-cell suspension of digested breast tumor (n = 4) and supernatants were collected for ELISA after 16 h. Paired t test. ∗p < 0.05, ∗∗p < 0.01.
Figure 2
Figure 2
Expression profile of PD-L1+/− TAMs from patients with TNBC revealed by published scRNA-seq data (A) Published (Pal et al.27) scRNA-seq transcriptomic clustering of TAMs (n = 4,484 cells) from untreated primary TNBC breast tumors shown as a UMAP. (B) Mutually exclusive expression of PD-L1 and SIGLEC15 in TAMs. (C) Dichotomization of TAM clusters into PD-L1+/hi and PD-L1–/lo subpopulations. (D) PD-L1 expression of PD-L1+/hi and PD-L1–/lo subpopulations. (E) Volcano plot showing differentially expressed genes (DEGs) between PD-L1+/hi vs. PD-L1−/lo TAMs. (F) Expression distribution of selected genes involved in maturation, pro-inflammatory, anti-inflammatory, and pro-tumor between PD-L1+/hi and PD-L1–/lo TAMs. (G) Published (Bassez et al.28) scRNA-seq transcriptomic clustering and dichotomization of TAMs (n = 12,952 cells) from patients with TNBC treated with neoadjuvant anti-PD1 immunotherapy into PD-L1+/hi and PD-L1–/lo subpopulations. (H) PD-L1 expression of PD-L1+/hi and PD-L1–/lo subpopulations. ∗∗∗∗p < 0.0001. Wilcoxon rank-sum test. (I) TAMs were annotated based on whether patients exhibited clonal expansion of intratumoral PD1+ T cells after the anti-PD1 treatment as expanded or non-expanded. (J) The percentages of PD-L1+/hi TAMs were compared between tumors with anti-PD1-induced expanded vs. non-expanded clonal PD1+ T cells. ∗∗p < 0.01. Mann-Whitney test.
Figure 3
Figure 3
PD-L1+ TAMs are associated with favorable clinical outcome in two independent cohorts of patients with BC (A and B) Kaplan-Meier relapse-free survival (RFS) curves and log rank test generated for the gene signature of PD-L1+ vs. PD-L1 TAMs or the gene signature ratio of PD-L1+/PD-L1 TAMs in the luminal BC cohorts of METABRIC (n = 1098) (A) and TCGA (n = 789) (B) datasets. (C) Kaplan-Meier analyses for the M1, M2, or the ratio of M1/M2 gene signature in the luminal BC cohorts of METABRIC (n = 1098). Patients were divided into high- and low-expressing groups based on a 25% cutoff of the gene signature. (D) Schematic summarizing the histological quantification method in cohorts 1 and 2 of patients with luminal BC. (E) Representative immunofluorescence staining of PD-L1, CD68, and DAPI to identify PD-L1+ and PD-L1 TAMs. (F–H) Using Kaplan-Meier estimate and log-rank test, relapse-free survival (RFS) was compared between patients with low and high density of PD-L1+ TAMs in cohort 1 (n = 49) (F) and in cohort 2 (n = 93) (G) or low and high density ratio of PD-L1+/PD-L1 TAMs in combined cohorts 1 and 2 (n = 142) (H). Median density was used as the cutoff to divide patients into low vs. high groups. (I) Univariate and multivariate analysis for the prognostic significance of the density ratio of PD-L1+/PD-L1 TAMs. Hazard ratio calculated with below medium vs. above medium (n = 142).
Figure 4
Figure 4
PD-L1+ and PD-L1 TAMs have different cell-to-cell interaction preferences (A) Multiple immunofluorescence staining and corresponding phenotype map of representative breast tumor tissue section for PD-L1+ TAMs (CD68+PD-L1+), PD-L1 TAMs (CD68+PD-L1), CD8+ T cells (CD8+), CD4+ T cells (CD3+CD8), and cancer cells (CK+). (B) Whole-slide quantification of the ratio of PD-L1+ TAMs/cancer cells in total area. (C) Schematic representing the calculation of cell-cell interaction based on CD8+ T cells, CD4+ T cells, or cancer cells within a radius of 20 μm from the nuclei of PD-L1+ or PD-L1 TAMs. (D) CD8+ T cells, CD4+ T cells, or cancer cells within a radius of 20 μm from the nuclei of PD-L1+ or PD-L1 TAMs in untreated primary luminal breast tumors (n = 36). ∗∗∗∗p < 0.0001, ∗∗p < 0.01. Wilcoxon paired test. (E) The number of TAMs within 20 μm to PD-L1+ TAMs (left) or PD-L1 TAMs (right) (n = 36). Paired t test. ∗∗∗∗p < 0.0001. (F) Dot plots of ligand-receptor interactions between PD-L1+ or PD-L1 TAMs and CD4/8+ T cells (left panel), and cancer cells (right panel) based on our scRNA-seq transcriptomic analysis. Gray dot represents no significant interaction was found.
Figure 5
Figure 5
PD-L1 is upregulated during the monocyte-macrophage maturation/differentiation process (A and B) Freshly isolated PBMCs from newly diagnosed patients with BC (n = 12) were ex vivo rested in RPMI 1640 with 10% FBS for 8 h. PD-L1+% peripheral blood monocytes are shown in representative flow plots (A) and compared between fresh vs. rested monocytes (B). (C and D) PD-L1+% between in suspension vs. adherent monocytes after 8 h resting (n = 8) are shown in representative flow plots (C) and compared (D). (E and F) PD-L1+% monocytes between flow sorted fresh PBMCs vs. 8 h rested PBMCs (n = 5) are shown in representative flow plots (E) and compared (F). Paired t test. (G and H) MFI ratio of surface protein levels (G) and phosphorylated signal transduction protein levels (H) on PD-L1+ vs. PD-L1 monocytes in 8 h rested PBMCs from patients with BC. Wilcoxon paired test. (I) Peripheral blood monocytes from patients with BC (n = 6) were treated with small-molecule inhibitors (Selleck) against ERK1/2 (SCH772984 at 0. 5 μM), STAT1 (fludarabine at 50 μM), Akt1/2/3 (MK-2206 2HCl at 0.5 μM), PI3Kα/δ/β (LY294002 at 5 μM), NF-κB (QNZ at 5 μM), and mTOR (rapamycin at 0.1 μM) during the 8 h resting. ∗p < 0.05, ∗∗p < 0.01, ∗∗∗p < 0.001, ∗∗∗p < 0.0001. Shown are mean ± SEM.
Figure 6
Figure 6
PD-L1 upregulation in TAMs could be IFN-γ independent (A–C) PBMCs from patients with BC were rested and stimulated with IFN-γ. Representative flow plots showing IFN-γ (50 ng/mL for 15 min) induced phosphorylation of STAT1 (pY701) in peripheral monocytes (A) from patients with BC. IFN-γ signaling response (n = 28) (B) and levels of IFN-γR1 (n = 20) (C) were compared between PD-L1–/lo vs. PD-L1+/hi monocytes. (D and E) Rested PBMCs from patients with BC were stimulated with IFN-γ at 0.2, 1, 5, or 25 ng/mL for 16 h. Levels of PD-L1 and IFN-γR1 on monocytes or T cells are shown in the representative flow plots (D) and compared (n = 6) (E). One-way ANOVA. (F–H) Single-cell suspensions from freshly prepared primary breast tumors were stimulated with IFN-γ. Representative flow plots (F) showing IFN-γ-induced pSTAT1 (G) and levels of IFN-γR1 (H) between PD-L1–/lo vs. PD-L1+/hi TAMs from untreated primary breast tumors (n = 8). (I and J) Multiplex immunofluorescence staining (I) and quantification of IFN-γR1+ PD-L1+/− cells (J) from untreated primary breast tumor tissues (n = 8). Scale bars, 100 μm. (K–M) Representative flow plots showing PD-L1 expression (K) and IFN-γ-induced pSTAT1 (L) and levels of IFN-γR1 (M) between PD-L1–/lo vs. PD-L1+/hi breast cancer cells (n = 8). Paired t test. ∗∗p < 0.01, ∗∗∗p < 0.001, ∗∗∗∗p < 0.0001. Shown are mean ± SEM.
Figure 7
Figure 7
PD-L1+ TAMs are more activated and pro-inflammatory than PD-L1 TAMs (A and B) PBMCs from patients with BC (n = 16) were rested and the phagocytosis capacity of monocytes/macrophages were determined by using pHrodo Green E. Coli Bioparticles conjugate as shown in the representative flow plots (A) and compared between PD-L1–/lo vs. PD-L1+/hi monocytes/macrophages (B). Paired t test. (C and D) Freshly isolated PBMCs from patients with BC (n = 6) were rested and the PD-L1+/− monocytes were flow sorted. CellTrace Violet dilution by CD8+ T cells determined after 4 days of TCR-stimulated coculture with autologous PD-L1+ vs. PD-L1 monocytes/macrophages. (C) Representative flow plots showing percentage of proliferated CD8+ T cells. (D) Proliferation stimulation activity measured by cell number ratio of (CD8/CD4+CD14)/(CD8/CD4) as the stimulatory index. (E–H) Freshly isolated PBMCs from patients with BC (n = 6) were rested and the PD-L1+/− monocytes were flow sorted. Cytotoxic activity of CD8+ T cells determined using CD19/CD3 bispecific antibody (BiTE) after 2 days of coculture with CD19+ K562 cancer cells in the presence of autologous PD-L1+ or PD-L1 monocytes/macrophages. (E) Schematic representing the experiment setup. (F) Representative flow plots showing PD1 and CD137 expression on CD8+ T cells. (H) Cytotoxic activity calculated by the percentage of K562 cells killed by CD8+ T cells as shown in representative flow plots (G). One-way ANOVA. ∗p < 0.05, ∗∗∗∗p < 0.0001. Shown are mean ± SEM.

References

    1. Ma R.Y., Black A., Qian B.Z. Macrophage diversity in cancer revisited in the era of single-cell omics. Trends Immunol. 2022;43:546–563. doi: 10.1016/j.it.2022.04.008. - DOI - PubMed
    1. Mantovani A., Allavena P., Marchesi F., Garlanda C. Macrophages as tools and targets in cancer therapy. Nat. Rev. Drug Discov. 2022;21:799–820. doi: 10.1038/s41573-022-00520-5. - DOI - PMC - PubMed
    1. Vesely M.D., Zhang T., Chen L. Resistance Mechanisms to Anti-PD Cancer Immunotherapy. Annu. Rev. Immunol. 2022;40:45–74. doi: 10.1146/annurev-immunol-070621-030155. - DOI - PubMed
    1. Liu Y., Zugazagoitia J., Ahmed F.S., Henick B.S., Gettinger S.N., Herbst R.S., Schalper K.A., Rimm D.L. Immune Cell PD-L1 Colocalizes with Macrophages and Is Associated with Outcome in PD-1 Pathway Blockade Therapy. Clin. Cancer Res. 2020;26:970–977. doi: 10.1158/1078-0432.Ccr-19-1040. - DOI - PMC - PubMed
    1. Lau J., Cheung J., Navarro A., Lianoglou S., Haley B., Totpal K., Sanders L., Koeppen H., Caplazi P., McBride J., et al. Tumour and host cell PD-L1 is required to mediate suppression of anti-tumour immunity in mice. Nat. Commun. 2017;8 doi: 10.1038/ncomms14572. - DOI - PMC - PubMed

Publication types

Associated data