. 2024 Feb 26;4(2):100711.
doi: 10.1016/j.crmeth.2024.100711. Epub 2024 Feb 20.

Long-term, high-resolution in vivo calcium imaging in pigeons

Affiliations

Long-term, high-resolution in vivo calcium imaging in pigeons

Simon Nimpf et al. Cell Rep Methods. .

Abstract

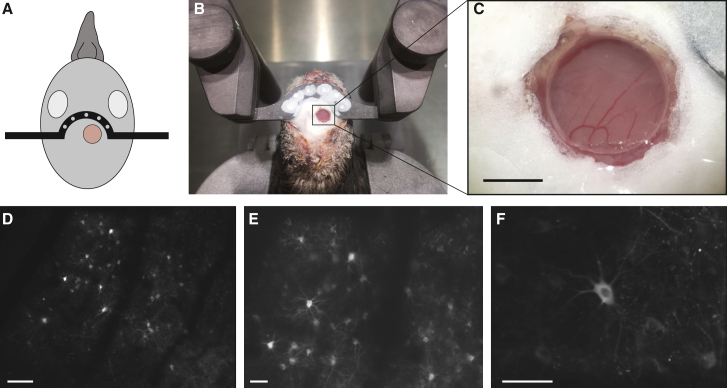
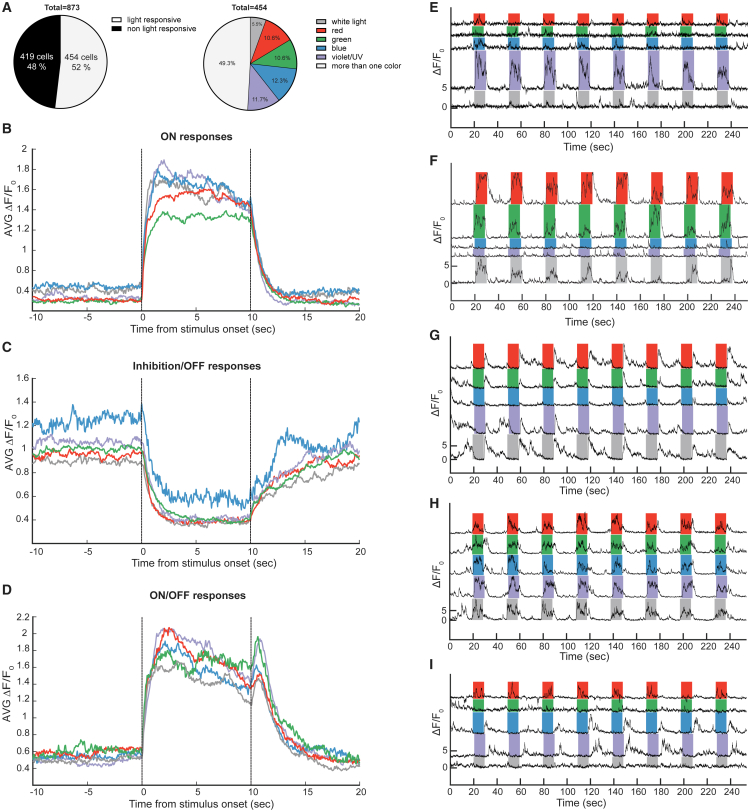
In vivo 2-photon calcium imaging has led to fundamental advances in our understanding of sensory circuits in mammalian species. In contrast, few studies have exploited this methodology in birds, with investigators primarily relying on histological and electrophysiological techniques. Here, we report the development of in vivo 2-photon calcium imaging in awake pigeons. We show that the genetically encoded calcium indicator GCaMP6s, delivered by the adeno-associated virus rAAV2/7, allows high-quality, stable, and long-term imaging of neuronal populations at single-cell and single-dendrite resolution in the pigeon forebrain. We demonstrate the utility of our setup by investigating the processing of colors in the visual Wulst, the avian homolog of the visual cortex. We report that neurons in the Wulst are color selective and display diverse response profiles to light of different wavelengths. This technology provides a powerful tool to decipher the operating principles that underlie sensory encoding in birds.

Keywords: CP: Imaging; CP: Neuroscience; calcium imaging; pigeons; section: 2-photon microscopy; visual processing.


Conflict of interest statement

Declaration of interests The authors declare no competing interests.

Figures

None
Graphical abstract
Figure 1
Figure 1
In vivo 2-photon calcium imaging setup and viral delivery of GCaMP6s in the pigeon dorsal forebrain (A) The calcium imaging setup consists of a resonant scanning 2-photon microscope, a femtosecond-pulsed laser, an animal stage, and an LED wall facing the pigeon. The inset shows a custom-made device, which can be attached to the microscope objective to prevent light contamination. (B) The bird is immobilized under the microscope using a 3D-printed body harness and two head clamps. (C) Schematic of the pigeon forebrain showing the location of viral injection (left) and a corresponding brain section showing GCaMP6s expression 3 weeks after AAV injection stained with a GFP antibody (right). (D and E) Double staining using antibodies against GFP (green) and the pan-neuronal marker NeuN (red). (F) Graph showing the percentage of GFP/NeuN double-positive neurons in a defined region around the injection site of 3 birds (3 sections per bird). Data are presented as mean ± SEM. Scale bars: 1 mm in (C), 200 μm in (D), and 50 μm in (E). Hp, hippocampus; N, nidopallium; A, arcopallium. See also Figures S1 and S2.
Figure 2
Figure 2
Optical window implantation for long-term in vivo 2-photon calcium imaging (A and B) Top-down view on the pigeon head showing an implanted optical window (4 mm diameter) for 2-photon calcium imaging and a head bar attached to the skull to restrain the head under the microscope with 2 clamps. (C) Zoom in on the optical window showing the brain surface and vasculature underneath the implanted window. (D–F) Average intensity projections of imaging sessions acquired in resonant scanning mode showing that the system is capable of imaging large FOVs of up to 1 × 0.8 mm using low-magnification settings (D) and (E) and small FOVs focusing on single cells and individual dendrites using high-magnification settings (F). Scale bars: 2 mm in (C), 100 μm in (D), and 50 μm in (E) and (F). See also Figures S3–S5 and Videos S1, S2, and S3.
Figure 3
Figure 3
In vivo 2-photon calcium imaging in the hippocampus of awake pigeons (A) In vivo 2-photon imaging of GCaMP6s-positive neurons in the awake pigeon hippocampus. (B) Average intensity projection of an imaging session performed in darkness with no stimulation. (C) Calcium dynamics of individual neurons (ΔF/F0). The colors correspond to the colored circles in (B). Scale bar: 100 μm in (B). See also Videos S1, S2, and S3.
Figure 4
Figure 4
In vivo 2-photon calcium imaging in the visual Wulst of awake pigeons (A) In vivo 2-photon imaging of GCaMP6s-positive neurons in the awake pigeon visual Wulst. (B) Average intensity projection of an imaging session performed in darkness with no stimulation. (C) Calcium dynamics of individual neurons (ΔF/F0). The colors correspond to the colored circles in (B). Scale bar: 100 μm in (B). See also Videos S1, S2, and S3.
Figure 5
Figure 5
Light-driven responses in neurons of the pigeon visual Wulst (A) Pie charts showing the percentages of cells that were responsive to light. In total, 873 cells were analyzed, out of which 454 (52%) were responsive to at least one light stimulus (p < 0.05, Kruskal-Wallis test with Dunn’s correction). Out of those 454 responsive cells, 50.7% were selectively tuned to specific wavelengths (11.7% violet/UV, 12.3% blue, 10.6% green, 10.6% red, 5.5% white light), and 49.3% showed significant responses to more than one light stimulus. (B–D) Characterization of population response profiles. Graphs display the average change of fluorescence (ΔF/F) for all ON (B), Inhibition/OFF (C), and ON/OFF (D) responses. 46% of responses were classified as ON, 38% as Inhibition/OFF, and 16% as ON/OFF. (E) Example of an ON neuron that is selectively tuned to violet/UV light. (F) Example of an ON neuron tuned to red and green light. (G) Example of a neuron displaying Inhibition/OFF responses to all chromatic stimuli. (H) Example of a neuron displaying ON/OFF responses to all chromatic stimuli. (I) Example of a neuron displaying color-opponent responses showing ON responses to red stimuli and Inhibition/OFF responses to blue and violet/UV stimuli. Calcium dynamics of individual cells are shown as ΔF/F0.

References

    1. Nieder A., Wagener L., Rinnert P. A neural correlate of sensory consciousness in a corvid bird. Science. 2020;369:1626–1629. doi: 10.1126/science.abb1447. - DOI - PubMed
    1. Ben-Yisahay E., Krivoruchko K., Ron S., Ulanovsky N., Derdikman D., Gutfreund Y. Directional tuning in the hippocampal formation of birds. Curr. Biol. 2021;31:2592–2602.e2594. doi: 10.1016/j.cub.2021.04.029. - DOI - PubMed
    1. Payne H.L., Lynch G.F., Aronov D. Neural representations of space in the hippocampus of a food-caching bird. Science. 2021;373:343–348. doi: 10.1126/science.abg2009. - DOI - PMC - PubMed
    1. Clark W.J., Colombo M. The functional architecture, receptive field characteristics, and representation of objects in the visual network of the pigeon brain. Prog. Neurobiol. 2020;195 doi: 10.1016/j.pneurobio.2020.101781. - DOI - PubMed
    1. Levenson R.M., Krupinski E.A., Navarro V.M., Wasserman E.A. Pigeons (Columba livia) as trainable observers of pathology and radiology breast cancer images. PLoS One. 2015;10 - PMC - PubMed

LinkOut - more resources