. 2024 Feb 29;187(5):1160-1176.e21.
doi: 10.1016/j.cell.2024.01.032. Epub 2024 Feb 20.

Structural mechanisms of α7 nicotinic receptor allosteric modulation and activation

Affiliations

Structural mechanisms of α7 nicotinic receptor allosteric modulation and activation

Sean M Burke et al. Cell. .

Abstract

The α7 nicotinic acetylcholine receptor is a pentameric ligand-gated ion channel that plays an important role in cholinergic signaling throughout the nervous system. Its unique physiological characteristics and implications in neurological disorders and inflammation make it a promising but challenging therapeutic target. Positive allosteric modulators overcome limitations of traditional α7 agonists, but their potentiation mechanisms remain unclear. Here, we present high-resolution structures of α7-modulator complexes, revealing partially overlapping binding sites but varying conformational states. Structure-guided functional and computational tests suggest that differences in modulator activity arise from the stable rotation of a channel gating residue out of the pore. We extend the study using a time-resolved cryoelectron microscopy (cryo-EM) approach to reveal asymmetric state transitions for this homomeric channel and also find that a modulator with allosteric agonist activity exploits a distinct channel-gating mechanism. These results define mechanisms of α7 allosteric modulation and activation with implications across the pentameric receptor superfamily.

Keywords: cryo-EM; electrophysiology; ligand-gated ion channel; molecular dynamics; neurotransmitter receptor; nicotinic acetylcholine receptor; positive allosteric modulator; structural biology; structure-guided drug design.


Conflict of interest statement

Declaration of interests The authors declare no competing interests.

Figures
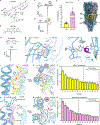
Figure 1:
Figure 1:. Type I PAM potentiation characteristics and binding sites.
(A-B) Chemical structure of (A) ivermectin (IVM) and (B) NS1738. (C) Representative two-electrode voltage clamp (TEVC) trace showing response of WT α7 to a 10 second application of 100 μM ACh and a 20 second application of 100 μM ACh+30 μM IVM. IVM was pre-applied for 50 seconds. (D) Representative TEVC trace showing response of WT α7 to a 10 second application of 100 μM ACh and a 20 second application of 100 μM ACh+10 μM NS1738. NS1738 was pre-applied for 20 seconds. (E) Bar graph displaying apparent fold potentiation of ACh+IVM (yellow) and ACh+NS1738 (pink) on WT α7. Data are represented as mean ± SEM (n=5 for IVM and n=6 for NS1738). (F) Cryo-EM map of α7-epi/IVM complex depicting the neurotransmitter and modulator binding sites. The subunit on the left is the principal or (+) subunit and is colored dark blue. The subunit on the right is the complementary or (−) subunit and is colored light blue. The neurotransmitter binding site is boxed in red and the modulator binding site is boxed in yellow. IVM density is colored yellow. (G) Top, chemical structure of the traditional agonist epibatidine (epi) and bottom, response of WT α7 to a 10 second application of 10 μM epi. (H) Side view of the epi binding site. Epi is shown in purple and its density in transparent grey. Interacting residues are shown as sticks. (I) View of (H), rotated 90°. (J) Side view of the IVM’s binding site. IVM is colored yellow, and its density in transparent grey. Interacting residues are shown as sticks. (K) Top view of (J). (L) Bar graph showing the top 15 interaction energies during an MD simulation of the α7-epi/IVM complex. The energy value is averaged over 5 binding sites and 3 independent replicates. Residues to the left side of the dotted line represent 50% of the total interaction energy. M2 helix residues are colored in red. (M) Side view of NS1738’s binding site. NS1738 is colored pink and its density is shown in transparent grey. Interacting residues are represented as sticks. (N) Top view of (M). (O) Same as (L), but for α7-epi/NS1738. See also Figures S1, S2, S3, and S4.
Figure 2:
Figure 2:. Type II PAM potentiation characteristics and binding sites.
(A-B) Chemical structure of (A) PNU-120596 (PNU) and (B) (−)-TQS (TQS). (C-D) Representative TEVC trace showing the response of WT α7 to a 10 second application of 100 μM ACh and a 20 second application of 100 μM ACh+10 μM PAM. For the potentiated response, PAM was pre-applied for 10 seconds before co-application of ACh+PAM. (C) PNU, (D) TQS. (E) Superposition of WT α7 response to ACh alone (black) and ACh+PNU (green, top) or ACh+TQS (salmon, bottom). (F) Cryo-EM map of α7-epi/PNU complex. The intersubunit binding site is boxed in yellow and PNU density is colored yellow. The + subunit is in dark blue and the − subunit is in light blue. (G) Side view of the PNU binding site. PNU is colored green with its corresponding density in transparent grey. The residues interacting with PNU are shown as sticks. Lipid molecules are hidden for clarity. See also Figures S3 and S4. (H) Top view of (G). (I) Bar graph showing the top 15 interactions energies throughout the simulation of the α7-epi/PNU complex. The energy value is averaged over 5 binding sites and 3 independent replicates. Residues to the left of the black line represent 50% of the total binding energy. M2 helix residues are colored red. (J) Side view of the TQS binding site. TQS is colored salmon with its corresponding density in transparent grey. The interacting residues are shown as sticks. Lipid molecules are hidden for clarity. (K) Top view of (J). (L) Same as (I), but for α7-epi/TQS See also Figures S1 and S2.
Figure 3:
Figure 3:. Binding site mutations differentially alter modulator activity.
(A-D) Bar graphs showing apparent fold potentiation from biologically independent replicates n≥3. 100 μM ACh was used for all conditions except N213A and M253A where 300 μM was used due to a decrease in overall channel activity. 10 μM NS1738, TQS, and PNU, and 30 μM IVM was used for all conditions. Statistical significance was determined using a one-way analysis of variance (ANOVA) followed by a Dunnett’s multiple comparison test comparing the mutant and WT. For comparison of two mutants, significance was assessed using an unpaired two-tailed student’s T test. Statistical thresholds were set as ns P>0.05, * P<0.05, ** P<0.01, *** P<0.001, **** P<0.0001. (A) IVM, (B) NS1738, (C) PNU, (D) TQS. (E) Summary table showing apparent mean fold potentiation ± SEM. See also Figure S3.
Figure 4:
Figure 4:. Type I and type II PAMs stabilize distinct pore conformations.
(A-E) Permeation pathway depicting hydrophobicity and pore diameter of (A) α7-epi, (B) α7-epi/IVM, (C) α7-epi/NS1738, (D) α7-epi/TQS, (E) α7-epi/PNU. Top, surface representation of three subunits with two L9ʹ residues shown as sticks and colored tan. The approximate membrane is in light grey. Bottom, two M2 helices with pore diameters (Å) at points of interest indicated by dashed lines. In the α7-epi/TQS complex, the density for L9ʹ suggests multiple conformations, with one pointing into the pore and one rotated out of the pore, we modelled an intermediate conformation. (F-G) Pore profile traces comparing α7-epi and (F) α7-epi/type I PAM or (G) α7-epi/type II PAM complexes with the activated state structure (7KOX). (H-L) Backbone restrained (50 kJ/mol/nm) MD simulations probing pore hydration and ion permeability of the α7 structures. (H) α7-epi, (I) α7-epi/IVM, (J) α7-epi/NS1738, (K) α7-epi/TQS, and (L) α7-epi/PNU. Blue circles represent water and red circles represent sodium ions. Simulations were repeated three times with similar results.
Figure 5:
Figure 5:. Type II PAM complexes reveal L9ʹ rotation and M2 helical backbone distortion.
(A) Overlay of α7-epi (white) and α7-epi/PNU TR desensitized-intermediate (blue) models. (B) Pore view of α7-epi (white) and α7-epi/PNU TR desensitized-intermediate (blue) with TMD helices shown as cylinders and L9ʹ residues as sticks. (C) Pore view of α7-epi/IVM (grey) and α7-epi/PNU TR desensitized-intermediate (blue) with TMD helices shown as cylinders and L9ʹ residues as sticks. (D) Side view of two M2 helices of α7-epi/IVM (grey) and α7-epi/PNU TR desensitized-intermediate (blue). (E)-(H) M2 helices shown as sticks (E) α7-epi, (F) α7-epi/IVM, (G) α7-epi/TQS, and (H) α7-epi/PNU TR desensitized-intermediate. Cryo-EM density is displayed in transparent grey. Right panel shows residues T6ʹ-L16ʹ with side chains and experimental density hidden for clarity. The backbone hydrogen bond distances are in Å. See also Figure S5.
Figure 6:
Figure 6:. L9ʹ rotation underlies modulator activity and channel activation.
(A) View from the channel pore of the α7-epi/PNU model. L9ʹ is rotated out of the pore and buried between T6ʹ and S10ʹ. The – subunit is shown in light blue and + subunit is shown in darker blue. PNU is shown in green. (B) Top view of (A) with PNU hidden. (C) Representative traces of single channel currents (top) and corresponding cluster duration histograms fitted by the sum of exponentials (bottom) for WT, T6ʹA, S10ʹA, and T6ʹA+S10ʹA in the presence of 100 μM ACh. (D) Representative traces of T6ʹA mutant with no agonist (spontaneous channel openings) and in the presence of 10 μM PNU alone (top). Corresponding cluster duration histograms are fitted by the sum of exponentials (bottom). (E) Representative traces and cluster duration histograms for ACh + PAM fitted by the sum of exponentials for WT (top row) and T6ʹA (bottom row). 100 μM ACh + 10 μM NS1738, 10 μM TQS, or 10 μM PNU was used for WT channel recordings and 100 μM ACh + 10 μM NS1738, 10 μM TQS, or 1 μM PNU was used for T6ʹA channel recordings. (F) State diagram inferred from single channel analysis with activated states (O) increased by the mutants in green, and subscripts denoting bound agonist (A) and/or PAM (P). Mutants are noted above equilibria that they likely alter. See also Figure S7.
Figure 7:
Figure 7:. Allosteric agonists exploit an alternative gating cycle.
(A) GAT107 chemical structure. (B) Side view of the GAT107 binding site. + subunit is colored dark blue and the − subunit light blue. GAT107 is shown in dark grey and the cryo-EM density in transparent grey. The interacting residues are shown as sticks. (C) Top view of (B). (D-E) Pore permeation profiles showing hydrophobicity and pore diameter for GAT107 bound structures: (D) α7-GAT107 and (E) α7-epi/GAT107. (F) Pore profile trace of α7-GAT107 (red) and α7-epi/GAT107 (blue) compared with an apo, resting conformation (7EKI) in grey and the putative activated conformation (7KOX) in blue. (G-H) Two M2 helices with pore diameters (Å) at points of interest are indicated by dashed lines. (G) α7-GAT107 and (H) α7-epi/GAT107. (I) Simplified state diagram of ago-PAMs. Red arrows show state diagram for α7 activated by GAT107 alone.

References

    1. Wang H, Yu M, Ochani M, Amella CA, Tanovic M, Susarla S, Li JH, Wang H, Yang H, Ulloa L, et al. (2003). Nicotinic acetylcholine receptor alpha7 subunit is an essential regulator of inflammation. Nature 421, 384–388. 10.1038/nature01339. - DOI - PubMed
    1. Jones IW, and Wonnacott S (2004). Precise localization of alpha7 nicotinic acetylcholine receptors on glutamatergic axon terminals in the rat ventral tegmental area. J Neurosci 24, 11244–11252. 10.1523/jneurosci.3009-04.2004. - DOI - PMC - PubMed
    1. Shen JX, and Yakel JL (2012). Functional α7 nicotinic ACh receptors on astrocytes in rat hippocampal CA1 slices. J Mol Neurosci 48, 14–21. 10.1007/s12031-012-9719-3. - DOI - PMC - PubMed
    1. Elgoyhen AB, Johnson DS, Boulter J, Vetter DE, and Heinemann S (1994). Alpha 9: an acetylcholine receptor with novel pharmacological properties expressed in rat cochlear hair cells. Cell 79, 705–715. 10.1016/0092-8674(94)90555-x. - DOI - PubMed
    1. Séguéla P, Wadiche J, Dineley-Miller K, Dani JA, and Patrick JW (1993). Molecular cloning, functional properties, and distribution of rat brain alpha 7: a nicotinic cation channel highly permeable to calcium. J Neurosci 13, 596–604. 10.1523/jneurosci.13-02-00596.1993. - DOI - PMC - PubMed

MeSH terms

Substances