. 2024 Apr;30(4):1085-1095.
doi: 10.1038/s41591-024-02869-z. Epub 2024 Feb 21.

Highly accurate blood test for Alzheimer's disease is similar or superior to clinical cerebrospinal fluid tests

Affiliations

Highly accurate blood test for Alzheimer's disease is similar or superior to clinical cerebrospinal fluid tests

Nicolas R Barthélemy et al. Nat Med. 2024 Apr.

Abstract

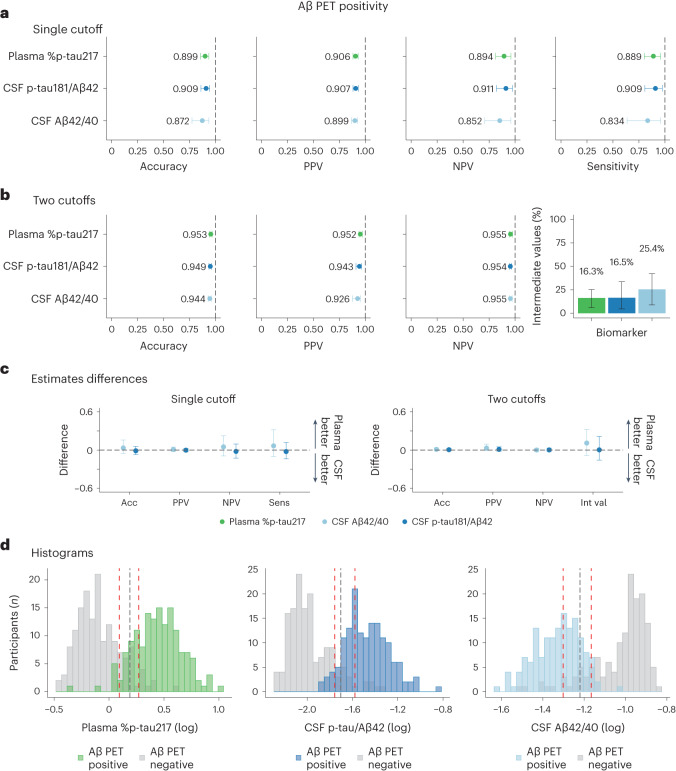
With the emergence of Alzheimer's disease (AD) disease-modifying therapies, identifying patients who could benefit from these treatments becomes critical. In this study, we evaluated whether a precise blood test could perform as well as established cerebrospinal fluid (CSF) tests in detecting amyloid-β (Aβ) plaques and tau tangles. Plasma %p-tau217 (ratio of phosporylated-tau217 to non-phosphorylated tau) was analyzed by mass spectrometry in the Swedish BioFINDER-2 cohort (n = 1,422) and the US Charles F. and Joanne Knight Alzheimer Disease Research Center (Knight ADRC) cohort (n = 337). Matched CSF samples were analyzed with clinically used and FDA-approved automated immunoassays for Aβ42/40 and p-tau181/Aβ42. The primary and secondary outcomes were detection of brain Aβ or tau pathology, respectively, using positron emission tomography (PET) imaging as the reference standard. Main analyses were focused on individuals with cognitive impairment (mild cognitive impairment and mild dementia), which is the target population for available disease-modifying treatments. Plasma %p-tau217 was clinically equivalent to FDA-approved CSF tests in classifying Aβ PET status, with an area under the curve (AUC) for both between 0.95 and 0.97. Plasma %p-tau217 was generally superior to CSF tests in classification of tau-PET with AUCs of 0.95-0.98. In cognitively impaired subcohorts (BioFINDER-2: n = 720; Knight ADRC: n = 50), plasma %p-tau217 had an accuracy, a positive predictive value and a negative predictive value of 89-90% for Aβ PET and 87-88% for tau PET status, which was clinically equivalent to CSF tests, further improving to 95% using a two-cutoffs approach. Blood plasma %p-tau217 demonstrated performance that was clinically equivalent or superior to clinically used FDA-approved CSF tests in the detection of AD pathology. Use of high-performance blood tests in clinical practice can improve access to accurate AD diagnosis and AD-specific treatments.


Conflict of interest statement

N.R.B. and R.J.B. are co-inventors on US patent applications: ‘Methods to detect novel tau species in CSF and use thereof to track tau neuropathology in Alzheimer’s disease and other tauopathies’ and ‘CSF phosphorylated tau and amyloid beta profiles as biomarkers of tauopathies’. N.R.B. and R.J.B. are co-inventors on a non-provisional patent application: ‘Methods of diagnosing and treating based on site-specific tau phosphorylation’. S.E.S. served on a scientific advisory board for Eisai. T.L.S.B. has investigator-initiated research funding from the National Institutes of Health, the Alzheimer’s Association, the Barnes-Jewish Hospital Foundation and Siemens. She participates as a site investigator in clinical trials sponsored by Avid Radiopharmaceuticals, Eli Lilly, Biogen, Eisai, Janssen and Roche. She also serves as a consultant to Biogen, Eli Lilly, Eisai and Siemens. Neither J.C.M. nor his family owns stock or has equity interest (outside of mutual funds or other externally directed accounts) in any pharmaceutical or biotechnology company. O.H. has acquired research support (for the institution) from ADx, Avid Radiopharmaceuticals, Biogen, C2N Diagnostics, Eli Lilly, Eisai, Fujirebio, GE Healthcare, Pfizer and Roche. In the past 2 years, he has received consultancy/speaker fees from AC Immune, Alzpath, BioArctic, Biogen, Bristol Meyer Squibb, Cerveau, Eisai, Fujirebio, Genentech, Merck, Novartis, Novo Nordisk, Roche and Siemens. R.J.B. co-founded C2N Diagnostics. Washington University and R.J.B. have equity ownership interest in C2N Diagnostics and receive royalty income based on technology (stable isotope labeling kinetics, blood plasma assay and methods of diagnosing Alzheimer’s disease with phosphorylation changes) that is licensed by Washington University to C2N Diagnostics. R.J.B. receives income from C2N Diagnostics for serving on the scientific advisory board. R.J.B. has received research funding from Avid Radiopharmaceuticals, Janssen, Roche/Genentech, Eli Lilly, Eisai, Biogen, AbbVie, Bristol Myers Squibb and Novartis. O.H. has acquired research support (for the institution) from ADx, Avid Radiopharmaceuticals, Biogen, C2N Diagnostics, Eli Lilly, Eisai, Fujirebio, GE Healthcare, Pfizer and Roche. In the past 2 years, he has received consultancy/speaker fees from AC Immune, Alzpath, BioArctic, Biogen, Bristol Myers Squibb, Cerveau, Eisai, Eli Lilly, Fujirebio, Merck, Novartis, Novo Nordisk, Roche, Sanofi and Siemens. S.P. has acquired research support (for the institution) from ki:elements / Alzheimerʼs Drug Discovery Foundation. In the past 2 years, he has received consultancy/speaker fees from BioArtic, Biogen, Eli Lilly and Roche. L.E.C. has received research support from GE Healthcare (paid to institution). G.D.R. has received research support from Avid Radiopharmaceuiticals, GE Healthcare, Life Molecular Imaging and Genentech and consulting fees from Alector, Eli Lilly, Johnson & Johnson and Merck and serves as Associate Editor for JAMA Neurology. The other authors have no competing interests.

Figures

Fig. 1
Fig. 1. Concordance of fluid and imaging biomarkers of amyloid and tau pathologies.
a,b,d,e, Concordance of fluid biomarkers with Aβ and tau PET positivity in BioFINDER-2 (a and d) and Knight ADRC (b and e) participants. ROC curves including all participants are included in the first row. AUCs for all, cognitively impaired and cognitively unimpaired groups are shown in the next three columns, respectively. c,f, Bootstrapped differences (n = 1,000 resamples with replacement stratifying by the output) between the statistics using plasma %p-tau217 (reference) and CSF biomarkers are shown in c and f for both the BioFINDER-2 cohort (left) and the Knight ADRC (right) cohort. The horizontal dashed line is plotted at zero, representing the lack of difference between plasma and CSF biomarkers. We considered plasma and CSF biomarkers clinically equivalent if the 95% CI of the mean difference included zero and clinically superior if it did not include zero and favored plasma (>0). Dots and error bars represent the actual statistic and 95% CI (from bootstrapped n = 1,000 samples with replacement), respectively. Vertical dashed lines represent the maximal AUC value possible (1). Aβ PET positivity was assessed as Centiloids ≥ 37. Tau PET positivity was assessed using previously validated in-house thresholds (SUVR > 1.32 in Braak I–IV for both cohorts). AUC, area under the curve; CI, cognitively impaired; CSF, cerebrospinal fluid; CU, cognitively unimpaired; SUVR, standardized uptake value ratio; CI, confidence interval.
Fig. 2
Fig. 2. Comparison among fluid biomarkers on predicting Aβ PET positivity in cognitively impaired patients of the BioFINDER-2 cohort.
a,b, Prediction of Aβ PET positivity in cognitively impaired participants (n = 304) from the BioFINDER-2 cohort, using a single-cutoff (a) and a two-cutoffs (b) approach, respectively. In the first approach, the threshold was calculated, maximizing sensitivity and fixing specificity at 90%. In the second approach, the lower threshold was obtained by maximizing specificity with sensitivity fixed at 95%, whereas the upper threshold was obtained by maximizing sensitivity while fixing specificity at 95%. Participants who fall between these two cutoffs were classified in the intermediate group. Dots and error bars represent the actual statistic and 95% CI (from bootstrapped n = 1,000 samples with replacement), respectively. c, Bootstrapped differences (n = 1,000 resamples with replacement stratifying by the output) between the statistics using plasma %p-tau217 (reference) and CSF biomarkers are shown in c for both single cutoff and two cutoffs. The horizontal dashed line is plotted at zero, representing the lack of difference between plasma and CSF biomarkers. We considered plasma and CSF biomarkers clinically equivalent if the 95% CI of the mean difference included zero and clinically superior if it did not include zero and favored plasma (>0). Differences in the number of participants in the intermediate group were scaled to a maximum of 1 to be comparable with the other differences. Dots and error bars represent the mean and 95% CI estimate from a bootstrapped sample. Vertical dashed lines represent the maximal statistical value possible (1). For the intermediate value plots, colored bars represent the actual percentage and the error bar the 95% CI. d, Histograms represent the distribution of the data colored by the imaging biomarker status. The vertical black line represents the threshold derived from the first approach (a), and red lines represent the lower and upper thresholds from the second approach (b). Aβ PET positivity was assessed as Centiloids ≥ 37. CSF, cerebrospinal fluid; CI, confidence interval; NPV, negative predictive value; PPV, positive predictive value.
Fig. 3
Fig. 3. Comparison among fluid biomarkers on predicting tau PET positivity in cognitively impaired patients of the BioFINDER-2 cohort.
a,b, Prediction of tau PET positivity in cognitively impaired participants from the BioFINDER-2 cohort (n = 663), using a single-cutoff (a) and a two-cutoffs (b) approach, respectively. In the first approach, the threshold was calculated, maximizing sensitivity and fixing specificity at 90%. In the second approach, the lower threshold was obtained by maximizing specificity with sensitivity fixed at 95%, whereas the upper threshold was obtained by maximizing sensitivity and fixing specificity at 95%. Participants who fall between these two cutoffs were classified in the intermediate group. Dots and error bars represent the actual statistic and 95% CI, respectively. Vertical dashed lines represent the maximal statistical value possible (1). For the intermediate value plots, colored bars represent the actual percentage and the error bar the 95% CI. c, Bootstrapped differences (n = 1,000 resamples with replacement stratifying by the output) between the statistics using plasma %p-tau217 (reference) and CSF biomarkers are shown in c for both single cutoff and two cutoffs. The horizontal dashed line is plotted at zero, representing the lack of difference between plasma and CSF biomarkers. We considered plasma and CSF biomarkers clinically equivalent if the 95% CI of the mean difference included zero. Differences in the number of participants in the intermediate group were scaled to a maximum of 1 to be comparable with the other differences. Dots and error bars represent the mean and 95% CI estimate from a bootstrapped sample. d, Histograms represent the distribution of the data colored by the imaging biomarker status. The vertical black line represents the threshold derived from the first approach (a), and red lines represent the lower and upper thresholds from the second approach (b). Tau PET positivity was assessed using an in-house previously validated threshold (SUVR > 1.32). Three individuals were excluded from the histograms in d (only for visualization purposes) due to very low values of plasma %p-tau217. CSF, cerebrospinal fluid; CI, confidence interval; NPV, negative predictive value; PPV, positive predictive value; SUVR, standardized uptake value ratio.
Extended Data Fig. 1
Extended Data Fig. 1. Comparison among fluid biomarkers on predicting Aβ PET visual read positivity in cognitively impaired patients of the BioFINDER-2 cohort with in-bag estimates.
Prediction of Aβ PET visual read positivity in cognitively impaired participants from the BioFINDER-2 cohort, using a single cut-off (a) and two cut-offs (b) approaches, respectively. In the first approach, the cut-off was calculated maximizing sensitivity fixing specificity at 90%. In the second approach, the lower cut-off was obtained by maximizing specificity with sensitivity fixed at 95%, whereas the upper cut-off was obtained by maximizing sensitivity fixing specificity at 95%. Participants that fall between these two cut-offs were classified in the intermediate group. Dots and error bars represent the actual statistic and 95%CI, respectively. Bootstrapped differences (n = 1,000 resamples with replacement stratifying by the output) between the statistics using plasma %p-tau217 (reference) and CSF biomarkers are shown in (c) for both single and two cut-offs. A horizontal dashed line is plotted at zero representing the lack of difference between plasma and CSF biomarkers. We considered plasma and CSF biomarkers clinically equivalent if the 95%CI of the mean difference included zero and clinically superior if it did not include zero and favored plasma (>0). Differences in number of participants in the intermediate group have been scaled to a maximum of one to be comparable to the other differences. Dots and error bars represent the mean and 95%CI estimate from a bootstrapped sample. Vertical dashed lines represent the maximal statistical value possible (1). For the intermediate values plots, coloured bars represent the actual percentage and error bar the 95%CI. Histograms (d) represent the distribution of the data coloured by the imaging biomarker status (coloured represent the positive group). Vertical black line represents the cut-off derived from the first approach (a), and red lines represent the lower and upper cut-offs from the second approach (B). Abbreviations: Aβ, amyloid-β, CI, confidence interval; CSF, cerebrospinal fluid; NPV, negative predictive value; PPV, positive predictive value.
Extended Data Fig. 2
Extended Data Fig. 2. Continuous Aβ and tau PET measures by categorized fluid biomarkers groups.
Comparison between categorised fluid biomarkers levels and continuous measures of Aβ- (Centiloids, a, b) and tau PET (SUVR, c, d) quantification. Fluid biomarkers were categorised using the two-cut-off approach. The lower cut-off was obtained by maximizing specificity with sensitivity fixed at 95%, whereas the upper cut-off was obtained by maximizing sensitivity fixing specificity at 95%. Participants that fall between these two cut-offs were classified in the intermediate group. Dots represent individual participants. In all cases, central band of the boxplot represents the median of the group, the lower and upper hinges correspond to the first and third quartiles, and the whiskers represent the maximum/minimum value or the 1.5 IQR from the hinge, whatever is lower. Horizontal dashed lines represent the cut-off of positivity for each imaging marker (Aβ PET: ≥37 Centiloids, Tau PET: >1.32 SUVR for both cohorts). Abbreviations: Aβ, amyloid-β; CI, confidence interval; CSF, cerebrospinal fluid; IQR, inter-quantile range; NPV, negative predictive value; PPV, positive predictive value; SUVR, standardized uptake value ratio.
Extended Data Fig. 3
Extended Data Fig. 3. Comparison among fluid biomarkers on predicting Aβ PET positivity in cognitively impaired patients of the BioFINDER-2 cohort using external cut-offs.
Prediction of Aβ PET positivity in cognitively impaired participants from the BioFINDER-2 cohort, using a single cut-off (a) and two cut-offs (b) approaches, respectively. In the first approach, the cut-off was calculated maximizing sensitivity fixing specificity at 90%. In the second approach, the lower cut-off was obtained by maximizing specificity with sensitivity fixed at 95%, whereas the upper cut-off was obtained by maximizing sensitivity fixing specificity at 95%. Participants that fall between these two cut-offs were classified in the intermediate group. Dots and error bars represent the actual statistic and 95%CI, respectively. The external cut-off method derives the cut-offs in independent cohorts. Plasma %p-tau217 cut-offs were derived in the Knight ADRC cohort, and CSF biomarkers were derived in the UCSF cohort. Bootstrapped differences (n = 1,000 resamples with replacement stratifying by the output) between the statistics using plasma %p-tau217 (reference) and CSF biomarkers are shown in (c) for both single and two cut-offs. A horizontal dashed line is plotted at zero representing the lack of difference between plasma and CSF biomarkers. We considered plasma and CSF biomarkers clinically equivalent if the 95%CI of the mean difference included zero and clinically superior if it did not include zero and favored plasma (>0). Differences in number of participants in the intermediate group have been scaled to a maximum of one to be comparable to the other differences. Dots and error bars represent the mean and 95%CI estimate from a bootstrapped sample. Vertical dashed lines represent the maximal statistical value possible (1). For the intermediate values plots, coloured bars represent the actual percentage and error bar the 95%CI. Aβ PET positivity was assessed as Centiloids≥37. Abbreviations: Aβ, amyloid-β, CI, confidence interval; CSF, cerebrospinal fluid; NPV, negative predictive value; PPV, positive predictive value.

References

    1. Nichols E, et al. Global, regional, and national burden of Alzheimer’s disease and other dementias, 1990–2016: a systematic analysis for the Global Burden of Disease Study 2016. Lancet Neurol. 2019;18:88–106. doi: 10.1016/S1474-4422(18)30403-4. - DOI - PMC - PubMed
    1. Alzheimerʼs Disease International. World Alzheimer Report: The Global Impact of Dementia. https://www.alzint.org/u/WorldAlzheimerReport2015.pdf (2015).
    1. Seshadri S, Wolf PA. Lifetime risk of stroke and dementia: current concepts, and estimates from the Framingham Study. Lancet Neurol. 2007;6:1106–1114. doi: 10.1016/S1474-4422(07)70291-0. - DOI - PubMed
    1. Hansson O. Biomarkers for neurodegenerative diseases. Nat. Med. 2021;27:954–963. doi: 10.1038/s41591-021-01382-x. - DOI - PubMed
    1. Ossenkoppele R, et al. Tau PET patterns mirror clinical and neuroanatomical variability in Alzheimer’s disease. Brain. 2016;139:1551–1567. doi: 10.1093/brain/aww027. - DOI - PMC - PubMed