. 2024 Feb 21;22(1):141.
doi: 10.1186/s12964-023-01437-1.

Regulation of β-cell death by ADP-ribosylhydrolase ARH3 via lipid signaling in insulitis

Affiliations

Regulation of β-cell death by ADP-ribosylhydrolase ARH3 via lipid signaling in insulitis

Soumyadeep Sarkar et al. Cell Commun Signal. .

Abstract

Background: Lipids are regulators of insulitis and β-cell death in type 1 diabetes development, but the underlying mechanisms are poorly understood. Here, we investigated how the islet lipid composition and downstream signaling regulate β-cell death.

Methods: We performed lipidomics using three models of insulitis: human islets and EndoC-βH1 β cells treated with the pro-inflammatory cytokines interlukine-1β and interferon-γ, and islets from pre-diabetic non-obese mice. We also performed mass spectrometry and fluorescence imaging to determine the localization of lipids and enzyme in islets. RNAi, apoptotic assay, and qPCR were performed to determine the role of a specific factor in lipid-mediated cytokine signaling.

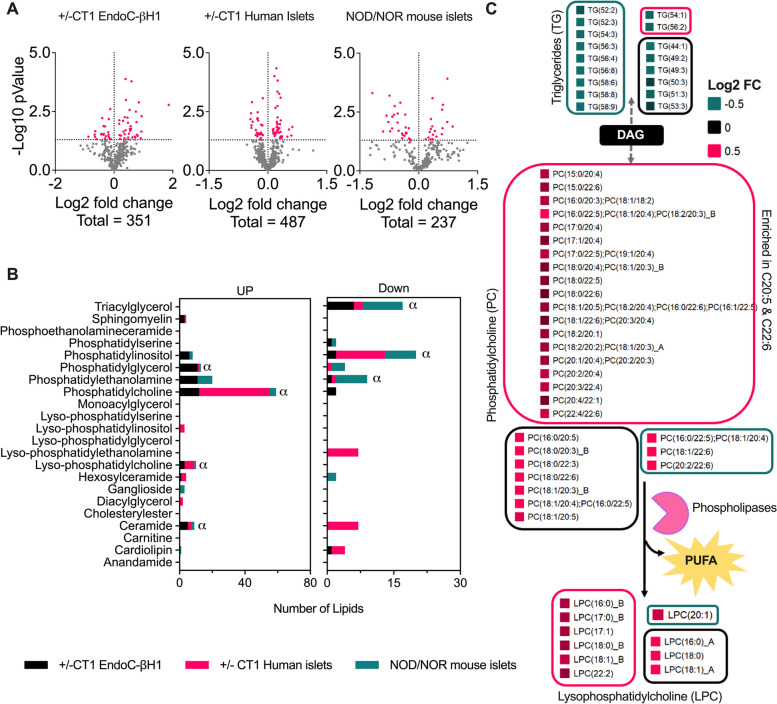
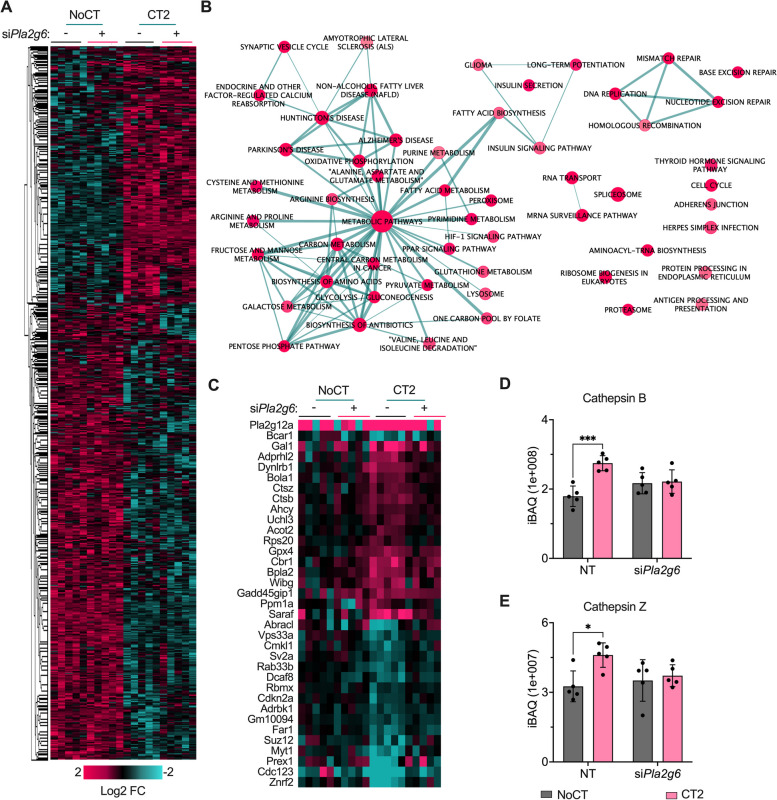
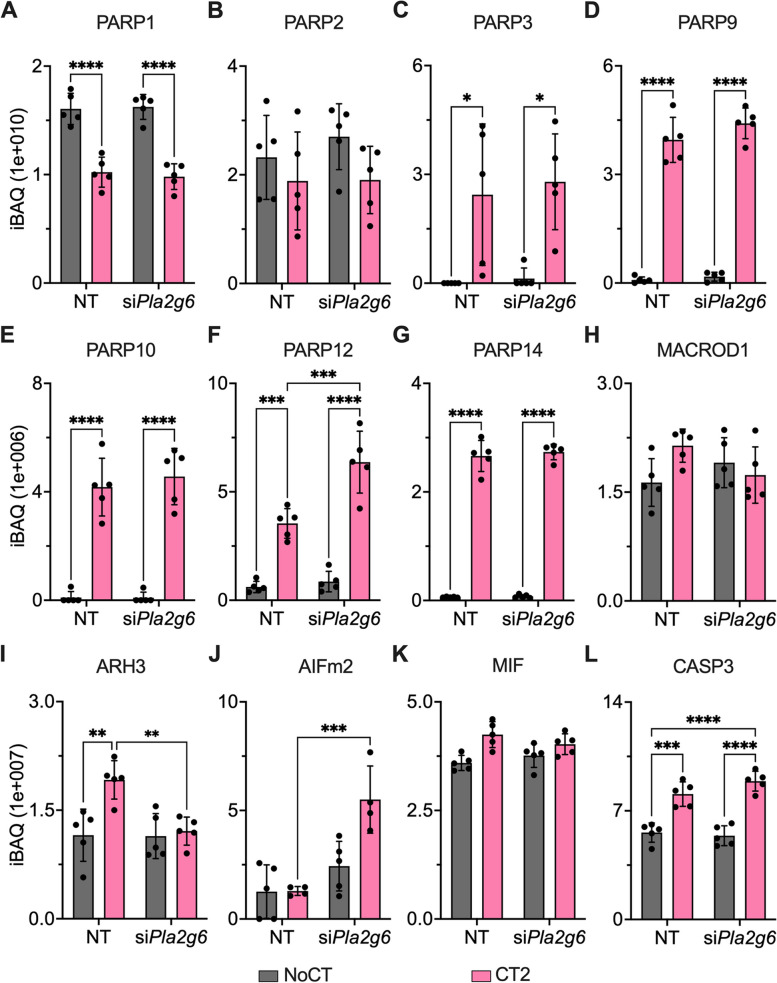
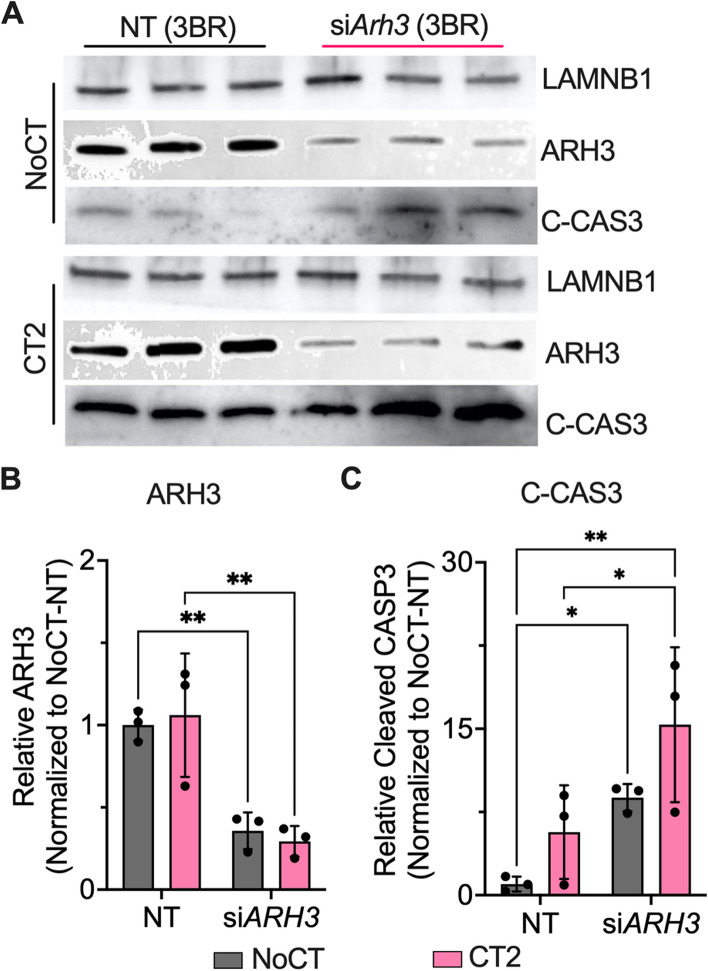
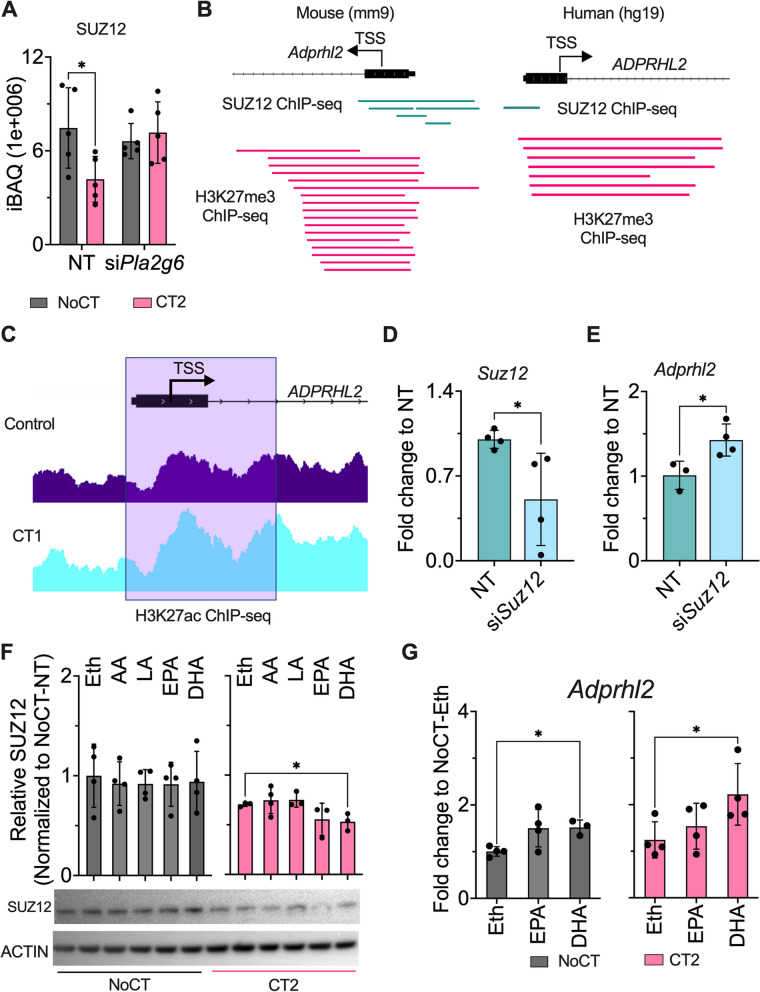
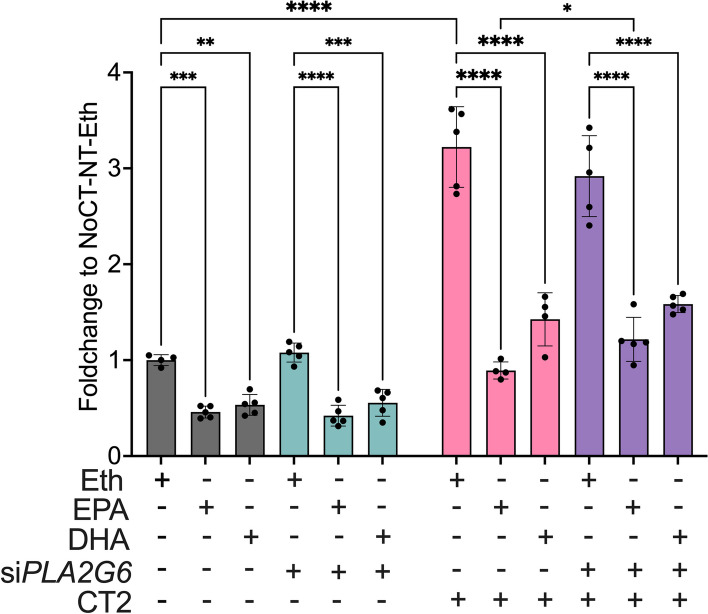
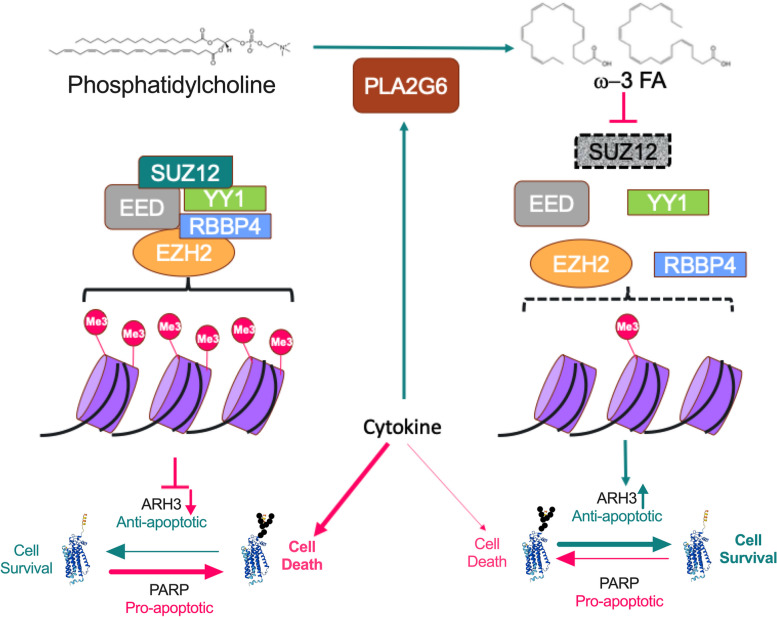
Results: Across all three models, lipidomic analyses showed a consistent increase of lysophosphatidylcholine species and phosphatidylcholines with polyunsaturated fatty acids and a reduction of triacylglycerol species. Imaging assays showed that phosphatidylcholines with polyunsaturated fatty acids and their hydrolyzing enzyme phospholipase PLA2G6 are enriched in islets. In downstream signaling, omega-3 fatty acids reduce cytokine-induced β-cell death by improving the expression of ADP-ribosylhydrolase ARH3. The mechanism involves omega-3 fatty acid-mediated reduction of the histone methylation polycomb complex PRC2 component Suz12, upregulating the expression of Arh3, which in turn decreases cell apoptosis.

Conclusions: Our data provide insights into the change of lipidomics landscape in β cells during insulitis and identify a protective mechanism by omega-3 fatty acids. Video Abstract.


Conflict of interest statement

The authors declare that they have no competing interests.

Figures

Fig. 1
Fig. 1
Global lipidomic analysis of 3 common insulitis models, i.e., EndoC-βH1 (n = 3) cells and human islets (n = 10) exposed to CT1 (IL-1β and INF-γ) for 48 h and islets from non-obese diabetic (NOD) mice in pre-diabetic stage (6 weeks of age) vs. age-matched NOR mice (n = 3). Lipids were extracted and analyzed by liquid chromatography-tandem mass spectrometry. a Volcano plots of the lipid species relative abundances. b Number of lipid species significantly (Student’s t-test p ≤ 0.05) regulated in each class. “α” represents common lipid species upregulated or downregulated in all three insulitis models. c Lipid species that are consistently regulated in the 3 insulitis models. Each lipid species is named with the abbreviation of its class (e.g., LPC and PC) followed by the length of the fatty acid and number of double bonds (separated by a colon) in parenthesis. The letters after the lipid names represent different isomers that are separated in the chromatography in alphabetical order. The relative abundance in T1D model vs. control is color-coded. Isobaric coeluting species (separated by semicolons) were co-quantified
Fig. 2
Fig. 2
Spatial localization of lysophosphatidylcholines, phosphatidylcholines and phospholipase PLA2G6 in pancreata. a Chemical image of mouse and human pancreata by mass spectrometry. Each image shows either the optical image or color-coded distribution of different lipids. Lipid species were identified by matching against the lipids characterized and quantified on the lipidomics analysis based on their accurate masses. b PLA2G6 fluorescence in situ hybridization (FISH) of islets from non-obese diabetes resistant (NOR) mice (6 weeks of age) and MIN6 cell line. Cells and tissues were stained with anti-insulin antibody (green), DNA stain 4′,6-diamidino-2-phenylindole (DAPI – blue) and fluorescent-labeled antisense Pla2g6 oligonucleotide (red). c Immunohistochemistry (IHC) analysis of PLA2G6. Tissue was stained with biotin-conjugated anti-Pla2g6 antibodies followed by avidin-conjugated horseradish peroxidase. Localization was visualized by horseradish peroxidase-mediated oxidation and precipitation of 3,3′-diaminobenzidine (brown). The images are representative of two independent experiments
Fig. 3
Fig. 3
Pro-inflammatory cytokines and Pla2g6-dependent proteome remodeling in MIN6 cells. a Cytokine cocktail CT2 (IL-1β + IFN-γ + TNFα)-dependent protein expression in Pla2g6 siRNA (siPla2g6) MIN6 cells (n = 5, +SD). Nontarget siRNA was used as a transfection control. b KEGG pathways enriched with proteins differentially abundant in IL-1β + IFN-γ-treated MIN6 cells. Pathways were grouped based on shared proteins using Enrichment Map tool in Cytoscape [30]. Each pathway is represented by a node, and their degree of connectivity (thickness of the edges) is proportional to the number of shared proteins between the pathways. c Pla2g6-dependent protein abundance changes of CT2-treated MIN6 cells. Abundance profiles of cathepsin Z (d), cathepsin B (e). Statistical test: ** p ≤ 0.01 and *** p ≤ 0.001 by 2way-ANOVA and “Šídák’s multiple comparisons test
Fig. 4
Fig. 4
Regulation of ADP-ribosylation enzymes by pro-inflammatory cytokines and Phospholipase enzyme. A-K Cytokine cocktail CT2 (IL-1β + IFN-γ + TNFα)-dependent protein expression of ADP-ribosylation enzymes and PARP-mediated apoptosis markers in Pla2g6 siRNA (siPla2g6) MIN6 cells (n = 5, +SD). Statistical test: * p ≤ 0.05, ** p ≤ 0.01, and *** p ≤ 0.001 by 2wayANOVA and “Šídák’s multiple comparisons test
Fig. 5
Fig. 5
ARH3 regulates cytokine-mediated β-cell apoptosis. Western blot analysis of ARH3 siRNA (siARH3) MIN6 cells treated with cytokines (a) (BR: Biological replicates). b, c relative levels of ARH3 (b) and cleaved caspase 3 (c) bands normalized to LAMINB1. To ensure reproducibility, we performed 3 independent experiments. Statistical test: * p ≤ 0.05, ** p ≤ 0.01, and *** p ≤ 0.001 by 2wayANOVA and “Šídák’s multiple comparisons test
Fig. 6
Fig. 6
Regulation of the ARH3 gene Adprhl2 expression by ω-3 fatty acids and SUZ12. a SUZ12 protein expression in Pla2g6 siRNA (siPla2g6) MIN6 cells with cytokine cocktail CT2 (IL-1β + IFN-γ + TNFα) treatment (n = 5, +SD). b ChIPseq mouse (mm9) and human (hg19) data were retrieved from ChIP-atlas database (https://chip-atlas.org/peak_browser). The individual line represents independent studies reporting enrichment of SUZ12 (Green) and H3K27me3 (Pink) at ADPRHL2 transcriptional start site (TSS). c Representative western blot image and relative level of SUZ12 protein normalized to Actin post CT2 and ω-6 (arachidonic acid - AA & linoleic acid - LA) and ω-3 (eicosapentaenoic acid - EPA & docosahexaenoic acid - DHA) fatty acid treatment (n = 3–4, +SD). Ethanol (Eth) was used as solvent control for the fatty acids (FAs). d Adprhl2 mRNA expression post-CT2 and ω-3 FA (EPA and DHA) treatment (n = 3–4, +SD). e, f Suz12 and Adprhl2 mRNA expression in Min6 cells with Suz12 siRNA (siSuz12) (n = 3–4, +SD). g Re-analyzed H3K27ac ChIPseq data of CT1 (IL-1β + IFN-γ) treated Human islets [19]. *p ≤ 0.05 for A was calculated by 2wayANOVA and Šídák’s multiple comparison test, for C students’ t-test, D one-way ANOVA followed by Šídák’s multiple comparisons test, and for F & G, students’ t-test was used. Specifically, the normality and outlier test for the molecular experiment were tested using “The shapiro-Wilk test” and Dixon’s test, with a threshold of p < 0.2, respectively
Fig. 7
Fig. 7
Protective effect of ω-3 fatty acids against cytokine-induced apoptosis. Apoptosis was measured by caspase3/7 activity in MIN6 cells treated with ω-3 fatty acids or ethanol (Eth) and PLA2G6 siRNA (siPLA2G6) for 48 h followed by 24 h of cytokine cocktail CT2 (IL-1β + IFN-γ + TNFα) treatment (n = 4, +SD). *p ≤ 0.05, **p ≤ 0.01, *** p ≤ 0.001 and ****p ≤ 0.0001 by 2wayANOVA and “Uncorrected Fisher’s LSD” test. Specifically, the normality and outlier test for the molecular experiment were tested using “The shapiro-Wilk test” and Dixon’s test, with a threshold of p < 0.2, respectively
Fig. 8
Fig. 8
Protective mechanism of ω-3 fatty acids against cytokine-induced apoptosis. The schematic model represents cytokine-mediated hydrolysis of phosphatidylcholine by PLA2G6, giving rise to ω-3 fatty acids, which protect β cells by reducing ADP-ribosylation through upregulating ARH3 expression via SUZ12

References

    1. DiMeglio LA, Evans-Molina C, Oram RA. Type 1 diabetes. Lancet. 2018;391:2449–2462. doi: 10.1016/S0140-6736(18)31320-5. - DOI - PMC - PubMed
    1. Huo L, Harding JL, Peeters A, Shaw JE, Magliano DJ. Life expectancy of type 1 diabetic patients during 1997-2010: a national Australian registry-based cohort study. Diabetologia. 2016;59:1177–1185. doi: 10.1007/s00125-015-3857-4. - DOI - PubMed
    1. Verges B. Lipid disorders in type 1 diabetes. Diabetes Metab. 2009;35:353–360. doi: 10.1016/j.diabet.2009.04.004. - DOI - PubMed
    1. Lamichhane S, Ahonen L, Dyrlund TS, Kemppainen E, Siljander H, Hyoty H, Ilonen J, Toppari J, Veijola R, Hyotylainen T, et al. Dynamics of plasma Lipidome in progression to islet autoimmunity and type 1 diabetes - type 1 diabetes prediction and prevention study (DIPP) Sci Rep. 2018;8:10635. doi: 10.1038/s41598-018-28907-8. - DOI - PMC - PubMed
    1. Oresic M, Gopalacharyulu P, Mykkanen J, Lietzen N, Makinen M, Nygren H, Simell S, Simell V, Hyoty H, Veijola R, et al. Cord serum lipidome in prediction of islet autoimmunity and type 1 diabetes. Diabetes. 2013;62:3268–3274. doi: 10.2337/db13-0159. - DOI - PMC - PubMed

Publication types