. 2024 Feb 21;23(1):53.
doi: 10.1186/s12936-024-04862-w.

Correlative light-electron microscopy methods to characterize the ultrastructural features of the replicative and dormant liver stages of Plasmodium parasites

Affiliations

Correlative light-electron microscopy methods to characterize the ultrastructural features of the replicative and dormant liver stages of Plasmodium parasites

Gabriel Mitchell et al. Malar J. .

Abstract

Background: The infection of the liver by Plasmodium parasites is an obligatory step leading to malaria disease. Following hepatocyte invasion, parasites differentiate into replicative liver stage schizonts and, in the case of Plasmodium species causing relapsing malaria, into hypnozoites that can lie dormant for extended periods of time before activating. The liver stages of Plasmodium remain elusive because of technical challenges, including low infection rate. This has been hindering experimentations with well-established technologies, such as electron microscopy. A deeper understanding of hypnozoite biology could prove essential in the development of radical cure therapeutics against malaria.

Results: The liver stages of the rodent parasite Plasmodium berghei, causing non-relapsing malaria, and the simian parasite Plasmodium cynomolgi, causing relapsing malaria, were characterized in human Huh7 cells or primary non-human primate hepatocytes using Correlative Light-Electron Microscopy (CLEM). Specifically, CLEM approaches that rely on GFP-expressing parasites (GFP-CLEM) or on an immunofluorescence assay (IFA-CLEM) were used for imaging liver stages. The results from P. berghei showed that host and parasite organelles can be identified and imaged at high resolution using both CLEM approaches. While IFA-CLEM was associated with more pronounced extraction of cellular content, samples' features were generally well preserved. Using IFA-CLEM, a collection of micrographs was acquired for P. cynomolgi liver stage schizonts and hypnozoites, demonstrating the potential of this approach for characterizing the liver stages of Plasmodium species causing relapsing malaria.

Conclusions: A CLEM approach that does not rely on parasites expressing genetically encoded tags was developed, therefore suitable for imaging the liver stages of Plasmodium species that lack established protocols to perform genetic engineering. This study also provides a dataset that characterizes the ultrastructural features of liver stage schizonts and hypnozoites from the simian parasite species P. cynomolgi.

Keywords: CLEM; Hepatocytes; Hypnozoites; Mitochondria; Plasmodium berghei; Plasmodium cynomolgi; Relapsing malaria; Schizonts; TEM; Transmission electron microscopy.


Conflict of interest statement

GM, LT, MEF, ML, VC, ELF, AH and SAM were employed by and/or shareholders of Novartis Pharma AG during this study.

Figures

Fig. 1
Fig. 1
Imaging of P. berghei liver stages using GFP-CLEM. A Illustration outlining the protocol to perform CLEM of P. berghei liver stages expressing GFP. Huh7 cells were seeded on gridded coverslips presenting alphanumerical coordinates and infected with P. berghei sporozoites. Maps of cells infected with 2-day old liver stages were acquired using GFP (green) and Hoechst (a nucleic acid stain, blue) and light and fluorescence microscopy (LM). Samples were then processed for TEM imaging, which includes embedding samples in resin, trimming resin blocks around ROIs, preparing ultra-thin sections using the microtome and staining with contrasting reagents. Samples were then imaged using TEM and ROIs were located by correlating patterns of host nuclei and liver stages. An example shows a LM map (bottom left) and low-magnification TEM micrographs (bottom right) for 4 GFP+ liver stages (i, ii, iii and iv). Scale bars are 200 μm and 10 μm for the LM and TEM micrographs, respectively. Drawings were created with BioRender.com. B The overlay of micrographs exemplifies how data from LM and TEM are correlated and used to re-localize ROIs. Scale bar is 10 μm. C Higher-magnification TEM micrographs showing the hepatocyte-parasite interface, and a host cell mitochondrion (MH), a P. berghei mitochondrion (MPb), the parasitophorous vacuole membrane (PVM), the parasite plasma membrane (PPM), P. berghei vacuoles (VPb) and a P. berghei nucleus (NPb). Scale bar is 1 μm. The inset in (B) defined by a box with a white dotted border shows the area selected for the zoom-in micrograph presented in (C)
Fig. 2
Fig. 2
Imaging of P. berghei liver stages using IFA-CLEM. A Diagram outlining the IFA protocol used to perform IFA-CLEM. A representative image of a 2-day old P. berghei liver stage in Huh7 cells stained for the PVM protein UIS4 (red) and Hoechst (blue) is shown. Scale bar is 20 μm. Low-magnification TEM micrographs for liver stages imaged with GFP-CLEM (B) and IFA-CLEM (C). Scale bars are 5 μm (B-i, B-ii, C-i and C-ii) or 10 μm (B-iii and C-iii). D Higher-magnification GFP-CLEM (top row) and IFA-CLEM (bottom row) micrographs showing the parasitophorous vacuole (PV) space, P. berghei (Pb) nuclei, the P. berghei mitochondrial network, apicoplasts, P. berghei vacuoles and the P. berghei endoplasmic reticulum (ER). NH, host nucleus; PVM, parasitophorous vacuole membrane; PPM, parasite plasma membrane. Scale bars are 500 nm
Fig. 3
Fig. 3
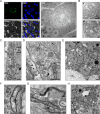
Imaging of P. cynomolgi liver stage schizonts using IFA-CLEM. A Micrographs showing a P. cynomolgi schizont at 7 dpi in a primary NHP hepatocyte stained for UIS4 (green) and nucleic acids (Hoechst, blue) and imaged with fluorescence and phase contrast microscopy. Scale bar is 20 μm. The same schizont is also represented on a TEM micrograph obtained using IFA-CLEM. Scale bar is 5 μm. B TEM micrographs of two other P. cynomolgi schizonts at 7 dpi (i and ii). Scale bars are 5 μm. CH TEM micrographs showcasing the ultrastructural features of P. cynomolgi liver stage schizonts, including an apicoplast (Api), host glycogen granules (GG), host mitochondria (MH), dense/electron-opaque P. cynomolgi vacuoles (DVPc), large P. cynomolgi vacuoles (LVPc), the P. cynomolgi endoplasmic reticulum (ERPc), the P. cynomolgi mitochondrial network (MPc), P. cynomolgi nuclei (NPc) and the parasitophorous vacuole (PV) in hepatocytes infected with P. cynomolgi schizonts at 7 dpi. Note the host mitochondria positioned in proximity to the PVM in (C). PVM, parasitophorous vacuole membrane; PPM, parasite plasma membrane. Scale bars are 1 μm (C) or 500 nm DH
Fig. 4
Fig. 4
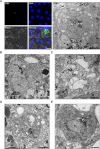
Imaging of P. cynomolgi hypnozoites using IFA-CLEM. A Micrographs showing a P. cynomolgi hypnozoite at 7 dpi in a primary NHP hepatocyte stained for UIS4 (green) and nucleic acids (Hoechst, blue) and imaged with fluorescence and phase contrast microscopy. Scale bar is 20 μm. The white arrows on the zoom-in micrograph (top right of overlay) show two DNA punctae in the hypnozoite. The same hypnozoite is also represented on a TEM micrograph obtained using IFA-CLEM. Scale bar is 1 μm. BE Low-magnification TEM micrographs of additional hypnozoites at 7 dpi. Note the host mitochondria (MH) positioned in proximity to the PVM of hypnozoites. NPc, P. cynomolgi nuclei; Api, apicoplast. Scale bars are 1 μm
Fig. 5
Fig. 5
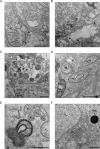
Ultrastructure of P. cynomolgi hypnozoites. AF TEM micrographs showcasing the apicoplast (Api), host mitochondria (MH), a host vacuole (VH), a dense/electron-opaque P. cynomolgi vacuole (DVPc), electron-translucent P. cynomolgi vacuoles (VPc), the P. cynomolgi endomembrane network (ENPc), the P. cynomolgi mitochondrial network (MPc), P. cynomolgi nuclei (NPc) and the parasitophorous vacuole (PV) in hepatocytes infected with P. cynomolgi hypnozoites at 7 dpi. Note the association between hypnozoites and host mitochondria (A, B) or a host vacuole (C). PVM, parasitophorous vacuole membrane; PPM, parasite plasma membrane. Scale bars are 500 nm

References

    1. WHO . World malaria report. Geneva: World Health Organization; 2023.
    1. Schafer C, Zanghi G, Vaughan AM, Kappe SHI. Plasmodium vivax latent liver stage infection and relapse: biological insights and new experimental tools. Annu Rev Microbiol. 2021;75:87–106. doi: 10.1146/annurev-micro-032421-061155. - DOI - PubMed
    1. Vaughan AM, Kappe SHI. Malaria parasite liver infection and exoerythrocytic biology. Cold Spring Harb Perspect Med. 2017;7:a025486. doi: 10.1101/cshperspect.a025486. - DOI - PMC - PubMed
    1. White NJ. Anti-malarial drug effects on parasite dynamics in vivax malaria. Malar J. 2021;20:161. doi: 10.1186/s12936-021-03700-7. - DOI - PMC - PubMed
    1. Christensen P, Racklyeft A, Ward KE, Matheson J, Suwanarusk R, Chua ACY, et al. Improving in vitro continuous cultivation of Plasmodium cynomolgi, a model for P. vivax. Parasitol Int. 2022 doi: 10.1016/j.parint.2022.102589. - DOI - PubMed