

A proteomic classifier panel for early screening of colorectal cancer: a case control study
- PMID: 38383428
- PMCID: PMC10880210
- DOI: 10.1186/s12967-024-04983-5
A proteomic classifier panel for early screening of colorectal cancer: a case control study
Abstract
Background: Diagnosis of colorectal cancer (CRC) during early stages can greatly improve patient outcome. Although technical advances in the field of genomics and proteomics have identified a number of candidate biomarkers for non-invasive screening and diagnosis, developing more sensitive and specific methods with improved cost-effectiveness and patient compliance has tremendous potential to help combat the disease.
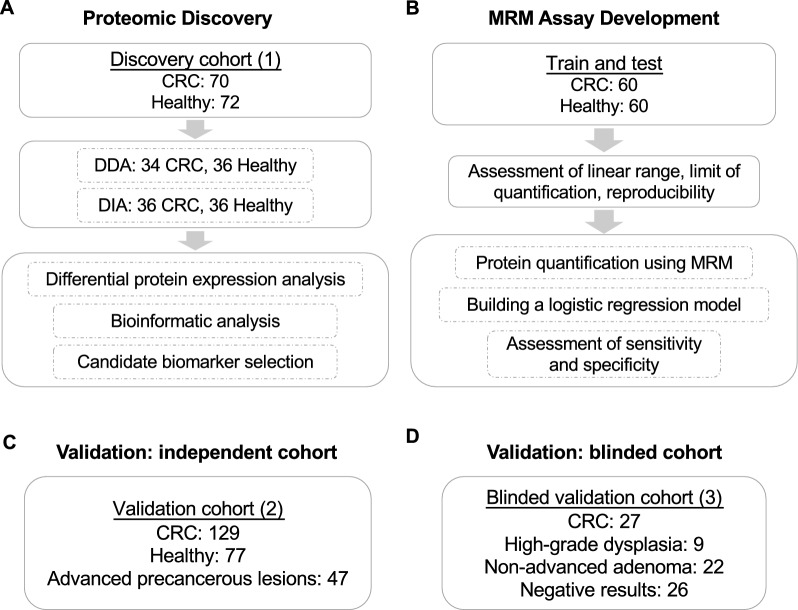
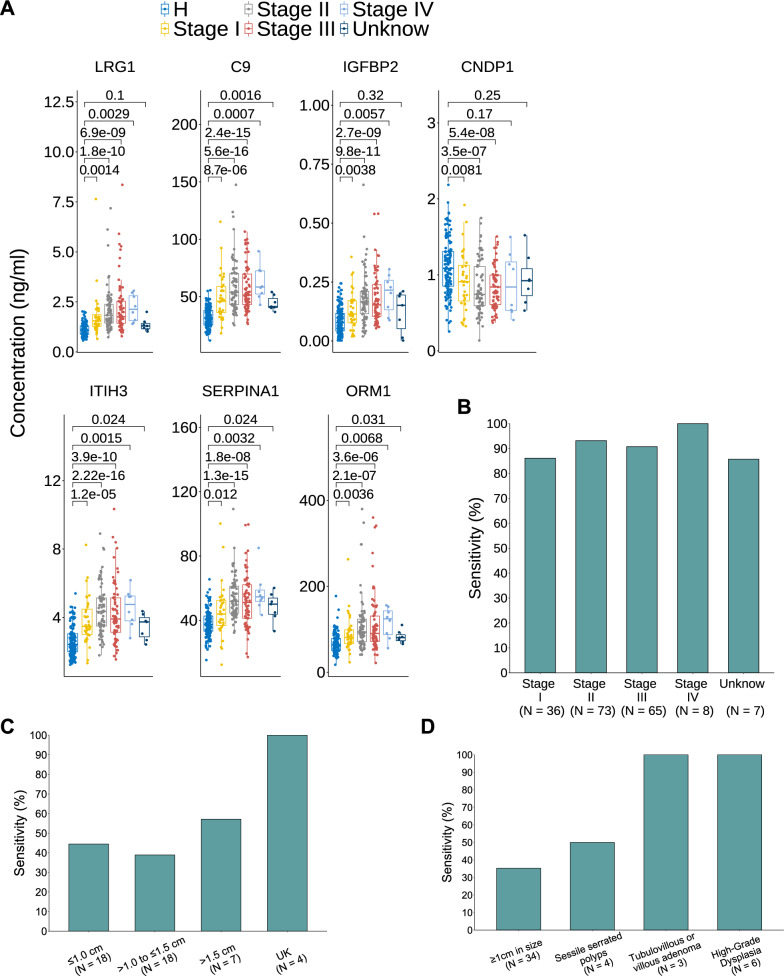
Methods: We enrolled three cohorts of 479 subjects, including 226 CRC cases, 197 healthy controls, and 56 advanced precancerous lesions (APC). In the discovery cohort, we used quantitative mass spectrometry to measure the expression profile of plasma proteins and applied machine-learning to select candidate proteins. We then developed a targeted mass spectrometry assay to measure plasma concentrations of seven proteins and a logistic regression classifier to distinguish CRC from healthy subjects. The classifier was further validated using two independent cohorts.
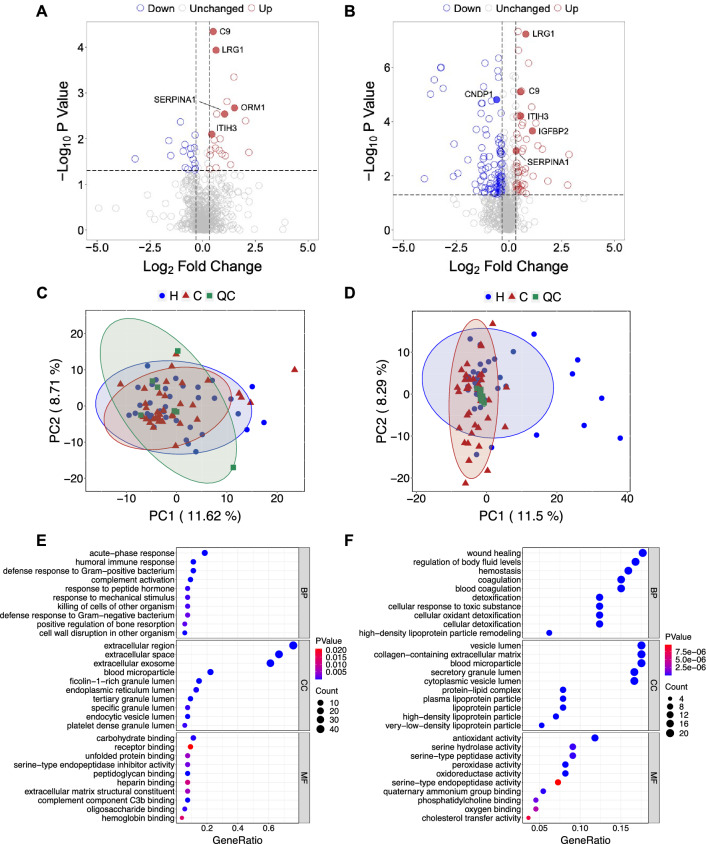
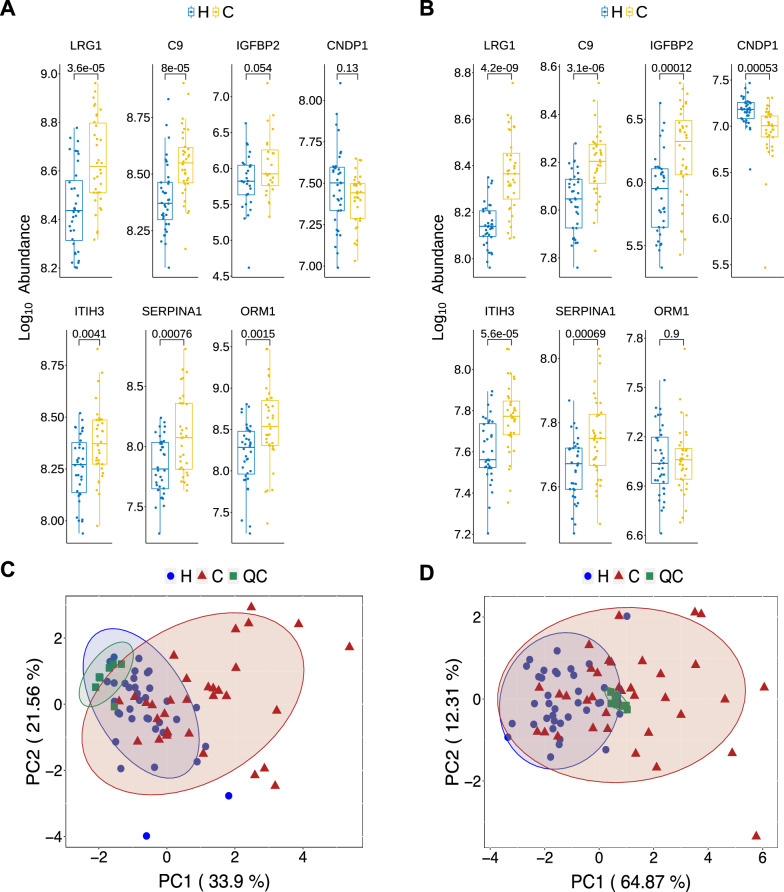
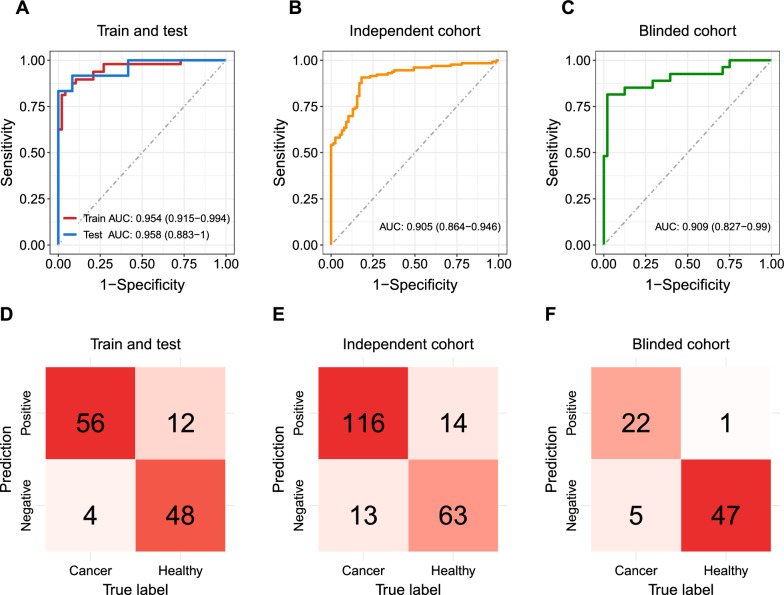
Results: The seven-protein panel consisted of leucine rich alpha-2-glycoprotein 1 (LRG1), complement C9 (C9), insulin-like growth factor binding protein 2 (IGFBP2), carnosine dipeptidase 1 (CNDP1), inter-alpha-trypsin inhibitor heavy chain 3 (ITIH3), serpin family A member 1 (SERPINA1), and alpha-1-acid glycoprotein 1 (ORM1). The panel classified CRC and healthy subjects with high accuracy, since the area under curve (AUC) of the training and testing cohort reached 0.954 and 0.958. The AUC of the two independent validation cohorts was 0.905 and 0.909. In one validation cohort, the panel had an overall sensitivity, specificity, positive predictive value (PPV), and negative predictive value (NPV) of 89.9%, 81.8%, 89.2%, and 82.9%, respectively. In another blinded validation cohort, the panel classified CRC from healthy subjects with a sensitivity of 81.5%, specificity of 97.9%, and overall accuracy of 92.0%. Finally, the panel was able to detect APC with a sensitivity of 49%.
Conclusions: This seven-protein classifier is a clear improvement compared to previously published blood-based protein biomarkers for detecting early-stage CRC, and is of translational potential to develop into a clinically useful assay.
Keywords: Colorectal cancer; Early detection; Mass spectrometry; Protein biomarker.
© 2024. The Author(s).
Conflict of interest statement
The authors LL, TW, FG declare that they have competing interests, and a patent related to this study has been filed. Other authors declare that there is no conflict of interest.
Figures
Similar articles
-
Noninvasive Detection of Colorectal Carcinomas Using Serum Protein Biomarkers.J Surg Res. 2020 Feb;246:160-169. doi: 10.1016/j.jss.2019.08.004. Epub 2019 Oct 3. J Surg Res. 2020. PMID: 31586890 Free PMC article.
-
Quantitative proteomic analysis exploring progression of colorectal cancer: Modulation of the serpin family.J Proteomics. 2016 Oct 4;148:139-48. doi: 10.1016/j.jprot.2016.07.031. Epub 2016 Aug 2. J Proteomics. 2016. PMID: 27492143
-
Revelation of Proteomic Indicators for Colorectal Cancer in Initial Stages of Development.Molecules. 2020 Jan 31;25(3):619. doi: 10.3390/molecules25030619. Molecules. 2020. PMID: 32023884 Free PMC article.
-
Proteomics for early detection of colorectal cancer: recent updates.Expert Rev Proteomics. 2018 Jan;15(1):55-63. doi: 10.1080/14789450.2018.1396893. Epub 2017 Nov 6. Expert Rev Proteomics. 2018. PMID: 29064727 Review.
-
A Meta-Analysis of Proteomic Blood Markers of Colorectal Cancer.Curr Med Chem. 2021;28(6):1176-1196. doi: 10.2174/0929867327666200427094054. Curr Med Chem. 2021. PMID: 32338203
Cited by
-
Advances in Precision Medicine Approaches for Colorectal Cancer: From Molecular Profiling to Targeted Therapies.ACS Pharmacol Transl Sci. 2024 Mar 19;7(4):967-990. doi: 10.1021/acsptsci.4c00008. eCollection 2024 Apr 12. ACS Pharmacol Transl Sci. 2024. PMID: 38633600 Free PMC article. Review.
References
Publication types
MeSH terms
Substances
Grants and funding
LinkOut - more resources
Full Text Sources
Medical
Molecular Biology Databases
Research Materials
Miscellaneous
