. 2024 Feb 21;15(1):1593.
doi: 10.1038/s41467-024-45861-4.

Accurate global and local 3D alignment of cryo-EM density maps using local spatial structural features

Affiliations

Accurate global and local 3D alignment of cryo-EM density maps using local spatial structural features

Bintao He et al. Nat Commun. .

Abstract

Advances in cryo-electron microscopy (cryo-EM) imaging technologies have led to a rapidly increasing number of cryo-EM density maps. Alignment and comparison of density maps play a crucial role in interpreting structural information, such as conformational heterogeneity analysis using global alignment and atomic model assembly through local alignment. Here, we present a fast and accurate global and local cryo-EM density map alignment method called CryoAlign, that leverages local density feature descriptors to capture spatial structure similarities. CryoAlign is a feature-based cryo-EM map alignment tool, in which the employment of feature-based architecture enables the rapid establishment of point pair correspondences and robust estimation of alignment parameters. Extensive experimental evaluations demonstrate the superiority of CryoAlign over the existing methods in terms of both alignment accuracy and speed.


Conflict of interest statement

The authors declare no competing interests.

Figures

Fig. 1
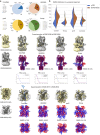
Fig. 1. Overview of CryoAlign.
a Flowchart of CryoAlign. A visual example of RNA polymerase-sigma54 holoenzyme and promoter DNA closed complex with (EMD-3696, PDB ID:5nss, left) and without (EMD-3695, PDB ID:5nsr, right) transcription activator PspF intermediate is provided on the right. The input of CryoAlign is a pair of cryo-EM density maps. First, initial point clouds are sampled by a given interval and density vectors are computed for all points. Then, clustering algorithms are applied to extract key points that represent the rough backbones of the structures. Local spatial structural feature descriptors are calculated to capture the local structures around these key points. Using the extracted feature descriptors and the mutual feature matching technique, CryoAlign robustly and efficiently computes the initial pose parameters. Finally, CryoAlign generates the best superimposition by iteratively shifting the corresponding points closer together. The alignment parameters are then applied to the fitted atom models, directly illustrating the alignment performance. b The proportion of correct correspondences. In the visual example, the lines between points represent the estimated correspondences, with correct correspondences labeled in red and false ones labeled in green. From top to bottom, four cases with only initial points, with only extracted key points, with a combination of initial points and mutual matching, and with a combination of key points and mutual matching are listed.
Fig. 2
Fig. 2. Global alignment performance of CryoAlign.
a The number of points with the increasing density map size. Initial points (blue box) and key points (orange box). For map size groups “<=50 MB”, “50–100 MB”, “100–200 MB”, “200–300 MB” and “>300 MB”, the sample sizes N = 27, 17, 54, 80 and 15. The center, lower and upper lines in each box indicate the median, the first quartile and the third quartile, respectively. The number inside each box refers to the mean value. The whiskers show the 2.5% and 97.5% quantiles. b The correct ratio distribution of four different feature matching strategies. Only initial points (blue line), only key points (orange line), initial points + mutual matching (green line) and key points + mutual matching (red line). c Comparison of accuracy between one-stage alignment and two-stage alignment. Each data point’s size corresponds to the count of combinations within specific RMSD ranges. d The execution time distributions of one-stage alignment and two-stage alignment.
Fig. 3
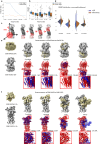
Fig. 3. Global alignment performance of compared methods.
a The RMSD distribution of the compared methods CryoAlign, VESPER, gmfit and fitmap. The sectors colored dark are the failure proportion (RMSD larger than 10 Å) of the methods, with CryoAlign/VESPER/gmfit/fitmap being 12%/28%/40%/58%, respectively. Meanwhile, RMSD smaller than 3 Å can be considered as high-quality alignment, with CryoAlign/VESPER/gmfit/fitmap being 69%/36%/30%/35%, respectively. b The violin plot illustrates the RMSD values in successful alignment for each method, split by map resolution. Each line represents a data point. Notably, the regions below zero hold no meanings, which are merely the result of distribution estimation. c The left example is the density map pair for the same state of Yeast V-ATPase (EMD-6286, PDB ID:3j9v and EMD-6284, PDB ID:3j9t). There is little difference between the two maps. The alignment accuracy is evaluated by FSC curves on the right. The RMSD of CryoAlign/VESPER/gmfit/fitmap is 2.30/4.47/4.46/66.12 Å, respectively. d The right example is the density map pair for different states of Cyclic Nucleotide-Gated Ion Channel (EMD-8632, PDB ID:5v4s and EMD-8511, PDB ID:5u6o). Accurate rotation estimation is needed here. The RMSD of CryoAlign/VESPER/gmfit/fitmap is 4.75/8.85/63.56/54.12 Å, respectively.
Fig. 4
Fig. 4. Local alignment.
a The relation between failure probability and volume proportion of the smaller map to the larger one. The blue curve is direct alignment without cutting. The orange curve is multiple alignment with a translational mask. b Comparison of alignment accuracy between two alignment strategies, direct alignment and multiple alignment with mask. For volume ratio groups “<=0.2”, “0.2–0.4”, “0.4–0.6”, “0.6–0.8”, and “>0.8”, the sample sizes N = 7, 33, 77, 29, and 55. The center, lower and upper lines in each box indicate the median, the first quartile and the third quartile, respectively. The number inside each box refers to the mean value. The whiskers show the 2.5% and 97.5% quantiles and each black dot represents a data point. c Sketch of the translational mask. The mask moves in a given interval along the axis and part of the larger point cloud is taken for alignment. The extracted points are labeled in red and the remaining ones are black. d The violin plot illustrates RMSD values in successful alignment for each method, split by map resolution. Each line represents a data point. Notably, the regions below zero hold no meanings, which are merely the result of distribution estimation. e The first example is superimposing the Vo region of the V-ATPase (EMD-8409, PDB ID:5tj5) on the complete V-ATPase (EMD-8726, PDB ID:5voz). Although the volume ratio is smaller than 50%, the distinct fence-like 3D structure makes EMD-8409 distinctive from EMD-8726. The RMSD of CryoAlign/VESPER/gmfit/fitmap is 1.9/2.2/135.64/25.46 Å, respectively. f The second example is to align 26S proteasome regulatory particle (EMD-8675, PDB ID:5vhh) and 26S proteasome of Saccharomyces cerevisiae in the presence of BeFx (EMD-3537, PDB ID:5mpc). The volume ratio is ~50%, but it is still difficult to align them using traditional methods. The RMSD of CryoAlign/VESPER/gmfit/fitmap is 3.05/6.39/125.38/121.59 Å, respectively.
Fig. 5
Fig. 5. Examples for map comparison.
a, b The difference map is calculated for both scenarios: source map—target map and target map—source map. The molecular weights are computed to quantify the difference. c 3D variance map of 42 different states of bL17-limited ribosome assembly intermediates. Some representative ribosome assembly intermediates of different states are selected in the top row. The 3D variance map is displayed in the central slice of the yz plane, xy plane, and xz plane for visualization. The color intensities correspond to the variance values, with brighter colors indicating higher variances.
Fig. 6
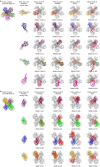
Fig. 6. Examples of atomic model fitting.
a Chain structure fitting of pentameric ZntB transporter (EMD-3605, PDB:5n9y), which consists of five single chains A, B, C, D and E. For rotational invariance caused by similarity of chains, we collected the five top-scoring results of CryoAlign or VESPER as candidates and selected the best one. The red “#2” beside the RMSD value represents the ranking of the best superimposition in the candidate list. b Chain structure fitting of kinase domain-like (MLKL) protein (EMD-0868, PDB:6lba), which consists of four single chains A, B, C and D. Note that if the RMSD value is large but no ranking is listed for CryoAlign or VESPER, none of the five top-scoring parameters resulted in a successful alignment.

Similar articles

Cited by

References

    1. Bai X-C, McMullan G, Scheres SH. How cryo-EM is revolutionizing structural biology. Trends Biochem. Sci. 2015;40:49–57. doi: 10.1016/j.tibs.2014.10.005. - DOI - PubMed
    1. Nogales E. The development of cryo-EM into a mainstream structural biology technique. Nat. Methods. 2016;13:24–27. doi: 10.1038/nmeth.3694. - DOI - PMC - PubMed
    1. Lawson CL, et al. EMDataBank unified data resource for 3DEM. Nucleic Acids Res. 2016;44:D396–D403. doi: 10.1093/nar/gkv1126. - DOI - PMC - PubMed
    1. Herreros D, et al. Estimating conformational landscapes from Cryo-EM particles by 3D Zernike polynomials. Nat. Commun. 2023;14:154. doi: 10.1038/s41467-023-35791-y. - DOI - PMC - PubMed
    1. Chen M, Ludtke SJ. Deep learning-based mixed-dimensional Gaussian mixture model for characterizing variability in cryo-EM. Nat. Methods. 2021;18:930–936. doi: 10.1038/s41592-021-01220-5. - DOI - PMC - PubMed