

Fatigue and symptom-based clusters in post COVID-19 patients: a multicentre, prospective, observational cohort study
- PMID: 38383493
- PMCID: PMC10880228
- DOI: 10.1186/s12967-024-04979-1
Fatigue and symptom-based clusters in post COVID-19 patients: a multicentre, prospective, observational cohort study
Abstract
Background: In the Netherlands, the prevalence of post COVID-19 condition is estimated at 12.7% at 90-150 days after SARS-CoV-2 infection. This study aimed to determine the occurrence of fatigue and other symptoms, to assess how many patients meet the Myalgic Encephalomyelitis/Chronic Fatigue Syndrome (ME/CFS) criteria, to identify symptom-based clusters within the P4O2 COVID-19 cohort and to compare these clusters with clusters in a ME/CFS cohort.
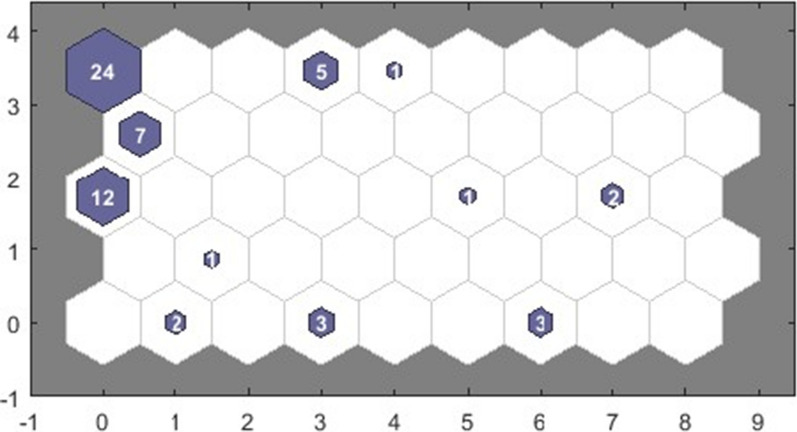
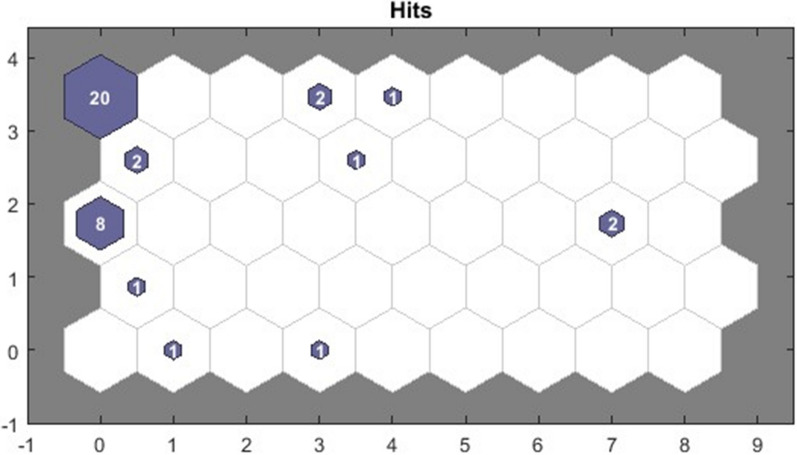
Methods: In this multicentre, prospective, observational cohort in the Netherlands, 95 post COVID-19 patients aged 40-65 years were included. Data collection at 3-6 months after infection included demographics, medical history, questionnaires, and a medical examination. Follow-up assessments occurred 9-12 months later, where the same data were collected. Fatigue was determined with the Fatigue Severity Scale (FSS), a score of ≥ 4 means moderate to high fatigue. The frequency and severity of other symptoms and the percentage of patients that meet the ME/CFS criteria were assessed using the DePaul Symptom Questionnaire-2 (DSQ-2). A self-organizing map was used to visualize the clustering of patients based on severity and frequency of 79 symptoms. In a previous study, 337 Dutch ME/CFS patients were clustered based on their symptom scores. The symptom scores of post COVID-19 patients were applied to these clusters to examine whether the same or different clusters were found.
Results: According to the FSS, fatigue was reported by 75.9% of the patients at 3-6 months after infection and by 57.1% of the patients 9-12 months later. Post-exertional malaise, sleep disturbances, pain, and neurocognitive symptoms were also frequently reported, according to the DSQ-2. Over half of the patients (52.7%) met the Fukuda criteria for ME/CFS, while fewer patients met other ME/CFS definitions. Clustering revealed specific symptom patterns and showed that post COVID-19 patients occurred in 11 of the clusters that have been observed in the ME/CFS cohort, where 2 clusters had > 10 patients.
Conclusions: This study shows persistent fatigue and diverse symptomatology in post COVID-19 patients, up to 12-18 months after SARS-CoV-2 infection. Clustering showed that post COVID-19 patients occurred in 11 of the clusters that have been observed in the ME/CFS cohort.
Keywords: Clusters; Fatigue; Long COVID; ME/CFS; Persistent symptoms; Post COVID-19 condition; Post-viral condition.
© 2024. The Author(s).
Conflict of interest statement
M.E.B.C., L.D.B., N.B., R.J.H.C.G.B., L.H., L.C.E.N. and A.H.M.: Public and private partners in the P4O2 consortium, as listed under ‘funding’. M.A.S. reports grants from Lung Foundation Netherlands, grants from Stichting Astma Bestrijding, grants and fees from Boehringer Ingelheim, and grants and personal fees from AstraZeneca, outside the submitted work. All payments were done to M.A.S. employer. S.B., A.W.V. and Q.D. declare that they have no competing interests.
Figures
Similar articles
-
A pilot cross-sectional investigation of symptom clusters and associations with patient-reported outcomes in Myalgic Encephalomyelitis/Chronic Fatigue Syndrome and Post COVID-19 Condition.Qual Life Res. 2024 Dec;33(12):3229-3243. doi: 10.1007/s11136-024-03794-x. Epub 2024 Oct 3. Qual Life Res. 2024. PMID: 39361124 Free PMC article.
-
Incidence and Prevalence of Post-COVID-19 Myalgic Encephalomyelitis: A Report from the Observational RECOVER-Adult Study.J Gen Intern Med. 2025 Apr;40(5):1085-1094. doi: 10.1007/s11606-024-09290-9. Epub 2025 Jan 13. J Gen Intern Med. 2025. PMID: 39804551 Free PMC article.
-
Improvement of Long COVID symptoms over one year.Front Med (Lausanne). 2023 Jan 9;9:1065620. doi: 10.3389/fmed.2022.1065620. eCollection 2022. Front Med (Lausanne). 2023. PMID: 36698810 Free PMC article.
-
The persistence of myalgic encephalomyelitis/chronic fatigue syndrome (ME/CFS) after SARS-CoV-2 infection: A systematic review and meta-analysis.J Infect. 2024 Dec;89(6):106297. doi: 10.1016/j.jinf.2024.106297. Epub 2024 Sep 29. J Infect. 2024. PMID: 39353473
-
[Post-COVID syndrome with fatigue and exercise intolerance: myalgic encephalomyelitis/chronic fatigue syndrome].Inn Med (Heidelb). 2022 Aug;63(8):830-839. doi: 10.1007/s00108-022-01369-x. Epub 2022 Jul 13. Inn Med (Heidelb). 2022. PMID: 35925074 Free PMC article. Review. German.
Cited by
-
Persistent symptoms and clinical findings in adults with post-acute sequelae of COVID-19/post-COVID-19 syndrome in the second year after acute infection: A population-based, nested case-control study.PLoS Med. 2025 Jan 23;22(1):e1004511. doi: 10.1371/journal.pmed.1004511. eCollection 2025 Jan. PLoS Med. 2025. PMID: 39847575 Free PMC article.
-
Effects of a symptom-titrated exercise program on fatigue and quality of life in people with post-COVID condition - a randomized controlled trial.Sci Rep. 2024 Dec 16;14(1):30511. doi: 10.1038/s41598-024-82584-4. Sci Rep. 2024. PMID: 39681609 Free PMC article. Clinical Trial.
-
Post infectious fatigue and circadian rhythm disruption in long-COVID and other infections: a need for further research.EClinicalMedicine. 2025 Jan 18;80:103073. doi: 10.1016/j.eclinm.2025.103073. eCollection 2025 Feb. EClinicalMedicine. 2025. PMID: 39896874 Free PMC article. Review.
-
LEF1-AS1 Deregulation in the Peripheral Blood of Patients with Persistent Post-COVID Symptoms.Int J Mol Sci. 2025 May 17;26(10):4806. doi: 10.3390/ijms26104806. Int J Mol Sci. 2025. PMID: 40429947 Free PMC article.
-
Health outcomes up to 3 years and post-exertional malaise in patients after hospitalization for COVID-19: a multicentre prospective cohort study (CO-FLOW).Lancet Reg Health Eur. 2025 Apr 6;53:101290. doi: 10.1016/j.lanepe.2025.101290. eCollection 2025 Jun. Lancet Reg Health Eur. 2025. PMID: 40636057 Free PMC article.
References
-
- World Health Organization . WHO Coronavirus (COVID-19) Dashboard. Geneva: WHO; 2022.
Publication types
MeSH terms
LinkOut - more resources
Full Text Sources
Medical
Miscellaneous
