. 2024 Feb 21;15(1):1302.
doi: 10.1038/s41467-024-45292-1.

Converging and evolving immuno-genomic routes toward immune escape in breast cancer

Affiliations

Converging and evolving immuno-genomic routes toward immune escape in breast cancer

Juan Blanco-Heredia et al. Nat Commun. .

Abstract

The interactions between tumor and immune cells along the course of breast cancer progression remain largely unknown. Here, we extensively characterize multiple sequential and parallel multiregion tumor and blood specimens of an index patient and a cohort of metastatic triple-negative breast cancers. We demonstrate that a continuous increase in tumor genomic heterogeneity and distinct molecular clocks correlated with resistance to treatment, eventually allowing tumors to escape from immune control. TCR repertoire loses diversity over time, leading to convergent evolution as breast cancer progresses. Although mixed populations of effector memory and cytotoxic single T cells coexist in the peripheral blood, defects in the antigen presentation machinery coupled with subdued T cell recruitment into metastases are observed, indicating a potent immune avoidance microenvironment not compatible with an effective antitumor response in lethal metastatic disease. Our results demonstrate that the immune responses against cancer are not static, but rather follow dynamic processes that match cancer genomic progression, illustrating the complex nature of tumor and immune cell interactions.


Conflict of interest statement

L.D.M.A. has received honoraria for participation in a speaker’s bureau/ consultancy from Roche and reports research collaboration and support from NanoString Technologies, Education grant: BMS, Lilly. L.D.M.A. is currently employed by BioNTech SE. H.H. is co-founder and shareholder of Omniscope, SAB member of Nanostring and MiRXES, and consultant to Moderna and Singularity. C.A.S. is a scientific associate of Dataomics Biotech. J.B.H. is currently affiliated with the Marie-Josée and Henry R. Kravis Center for Molecular Oncology, Memorial Sloan Kettering Cancer Center, New York, NY, USA. J.S.R.-F. reports receiving personal/consultancy fees from Goldman Sachs, Bain Capital, REPARE Therapeutics, Saga Diagnostics, MultiplexDX, and Paige.AI, membership of the scientific advisory boards of VolitionRx, REPARE Therapeutics and Paige.AI, membership of the Board of Directors of Grupo Oncoclinicas, and ad hoc membership of the scientific advisory boards of AstraZeneca, Merck, Daiichi Sankyo, Roche Tissue Diagnostics and Personalis, outside the scope of this study. J.S.R.-F. is currently employed by AstraZeneca. B.W. reports research funding from Repare Therapeutics, outside the scope of the submitted work. The other authors declare no competing interests.

Figures

Fig. 1
Fig. 1. Study schematics.
a Schematics of the study and anatomical map of biospecimen collection for sequential and parallel multiregion analyses of the index TNBC patient. Timeline is provided in days from the diagnosis. The index patient presented here was a 49-year-old woman diagnosed with a stage III TNBC (T2N3, estrogen receptor (ER), progesterone receptor (PR) and HER2 0+ negative, Ki67 60%, grade 3) with a 3.5 cm right breast cancer mass and lymph node involvement, who underwent multiple systemic therapies due to recurrences and metastatic progression over 2033 days of clinical follow-up. She underwent neoadjuvant chemotherapy with anthracycline and taxane achieving a pathological complete response after mastectomy. The patient presented multiple clinical recurrences at the chest wall from day 373, and achieved complete response with cisplatin-based therapy, surgery, and local radiotherapy. A second chest wall recurrence occurred around day 666 with partial response to bevacizumab-based therapy. Immunotherapy employing anti-PD-L1 monoclonal antibody atezolizumab was administered on day 799 after diagnosis, followed by in a rapid disease progression. However, a long-lasting complete response of 22 months was evidenced after a re-challenge of cisplatin and gemcitabine (day-854 to day 1519), after a previous response to the same drug had been 2.2 fold shorter (day 373 to day 666). The anti-PD-L1 administration before the re-challenge with cisplatin, although culminating in a rapid disease progression, could have contributed to the subsequent long-lasting antitumor response to cisplatin, motivating our investigation of immune escape. Subsequently, the patient presented a progression at the chest wall, and received anti-PD-1 (pembrolizumab) and chemotherapy, with stable disease for 4 months. Then, upon chest wall progression, pembrolizumab plus toll-like receptor (TLR) 7 agonist (topical) was administered in the chest wall metastases with a transient local complete response that lasted around 50 days. The patient received other lines of systemic therapy (i.e. palbociclib followed by cyclophosphamide, pegylated liposomal doxorubicin, cisplatin plus gemcitabine, paclitaxel plus bevacizumab, eribulin) (Supplementary Table 1) and expired on day 2033. Sequential chest wall images illustrate the clinical evolution of a TNBC patient over time. Postmortem parallel multiregion metastases were synchronous, affecting the same metastasis or metastases affecting different anatomical sites (separated into 2 or 3 sites when indicated) within the index patient as indicated. aPD-L1 anti-programmed death-ligand 1 monoclonal antibody, aPD-1 anti-programmed cell death protein 1 monoclonal antibody, TNBC triple-negative breast cancer, CR complete response, cf circulating free (DNA), M metastasis, P primary tumor, PR partial response, PD progressive disease, Rec recurrence, SD stable disease, TLR7 Toll-like receptor 7. b Schematics of 11 TNBC patients cohort included in the study as validation cohort and subjected to re-analysis of their WES and bulk RNA-seq data for primary tumors (n = 10) and parallel multiregion metastases (n = 46). AD adrenal, BO bone, BR brain, BT breast [metastasis], CH chest, KI kidney, LN lymph node, LU lung, LI liver, ME meninges, PB primary breast, PE pleura, SP Spine, ST soft tissue, SK skin.
Fig. 2
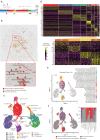
Fig. 2. Sequential TCR repertoires evolve over time leading to mixed dysfunctional single T cell states.
a Workflow of sequential TCRβ detected from nine metastases: 4 on-treatment (M0-day 373, M1-day 799, M2-day 1687, M3-day 1687) at distinct time points and 5 parallel multiregion postmortem metastases. scRNA-seq and scTCR-seq analyzed in isolated T cells from peripheral blood (day 2031). aPD-L1, anti-programmed death-ligand 1 monoclonal antibody; aPD-1 anti-programmed cell death protein 1 monoclonal antibody, CR complete response, M metastasis, PR partial response, PD progressive disease, Rec recurrence, SD stable disease, SC single-cell, TCRα T cell receptor alpha chain, TCRβ T cell receptor beta chain, TLR7 Toll-like receptor 7. b TCRβ CDR3 repertoire joined network to elucidate subnetworks private to on-treatment sequential chest wall metastases (yellow) or to parallel multiregion metastases (red) or shared to both sets of metastases (purple). Insert on the bottom shows amino acid sequences from a parallel multiregion metastases-specific subnetwork. Each node’s size corresponds to the number of samples where the sequence has been detected. Edges were formed between nodes only when the edit distance between the two CDR3 sequences equaled 1. Source data are provided as a Source Data file. c Uniform manifold approximation and projection (UMAP) analysis that displays single-cell transcriptomic landscape of sorted CD3+CD19- single T cells. Single T cells are colored by expression cluster, based on gene expression difference, of 11 T cell subsets and functional states. Mean unique molecular identifier (UMI) counts per cell were 3726 with a median number of genes detected per cell of 1254 (98.92% CD3+ cells of all cells, 97.17% expressing CD3ε, 89.83% expressing CD3δ). Clusters with percentages above 2% are depicted. Source data are provided as a Source Data file. d Heatmap from the scRNA-seq showing 9 clusters of T cell subpopulations resolved by z-scored differential expression of curated T cell marker genes. Caption shows four subclusters integrated within cluster 6. The top markers that define each one of those clusters are highlighted in red. Cluster 9 was characterized by cells with few detected genes and a high fraction of mitochondrial counts indicative of damaged cells. Source data are provided as a Source Data file. e UMAP embedding single cells from peripheral blood showing TCR clonotypes classified as singletons or expanded (N = 5204 cells with TCR) were projected onto the UMAP of peripheral blood T cells. Source data are provided as a Source Data file. f UMAP embedding single T cells from peripheral blood (N = 1284) and barplot colored by TCR clonotypes found in on-treatment sequential metastases (yellow), parallel multiregion metastases (red) or present in both tumor sources (purple). Source data are provided as a Source Data file.
Fig. 3
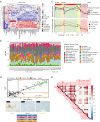
Fig. 3. Antigen-presenting machinery and immune signatures map metastases revealing immune escape.
a Unsupervised hierarchical clustering on gene signatures across sequential and parallel multiregion metastases. Gene expression for immune cell markers is represented by normalized log2 counts. b RNA-seq based CIBERSORT, which deconvolves 22 immune cells, was applied to both the index case (M1-day 799 chest wall metastases and 17 multiregion parallel metastases) and the TNBC cohort (10 primary tumors, 42 multiregion metastases). Source data are provided as a Source Data file. c Longitudinal monitoring of APM, IFNy signaling and tumor proliferation signature scores, cytotoxic T cell (CTLs) abundance, represented as per CD8 T cells, Th1 cells, and NK cells gene expression scores. Gene expression levels are represented by normalized log2 counts. An interferon-based tumor inflammation signature (TIS) which integrates the IFNy signaling and APM signatures, was contextualized across 113 primary TNBCs of the TCGA dataset (mean score 6.48). Gray dotted lines represent the median TIS score derived from these primary TNBCs of the TCGA. Source data are provided as a Source Data file. aPD-L1 anti-programmed death-ligand 1 monoclonal antibody, aPD-1 anti-programmed cell death protein 1 monoclonal antibody, CR complete response, d day, M metastasis, PR partial response, PD progressive disease, Rec recurrence, SD stable disease, TLR7 Toll-like receptor 7. d Immunophenotype status, defined by IFNy signaling and APM signatures, mapped as inflamed (IFNy high, APMhigh), desert (IFNylow, APMhigh/low), excluded (IFNyhigh, APMlow). The median value of APM and IFN signatures relative to the immunophenotype distribution is defined as the cutoff for the stratification. The blue line represents the linear regression and its 95% confidence interval for the APM signature in function of the INFy signaling expression. Source data are provided as a Source Data file. Representative micrographs of inflamed, desert, and excluded tumors are shown below the immunophenotype map to display a metastasis with a high level of immune infiltration (inflamed), immune cell accumulation but not efficiently infiltrated (excluded), low/absent level of immune infiltration (desert). Scans in 40× objective, scale bar 0.2 mm in each IHC panel. e Spearman correlation matrix of HLA-related gene expression profiles and number of imbalanced HLA class I alleles (0, 1, 2, and 3) among 20 parallel multiregion metastases of the index case. Red color represents positive correlation whereas blue represents negative correlations. Color intensity and size of the circle are proportional to the correlation coefficients, which are depicted in the legend to the right. Blank squares correspond to non-significant (p-values > 0.05) correlations. Source data are provided as a Source Data file.
Fig. 4
Fig. 4. T cell exhaustion score and soluble PD-L1 and IFNy follow the immune evolution during metastatic progression.
a Barplot showing quantification of T cell exhaustion metagene. The T cell exhaustion metagene score was applied to the specimens of the TNBC index patient (M1-day 799 chest wall metastasis, obtained before treatment with an immune checkpoint inhibitor atezolizumab, and 17 parallel multiregion metastases) and the cohort of 10 TNBC patients (10 primary tumors and 42 multiregion metastases) that have RNA-seq gene expression available. Source data are provided as a Source Data file. b Longitudinal monitoring of soluble PD-L1 and IFNy as liquid biopsies (proteomic level) and in tissue (gene expression scores). Clinical responses are depicted. Source data are provided as a Source Data file. aPD-L1 anti-programmed death-ligand 1 monoclonal antibody, aPD-1 anti-programmed cell death protein 1 monoclonal antibody, CR complete response, d day, PR partial response, PD progressive disease, Rec recurrence, SD stable disease, TLR7 Toll-like receptor 7.
Fig. 5
Fig. 5. Clonal architecture and Neoantigen timing of sequential and parallel metastases of the index patient.
a Clonal architecture and timing of sequential and parallel metastases of the index patient. Bell plots showing the clonal composition and evolution of metastases in time and space. Clustering of mutations by cancer cell fraction (CCF) among metastases was performed by PyClone-vi, resulting in 9 clusters, where mutations in cluster 1 were inferred as clonal. The clonal admixture inferred from each metastasis is represented. Source data are provided as a Source Data file. Tumor mutation burden (TMB) (mutations per megabase, M/Mb), the number of neoantigens and the Shannon subclonality index are shown for chest wall tumors and parallel multiregion metastases. b TNBC patient clonal history is shown by sequential (temporal) and spatial phylogenetic trees, where the nodes represent the clones; branches represent evolution paths (length scaled by the square root of number of clonal marker mutations). Branches are labeled with potential driver mutations, and clone nodes are labeled with cluster identification. Source data are provided as a Source Data file. A frameshift mutation in TP53 (T256fs) was characterized as a truncal driver mutation present in all metastases. T cell reactivity against TP53 T256fs by IFNy ELISpot of PBMCs (day 2031) is shown. Thresholds for positive responses were determined as at least five spots (50 SFC/106 PBMCs) after background subtraction. c Molecular clock hierarchical clustering analysis depicting Mutation Time (y-axis, defined by T1.histBeta) for sequential P0 (primary), M0-day 373, M1-day 799, M3-day 1687 chest wall tumors, and 20 parallel multiregion metastases. Histograms illustrate the distribution of event timing within these samples, categorized as early (lowest quartile, Q25), intermediate (inter, Q25–75), or late (highest quartile, Q75) based on the criteria detailed in the methods section. Source data are provided as a Source Data file. Pie charts depict the distribution of the inferred Neoantigen Time: neo-early (% neoantigens that appear early on), neo-inter, and neo-late (% neoantigens that appear late on). d Violin plots of subclonal mutations among early, inter, and late metastases, depicting the proportion of subclonal mutations (top) and subclonal neoantigens (bottom), respectively. N = 24 biologically independent samples in both the upper and lower panels, representing primary tumor, sequential, and parallel multiregion metastases. Statistical analysis among groups made by one-way ANOVA with Tukey’s test for multiple comparisons is shown. Boxplot limits indicate the interquartile range (IQR; 25th–75th percentile), with a center line indicating the median. Whiskers show the value ranges up to 1.5 × IQR above the 75th or below the 25th percentile with outliers beyond those ranges shown as individual points. The color of metastases refers to the organ of origin. Source data are provided as a Source Data file. e T1.hisBeta, used to define each sample’s molecular time (i.e. Mutation and Neoantigen Time) and to order sequential and parallel multiregion metastases, was negatively correlated to TCR Inverse Simpson Diversity (Log 10) (p-value = 0.0011). Pearson correlation test, two-sided, no adjustments were made for multiple comparisons. P-value < 0.05 is considered statistically significant. Source data are provided as a Source Data file. f Integration of key immune and genomic parameters with Neoantigen Time. Spearman correlation test, two-sided, matrix of key immune (exhaustion score, gene expression immunophenotype, CD8 T cells, and cytotoxic cells) and tumor-related (HLA imbalance, Shannon subclonality) parameters and Neoantigen Time among sequential and parallel multiregion metastases of the index case (N = 24 biologically independent samples). Red color represents positive correlation whereas blue represents negative correlations. Color intensity and size of the circle are proportional to the correlation coefficients, which are depicted in the legend to the right. Blank squares correspond to non-significant (p-values > 0.05) correlations.

Similar articles

Cited by

References

    1. Gruosso T, et al. Spatially distinct tumor immune microenvironments stratify triple-negative breast cancers. J. Clin. Invest. 2019;129:1785–1800. doi: 10.1172/JCI96313. - DOI - PMC - PubMed
    1. Zhang X, et al. Breast cancer neoantigens can induce CD8+ T-cell responses and antitumor immunity. Cancer Immunol. Res. 2017;5:516–523. doi: 10.1158/2326-6066.CIR-16-0264. - DOI - PMC - PubMed
    1. Narang, P., Chen, M., Sharma, A. A., Anderson, K. S. & Wilson, M. A. The neoepitope landscape of breast cancer: Implications for immunotherapy. BMC Cancer10.1186/s12885-019-5402-1 (2019). - PMC - PubMed
    1. Denkert C, et al. Tumour-infiltrating lymphocytes and prognosis in different subtypes of breast cancer: a pooled analysis of 3771 patients treated with neoadjuvant therapy. Lancet Oncol. 2018;19:40–50. doi: 10.1016/S1470-2045(17)30904-X. - DOI - PubMed
    1. Luen SJ, Savas P, Fox SB, Salgado R, Loi S. Tumour-infiltrating lymphocytes and the emerging role of immunotherapy in breast cancer. Pathology. 2017;49:141–155. doi: 10.1016/j.pathol.2016.10.010. - DOI - PubMed