. 2024 Feb 21;15(2):158.
doi: 10.1038/s41419-024-06467-2.

HMGA1 drives chemoresistance in esophageal squamous cell carcinoma by suppressing ferroptosis

Affiliations

HMGA1 drives chemoresistance in esophageal squamous cell carcinoma by suppressing ferroptosis

Jing-Yu Yang et al. Cell Death Dis. .

Abstract

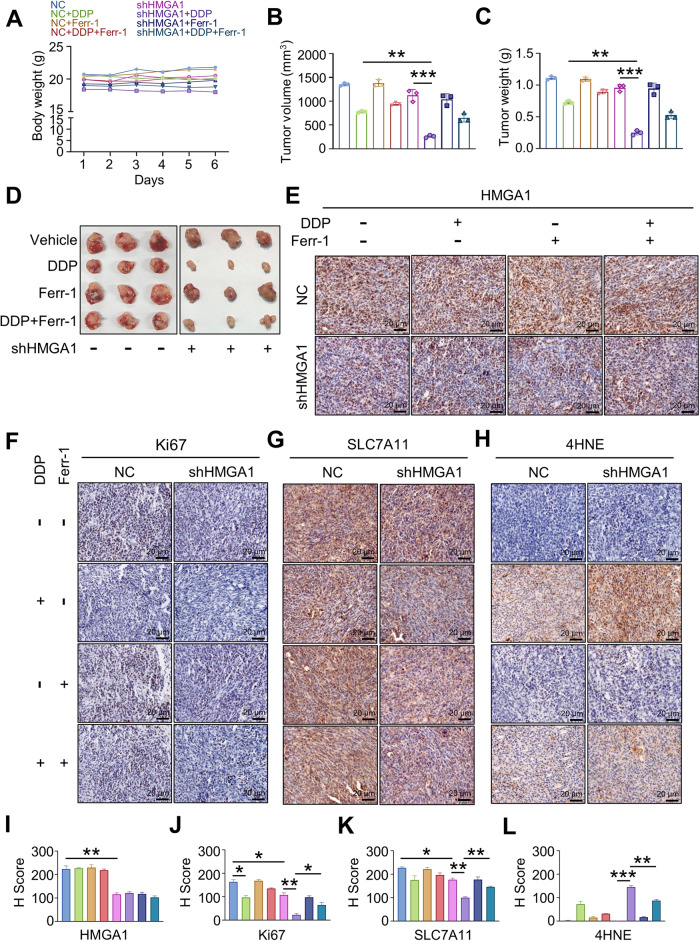
Chemotherapy is a primary treatment for esophageal squamous cell carcinoma (ESCC). Resistance to chemotherapeutic drugs is an important hurdle to effective treatment. Understanding the mechanisms underlying chemotherapy resistance in ESCC is an unmet medical need to improve the survival of ESCC. Herein, we demonstrate that ferroptosis triggered by inhibiting high mobility group AT-hook 1 (HMGA1) may provide a novel opportunity to gain an effective therapeutic strategy against chemoresistance in ESCC. HMGA1 is upregulated in ESCC and works as a key driver for cisplatin (DDP) resistance in ESCC by repressing ferroptosis. Inhibition of HMGA1 enhances the sensitivity of ESCC to ferroptosis. With a transcriptome analysis and following-up assays, we demonstrated that HMGA1 upregulates the expression of solute carrier family 7 member 11 (SLC7A11), a key transporter maintaining intracellular glutathione homeostasis and inhibiting the accumulation of malondialdehyde (MDA), thereby suppressing cell ferroptosis. HMGA1 acts as a chromatin remodeling factor promoting the binding of activating transcription factor 4 (ATF4) to the promoter of SLC7A11, and hence enhancing the transcription of SLC7A11 and maintaining the redox balance. We characterized that the enhanced chemosensitivity of ESCC is primarily attributed to the increased susceptibility of ferroptosis resulting from the depletion of HMGA1. Moreover, we utilized syngeneic allograft tumor models and genetically engineered mice of HMGA1 to induce ESCC and validated that depletion of HMGA1 promotes ferroptosis and restores the sensitivity of ESCC to DDP, and hence enhances the therapeutic efficacy. Our finding uncovers a critical role of HMGA1 in the repression of ferroptosis and thus in the establishment of DDP resistance in ESCC, highlighting HMGA1-based rewiring strategies as potential approaches to overcome ESCC chemotherapy resistance. Schematic depicting that HMGA1 maintains intracellular redox homeostasis against ferroptosis by assisting ATF4 to activate SLC7A11 transcription, resulting in ESCC resistance to chemotherapy.


Conflict of interest statement

The authors declare no competing interests.

Figures

None
Schematic depicting that HMGA1 maintains intracellular redox homeostasis against ferroptosis by assisting ATF4 to activate SLC7A11 transcription, resulting in ESCC resistance to chemotherapy.
Fig. 1
Fig. 1. HMGA1 is highly expressed in ESCCs.
HMGA1 expression was visualized in ESCC single-cell sequencing (scRNA-seq) data from the GEO database and validated at the histological level. A The UMAP map of the single-cell ESCC landscape was colored by cell subtypes. B The heatmap showed the expression levels of different cell subtype signatures in scRNA-seq data. C The UMAP map showed the distribution of epithelial cells from normal (blue) and tumor (red) in scRNA-seq database. D The UMAP map showed expression levels of HMGA1 in various cell subtypes in normal and tumor from scRNA-seq data. E Expression levels of HMGA1 in different cell subtypes. F Expression levels of HMGA1 in epithelial cells from normal esophagus and tumor in the scRNA-seq data. G Differential expression of HMGA1 in esophageal cancers in TCGA database. H, I Representative IHC staining images of HMGA1 in adjacent tissues and tumors from 167 patients with esophageal cancer. Scale bar: 50 μm. H-scores of HMGA1 expression in tissues were determined. At least 200 cells in each tissue were calculated (***P < 0.001, n = 167).
Fig. 2
Fig. 2. HMGA1 enhances the resistance of ESCCs to cisplatin.
A Overall survival of esophageal cancer patients categorized by differentiation of tumor and chemotherapy. Data were extracted from the SEER database. B Cell viability of control and HMGA1 knockdown KYSE30 cells treated with different concentrations of cisplatin. CCK8 assay was used for the assessment. CJ Quantification of cell death, cell viability and proliferation in HMGA1-manipulated ESCC cells treated with DDP. C and D, PI staining was used for detecting cell death in HMGA1 overexpression and knockdown cells treated with 20 μM DPP for 48 h. CCK8 assay (E) and colony formation assay (F, G) to determine cell growth in HMGA1 overexpression KYSE70 cells treated with DDP (20 μM) for 48 h. CCK8 assay (H) and colony formation assay (I, j) to determine cell growth in HMGA1 knockdown KYSE30 cells treated with DDP (20 μM) for 48 h. Colony formation assay was performed using HMGA1 overexpression and knockdown ESCC cells treated with 20 μM DDP for 48 h and cultured for 2 weeks. Scale bar = 1.8 cm. Data represent mean ± SEM. **P < 0.01 and *** P < 0.001, n = 3.
Fig. 3
Fig. 3. HMGA1 inhibits cisplatin-induced ferroptosis.
Inhibitors of ferroptosis, apoptosis, and necrosis were used to treat HMGA1 knockdown KYSE30 cells. A HMGA1-manipulated KYSE30 cells were treated with 20 μM DDP for 8 h. After the treatment, whole cell extracts were collected for the western blot analysis. B, C KYSE30 cells with control and HMGA1 knockdown were treated with 20 μM DDP and 1 μM Ferr-1, 1 μM STS, 20 μM Z-V, or 2 μM Nec for 36 h. CCK8 assays were used for the determination of cell viability. DF PI staining was performed to test cell death in HMGA1-manipulated KYSE30 cells treated with 20 μM DDP and 1 μM Ferr-1, 1 μM STS, 20 μM Z-V, or 2 μM Nec for 36 h. Data represent mean ± SEM. **P < .01 and ***P < .001, n = 3.
Fig. 4
Fig. 4. HMGA1 affects ESCC resistance to ferroptosis.
The effect of erastin-induced ferroptosis was tested in HMGA1 knockdown KYSE30 cells. A KYSE30 control or HMGA1 knockdown cells were treated with 5 μM erastin and / or 1 μM Ferr-1 for 8 h. After the treatment, whole cell extracts were collected for the western blot analysis. B, C, PI staining for determining cell death in control and HMGA1 knockdown cells treated with erastin (5 μM) for 36 h. D NADPH in KYSE30 cells. KYSE30 control or HMGA1 knockdown cells were treated with 5 μM erastin inthe presence or absence of 1 μM Ferr-1 for 12 h. The cells were then collected for the measurement of NADPH by a NADPH assay kit. E KYSE30 control or HMGA1 knockdown cells were treated with 5 μM erastin and 1 μM Ferr-1 for 12 h. Cells were then fixed for the analysis by TEM. Scale bars: 500 nm (rows 1 and 3) and 200 nm (rows 2 and 4). F MDA assay kit was used to determine the MDA content in control and HMGA1 knockdown KYSE30 cells treated with erastin and/or Ferr-1. G GSH assay kit was used to determine the GSH content in control and HMGA1 knockdown KYSE30 cells treated with erastin and/or Ferr-1. H FerroOrange (detection probe) was used to determine the content of ferrous ions in control and HMGA1 knockdown KYSE30 cells treated with erastin and/or Ferr-1. Data represent mean ± SEM. *P < 0.05, **P < .01, and ***P < 0.001, n = 3.
Fig. 5
Fig. 5. HMGA1 upregulates SLC7A11 to suppress ferroptosis.
A RNA-seq was performed using KYSE30 control and HMGA1 knockdown cells. Gene Set Enrichment Analysis (GSEA) was used for analyzing RNA-seq data. B Venn diagrams showing gene changes in GEO data (GSE23400), FerrDb data, and RNA-seq data in A. Overlapped genes in the three cohorts were identified. C Heatmap analysis of RNA-seq data in A for identifying ferroptosis-associated gene expression in ESCC cells as indicated. D Disease-free survival analysis based on SLC7A11 expression in esophageal cancer from TCGA database. The total number of cases is 86, with 10 cases of high expression of SLC7A11 and 76 cases of normal expression of SLC7A11. E Spearman’s correlation analysis between HMGA1 and SLC7A11 expression in ESCCs in TCGA. F Expression of SLC7A11 protein and mRNA after knockdown of HMGA1 in KYSE30 cells. G Representative IHC staining of HMGA1 and SLC7A11 in paired ESCC tissues. The pathological slides are from tumors and adjacent tissues of 40 patients with ESCC. Scale bar: 50 μm. H, J MDA in KYSE30 cells and KYSE70 cells with the manipulation of HMGA1 and SLC7A11. An MDA assay kit was used for the measurement. I, K, Determination of GSH content in KYSE30 cells and KYSE70 cells with the manipulation of HMGA1 and SLC7A11 using a GSH assay kit. Data represent mean ± SEM. *P < 0.05, **P < 0.01, and ***P < 0.001, n = 3.
Fig. 6
Fig. 6. HMGA1 promotes SLC7A11 transcription via ATF4.
A Western blotting detection of FLAG-SLC7A11 in siHMGA1 KYSE30 cells. B Luciferase reporter assays for SLC7A11 promoter activity were performed in KYSE30 cells following HMGA1 knockdown. C Control and HMGA1 knockdown KYSE30 cells were analyzed by ATAC-seq. Shown is the SLC7A11 promoter region with transcription factor binding peaks. Boxed is the ATF4 binding site around the transcriptional start site (TSS). D Reciprocal immunoprecipitation for detecting the interaction between HMGA1 and ATF4. KYSE30 cell lysates were immunoprecipitated with either IgG or HMGA1 antibody. Input and precipitated proteins were analyzed by immunoblot with the indicated antibodies. E Potential binding regions of ATF4 in the promoter of SLC7A11, denoted as Region1, Region2, Region3, were identified based on the sequencing analysis. F ChIP assays of KYSE30 cells using an anti-ATF4 antibody or nonspecific IgG. The binding of ATF4 to the SLC7A11 promoter was decreased when HMGA1 was knockdown in KYSE30 cells. G Mutations of ATF4 binding site (ABS) sequences in the SLC7A11 promoter. H Luciferase reporter assays for the mutant ABS-transduced KYSE30 cells following HMGA1 knockdown. I, J Luciferase reporter assays were performed in KYSE30 cells with the manipulation of HMGA1 followed by ATF4 overexpression or silence. K Diagram showing that HMGA1 assists ATF4 in binding to Region1 and Region2 on the SLC7A11 promoter. Data represent mean ± SEM. *P < 0.05, **P < 0.01, and ***P < 0.001, n = 5.
Fig. 7
Fig. 7. Knockdown of HMGA1 enhances the sensitivity of mouse subcutaneous tumors to cisplatin.
Murine esophageal AKR cells were transfected with shRNA of HMGA1 and a stable HMGA1 knockdown cell line was established. One million of the cells were used for the subcutaneous tumor assay. A Body weight of mice treated with DDP (5 mg/kg) (n = 3). B, C Tumor volume and weight of subcutaneous allograft tumors developed from esophageal cancer cells with HMGA1 knockdown (n = 3). The tumor volumes were calculated according to the formula (L × W2)/2 and presented as mean ± SEM. D Representative allograft tumors following subcutaneous injection of HMGA1 knockdown AKR cells and treatment with DDP (5 mg/kg) and Ferr-1 (4 mg/kg). EL, Representative IHC staining of HMGA1, Ki67, SLC7A11, and 4-HNE in allograft tumor tissues. Scale bar: 20 μm. H-scores of the stainings were calculated. At least 200 cells in each mouse tissue were counted. *P < 0.05, **P < 0.01, and ***P < 0.001, n = 3.
Fig. 8
Fig. 8. Knockout of HMGA1 enhances the sensitivity of primary ESCCs to cisplatin in mice.
A A primary ESCC model was established using 4NQO induction in HMGA1flox/flox mice (control) and HMGA1flox/floxK14Cre+ mice (mice with systemic epithelial cell-specific HMGA1 knockout). B Representative HE staining of primary ESCCs in HMGA1flox/flox mice and HMGA1flox/floxK14Cre+ mice. Scale bar: 50 μm. C–E Representative IHC staining of HMGA1, SLC7A11, and 4-HNE in primary ESCCs in HMGA1flox/flox mice and HMGA1flox/flox K14Cre+ mice. Scale bar: 50 μm.

References

    1. Schweigert M, Dubecz A, Stein HJ. Oesophageal cancer-an overview. Nat Rev Gastroenterol Hepatol. 2013;10:230–44. doi: 10.1038/nrgastro.2012.236. - DOI - PubMed
    1. Smyth EC, Lagergren J, Fitzgerald RC, Lordick F, Shah MA, Lagergren P, et al. Oesophageal cancer. Nat Rev Dis Prim. 2017;3:17048. doi: 10.1038/nrdp.2017.48. - DOI - PMC - PubMed
    1. Yang YM, Hong P, Xu WW, He QY, Li B. Advances in targeted therapy for esophageal cancer. Signal Transduct Target Ther. 2020;5:229. doi: 10.1038/s41392-020-00323-3. - DOI - PMC - PubMed
    1. Shi S, Huang X, Ma X, Zhu X, Zhang Q. Research of the mechanism on miRNA193 in exosomes promotes cisplatin resistance in esophageal cancer cells. PLoS One. 2020;15:e0225290. doi: 10.1371/journal.pone.0225290. - DOI - PMC - PubMed
    1. van Hagen P, Hulshof MC, van Lanschot JJ, Steyerberg EW, van Berge, Henegouwen MI, et al. Preoperative chemoradiotherapy for esophageal or junctional cancer. N. Engl J Med. 2012;366:2074–84. doi: 10.1056/NEJMoa1112088. - DOI - PubMed

Publication types

MeSH terms