. 2024 Feb 21;14(1):105.
doi: 10.1038/s41398-024-02819-w.

A multimodal deep learning approach for the prediction of cognitive decline and its effectiveness in clinical trials for Alzheimer's disease

Affiliations

A multimodal deep learning approach for the prediction of cognitive decline and its effectiveness in clinical trials for Alzheimer's disease

Caihua Wang et al. Transl Psychiatry. .

Abstract

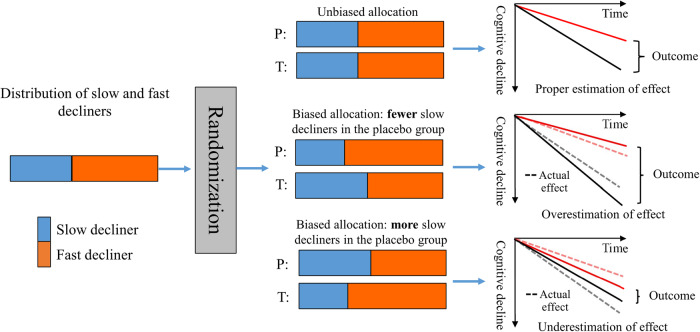
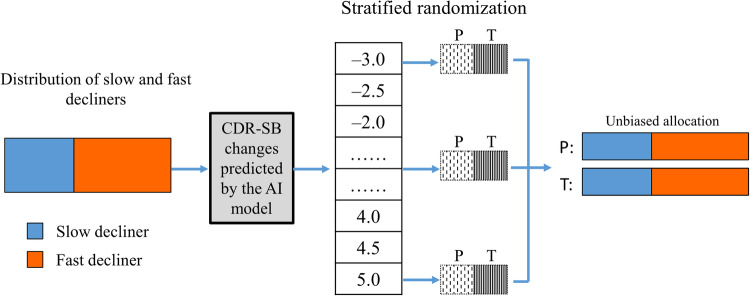
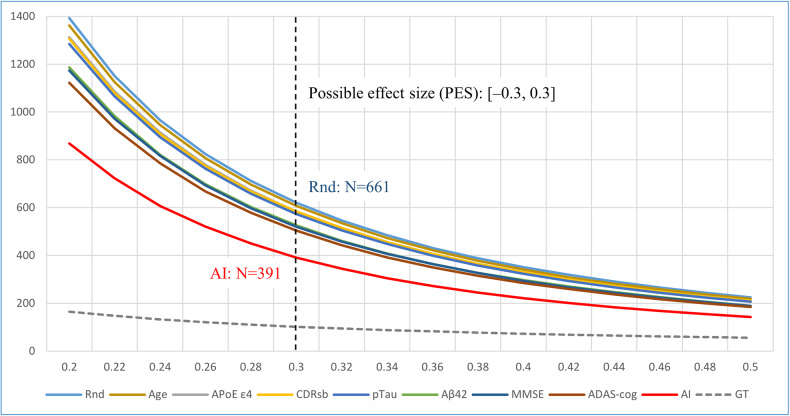
Alzheimer's disease is one of the most important health-care challenges in the world. For decades, numerous efforts have been made to develop therapeutics for Alzheimer's disease, but most clinical trials have failed to show significant treatment effects on slowing or halting cognitive decline. Among several challenges in such trials, one recently noticed but unsolved is biased allocation of fast and slow cognitive decliners to treatment and placebo groups during randomization caused by the large individual variation in the speed of cognitive decline. This allocation bias directly results in either over- or underestimation of the treatment effect from the outcome of the trial. In this study, we propose a stratified randomization method using the degree of cognitive decline predicted by an artificial intelligence model as a stratification index to suppress the allocation bias in randomization and evaluate its effectiveness by simulation using ADNI data set.


Conflict of interest statement

The authors declare no competing interests.

Figures

Fig. 1
Fig. 1. Three cases of biases occurred in allocating participants to the treatment and placebo groups (T and P in the figure, respectively) in clinical trials.
Solid lines in the right part of the figure represent the cognitive decline in the treatment and placebo groups observed during the trial period, and dashed lines represent the cognitive decline in the two groups when there were no allocation bias and no treatment applied. When the participants were unbiasedly allocated to the treatment and placebo groups, the treatment effect could be properly evaluated with the outcome of the trial. Otherwise, when more fast cognitive decliners were allocated to the placebo group, the treatment effect was over-evaluated, and vice versa in the opposite case. The over-/underestimated effects were equal to the allocation bias between the treatment and placebo groups.
Fig. 2
Fig. 2. A hybrid multimodal machine learning framework for predicting CDR-SB changes.
Multiple DNN models were trained to extract image features from several subregions of the brain related to cognitive decline, such as the hippocampus and anterior temporal lobe. A multitask loss including image recovery, decliner and non-decliner classification, and CDR-SB changes regression was used to train the DNN models to extract the image features robustly. The extracted image features and non-image information were then used in linear support vector machine regression (SVR) to predict CDR-SB changes.
Fig. 3
Fig. 3. Scheme of stratified randomization using predictions of CDR-SB changes outputted by the AI model.
According to the predicted CDR-SB changes, the participants were first stratified into subgroups (or strata). The participants in each subgroup (or stratum) were then randomly allocated into treatment and placebo groups (T and P in the figure, respectively) in equal numbers. The participants allocated to the treatment groups in all stratified subgroups was collected to the treatment group of the trial, and the others to the placebo group.
Fig. 4
Fig. 4. Prediction results of the samples used for randomization simulation.
a Histogram of absolute errors of predicted CDR-SB changes by the AI model; (b) correlation of predicted CDR-SB changes and the ground truth.
Fig. 5
Fig. 5. Distributions of allocation biases of CDR-SB changes.
Distributions of allocation biases of CDR-SB changes in the treatment and placebo groups caused by the non-stratified randomization method (a) and stratified randomization method predictions of CDR-SB changes outputted by AI mode for stratification (b). Each distribution was obtained by simulating the corresponding randomization method 10,000 times. Dashed gray lines show the 95% range of the distributions, which corresponds to the 95% range of effect sizes possibly observed when the treatment effect was null. The effect size possibly observed when the treatment effect was null is called the possible effect size (PES) in this study.
Fig. 6
Fig. 6. Standard allocation error (SAE) in CDR-SB changes and Cohen’s d of each randomization method.
Rnd: non-stratified randomization, and age, CDR-SB, ApoE ε4, pTau, Aβ42, MMSE, and ADAS-cog: stratified randomization using each index for stratification. AI and GT: stratified randomization using predictions of the AI model and actual CDR-SB changes (ground truth [GT]) for stratification, respectively. The SAE in CDR-SB changes and that in Cohen’s d are approximately in constant proportionality for all randomization methods.
Fig. 7
Fig. 7. Minimum sample sizes needed for different randomization methods to obtain the same given 95% range of possible effect size (PES) in CDR-SB changes.
Horizontal axis: the upper bound of the 95% range of PES. Rnd: simple randomization without stratification. Age, CDR-SB, ApoE ε4, pTau, Aβ42, MMSE, and ADAS-cog: stratified randomization using each index. AI and GT: stratified randomization using predictions by the AI model and actual values (ground truth; GT) of CDR-SB changes, respectively. For example, the minimum sample sizes for non-stratified and stratified randomization using AI predictions to obtain the same 95% range of the PES of [–0.3, 0.3] were 661 and 391, respectively.
Fig. 8
Fig. 8. Distributions of P values and over-/under-detection of actual treatment effects.
a Distributions of P values (shown with median, 25th and 75th percentiles) obtained by non-stratified randomization (Rnd), stratified randomizations using AI predictions (AI) and the ground truth (GT) of CDR-SB changes. The horizontal axis shows the treatment effects, defined as suppressing CDR-SB changes in the treatment group by x%, and the vertical axis shows P values. P values calculated with perfect randomization without bias (NoBias) are also shown. Medians of the P values of three randomization methods overlapped with that obtained with perfect randomization. The borderline of treatment effects corresponding to the threshold P value (P = 0.05) existed where the P value obtained by perfect randomization was equal to the threshold. Under-detection of treatment effects occurred in the 1st quadrant formed by the threshold of P = 0.05 and the borderline. On the other hand, over-detections occurred in the 3rd quadrant. b Detection rates of treatment effects applied to the treatment group, separately evaluated for two cases of whether the mean value of the GT of CDR-SB changes of the placebo was larger (above) or smaller (below) than that of the treatment group after allocation and before treatment effects were applied.

Similar articles

Cited by

References

    1. Alzheimer’s Association. 2022 Alzheimer’s disease facts and figures. Alzheimer’s Dement. 2022;18:700–89. doi: 10.1002/alz.12638. - DOI - PubMed
    1. Cummings J, Lee G, Nahed P, Kambar K, Zhong K, Fonseca J, et al. Alzheimer’s disease drug development pipeline: 2022. Alzheimer’s Dement. 2022;8:e12295. doi: 10.1002/trc2.12295. - DOI - PMC - PubMed
    1. Ostrowitzki S, Lasser R, Dorfliger E, Schetens P, Baekhof F, Nicolcheva T, et al. A phase III randomized trial of gantenerumab in prodromal Alzheimer’s disease. Alzheimer’s Res Ther. 2017;9:95. doi: 10.1186/s13195-017-0318-y. - DOI - PMC - PubMed
    1. Knopman DS, Jones DT, Greicius MD. Failure to demonstrate efficacy of aducanumab: an analysis of the EMERGE and ENGAGE trials as reported by Biogen, December 2019. Alzheimer’s Dement. 2021;17:696–701. doi: 10.1002/alz.12213. - DOI - PubMed
    1. O’Bryant SE, Waring SC, Cullum CM, Hall J, Lacritz C, et al. Staging dementia using Clinical Dementia Rating Scale sum of boxes scores. Arch Neurol. 2008;65:1091–5. doi: 10.1001/archneur.65.8.1091. - DOI - PMC - PubMed