. 2024 Feb 21;15(1):1584.
doi: 10.1038/s41467-024-45821-y.

Integrating single-cell and spatially resolved transcriptomic strategies to survey the astrocyte response to stroke in male mice

Affiliations

Integrating single-cell and spatially resolved transcriptomic strategies to survey the astrocyte response to stroke in male mice

Erica Y Scott et al. Nat Commun. .

Abstract

Astrocytes, a type of glial cell in the central nervous system (CNS), adopt diverse states in response to injury that are influenced by their location relative to the insult. Here, we describe a platform for spatially resolved, single-cell transcriptomics and proteomics, called tDISCO (tissue-digital microfluidic isolation of single cells for -Omics). We use tDISCO alongside two high-throughput platforms for spatial (Visium) and single-cell transcriptomics (10X Chromium) to examine the heterogeneity of the astrocyte response to a cortical ischemic stroke in male mice. We show that integration of Visium and 10X Chromium datasets infers two astrocyte populations, proximal or distal to the injury site, while tDISCO determines the spatial boundaries and molecular profiles that define these populations. We find that proximal astrocytes show differences in lipid shuttling, with enriched expression of Apoe and Fabp5. Our datasets provide a resource for understanding the roles of astrocytes in stroke and showcase the utility of tDISCO for hypothesis-driven, spatially resolved single-cell experiments.


Conflict of interest statement

M.D. and A.R.W. are co-inventors on a patent application (Applicants: The governing council of the University of Toronto, and Sinai Health System; Inventors: Michael Dryden and Aaron R Wheeler; Application Number: PCT/CA2017/051158 (filed 20.09.2019); Status: Pending; Specific Aspect of Manuscript: System and method for identifying and targeting individual cells within a cell population for selective extraction of cellular content with a pulsed laser within a digital microfluidic device.

Figures

Fig. 1
Fig. 1. Schematic of sequencing technologies used to study astrocytes in stroke.
A broad overview of stroke over time (d2 acute, d10 subacute, d21 chronic) was performed using spatially resolved tiles (consisting of multiple cells) with the commercial 10x Visium. Next, astrocyte heterogeneity was examined in suspensions of individual astrocytes isolated from the stroke-injured cortex in the sub-acute stage using 10x Chromium. Finally, to spatially resolve the molecular profiles of individual astrocytes in sub-acute stroke, single astrocytes were captured at various distances from the injury site and analyzed using tDISCO. Biorender was used to create the schematic.
Fig. 2
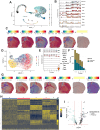
Fig. 2. Shifts in broad spatial transcriptional profiles across time post-stroke.
A Visium d2, d10, and d21 brain sections (columns) with overlaid NMF-identified factors (rows) that specifically localized to the injury area at d2 (factor 1, top row) or d10 (factor 2, middle row). No factor localized to the injury area at d21, instead a factor that follows the pattern of cortical neuronal layering was observed (factor 3, bottom row). Values plotted are spatial autocorrelation values of the factors per spot. B Table of select genes (dark blue) driving each of the factors in (A) and the pathways associated with the genes (light blue). Pathways were obtained by running the genes through EnrichR and adjusted p-values are shown in parentheses. C Visium d2 (top), d10 (middle) and d21 (bottom) sections with overlaid genes from (B) that drive factors 1, 2, and 3 from (A). The value represents the summed SCT normalized expression values corresponding genes from (B). D UMAP plot of all the spots from Visium d2, d10, and d21 sections in a UMAP-reduced dimension. Colors for clusters remain constant through (EG). E Visium d2, d10 and d21 sections overlaid with all clusters from (D) are shown in the top row. Overlay of individual clusters associated with the d2 injury space and d10 injury space are shown in the middle and bottom rows, respectively. Spots bordering these clusters (grey spots in the middle row, navy blue in the bottom row) were isolated for differential gene expression. F, G Heatmaps representing the differential gene expression between the injured clusters in d2 (F) and d10 (G) and their neighboring border spots (colors correspond to spot colors in E). Expression represents SCT normalized expression values where high is bright yellow and low is dark purple. Source data are provided as a Source Data file.
Fig. 3
Fig. 3. Combining the granularity of single cell transcriptomics with spatial information from Visium uncovers the heterogeneity of astrocytes in sub-acute stroke.
A UMAP plot of 13,517 ACSA-2+ cells from injured (6243 cells) and non-injured (7274 cells) cortices. B Violin plots showing the distribution of microglial (Tmem119, P2ry12, Trem2, & Aif1) and astrocytic (Slc1a3, Slc1a2, Gfap, Aldoc, Aldh1l1) genes (rows) across similarity-sorted clusters (columns, sorted by average gene expression) that are derived from the UMAP in (A). Expression (y-axis) values represent SCT-normalized gene expressions. C Visium d10 section with overlaid astrocyte clusters (cells with expression levels of Aif1 and Trem2 less than 0.1). Values in the colourmap represent prediction scores of the clusters on the Visium spots. D UMAP plot of a 5695 ACSA-2+ hi cells from injured (2492 cells) and non-injured (2993 cells) cortices. E Violin plots showing the distribution of microglial (Tmem119, P2ry12, Trem2, & Aif1), astrocytic (Slc1a3, Slc1a2, Gfap, Aldoc, Aldh1l1), and VLMC (Ogn, Lum, & Ptgds) genes (rows) across clusters (columns) that are derived from the UMAP in (D). Expression (y-axis) values represent SCT-normalized gene expressions. Gene markers that are absent compared to (B) is due to the gene not being captured in this dataset. The gene prefix “rna_” indicates that the gene was only found in raw (not normalized) gene counts. F Histogram depicting the number of cells belonging to uninjured versus stroke-injured samples across each cluster from (D). G Astrocytic clusters from (D) overlaid onto the D10 Visium section. Values in colourmap represent prediction scores of the clusters on the Visium spots. H Heatmap of the top 10 genes (rows) enriched in each cluster (columns) highlights substantial gene expression overlap, likely contributing to small distances between UMAP-derived clusters in (D). Expression value represents log-normalized and scaled expression values. I Volcano plot between cluster 3 (inferred proximal) versus 0 (inferred distal). The higher the gene (dot) the lower the p-value. Genes upregulated in proximal astrocytes are shown in dark blue (positive). Genes upregulated in distal astrocytes are shown in light blue (negative). Source data are provided as a Source Data file.
Fig. 4
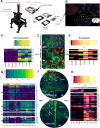
Fig. 4. tDISCO resolves the boundaries and molecular profiles of proximal and distal astrocytes in sub-acute stroke.
A Schematic of the tDISCO system. tDISCO is comprised of an upright microscope equipped with a digital microfluidic (DMF) capable stage (grey, dashed inset), a fiber optic laser input and LED fluorescence capabilities. B Image shows three 2 mm tissue biopsies (i, ii, and iii, in dotted circles) from a cryosectioned tissue slice. Biopsies are mounted onto an tDISCO top-plate, fixed and stained. Cartoon of the biopsies in a brain section is shown on bottom right. Biorender was used to create the schematic. C Representative tDISCO-captured images of cortical brain tissue from which DAPI + NEUN+ neurons (red) and DAPI + GFAP+ astrocytes (green) were selected. Top image shows 20X field of view, scale bar is 100 µm. 100X images show NEUN+ (red dotted circles) and GFAP+ (green dotted circles) cells before (middle image) and after (bottom image) laser lysis. Scale bars are 10 µm. D Heatmap depicts differences in TPM normalized gene expression (columns) between NEUN+ and GFAP+ cells (rows). n = 4 GFAP+ and 4 NEUN+ cells from across 3 animals. E Heatmap depicts differences in LFQ normalized protein expression (columns) between NEUN+ and GFAP+ cells (rows). n = 3 GFAP+ and 3 NEUN+cells from across 3 animals. F Representative image of stroke-injured tissue stained for GFAP (green) from which GFAP+ astrocytes were selected. GFAP+ cells were isolated from three 200 µm “zones” (A through C) that spanned the d10 injury site (top image) and from a more distal zone (zone D, bottom image). Zone boundaries are shown by dotted lines, zone A is red, zone B is orange, zone C is light blue, and zone D is dark blue. The position of each selected astrocyte within the tissue is depicted by numbered circles. All scale bars are 100 µm. cc = corpus collosum, V = ventricle and ML = midline. G Transcriptome heatmap of numbered GFAP+ cells (1-22, bottom) from F (columns) isolated from zones A (red), B (orange), C (light blue) and D (dark blue). Gene expression is TPM normalized. Transcripts are grouped according to their localization in injury zone B (top), in every zone except injury zone B (second down), to distal zones C and D (third down) or lncRNA outside of zone B (fourth down). n = 22 cells from across 3 animals. H Proteome heatmap with numbered GFAP+ cells (23–32, bottom) from F (columns) isolated from zone B (orange) and zone D (dark blue). LFQ normalized intensity of proteins. Proteins are grouped according to expression within zone B (top) or in zone D (bottom). n = 10 cells from across 3 animals. Source data are provided as a Source Data file.
Fig. 5
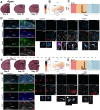
Fig. 5. The expression of Apoe and Clu across platforms and validation with RNAScope.
A Visium d2, d10 and d21 sections show high Apoe gene expression that is specific to the d10 injury site. B UMAP plot of the 10X Chromium scRNA-seq data annotated with cluster 3 (peach, proximal astrocytes) and cluster 0 (navy blue, distal astrocytes) shows Apoe expression is localized to cluster 3 (proximal) astrocytes. C Histogram depicts tDISCO-derived TPM normalized gene expression (y-axis) of Apoe in GFAP+ cells (numbered 1-22, x-axis) from zones A (red), B (orange), C (light blue), and D (dark blue). D Representative images of Apoe and GFAP expression in uninjured (left column) and d10 stroke-injured brains (second from left column).The red dotted line in stroke-injured brains denotes the injured area as defined by GFAP staining. Red boxes show the location of the higher magnification images that correspond to the uninjured brain (i), and proximal (ii)- and distal (iii)- regions in the stroke-injured brain. Images are at 10x, scale bar = 500 µm. Higher magnification images show Apoe and GFAP expression in i) uninjured, (ii) proximal and (iii) distal astrocytes (colocalization is depicted by the pink overlap mask). Images are at 40X, scale bars = 20 µm, n = 3 mice. cc = corpus callosum. E-H Clu expression in Visium (E), 10X Chromium (F), and tDISCO (G) datasets. Representative images of Clu and GFAP expression in uninjured (left column) and d10 stroke injured brains (second from left column), and in i) uninjured, (ii) proximal and (iii) distal GFAP+ astrocytes (colocalization is depicted by pink overlap mask) (H). Images are at 40X, scale bars = 20 µm, n = 3 mice. cc = corpus callosum. Source data are provided as a Source Data file.

References

    1. Palla G., Fischer D. S., Regev A., Theis F. J. Spatial components of molecular tissue biology. 10.1038/s41587-021-01182-1. - PubMed
    1. Escartin C, et al. Reactive astrocyte nomenclature, definitions, and future directions. Nat. Neurosci. 2021;24:312. doi: 10.1038/s41593-020-00783-4. - DOI - PMC - PubMed
    1. Burda JE, Bernstein AM, Sofroniew MV. Astrocyte roles in traumatic brain injury. Exp. Neurol. 2016;275:305–315. doi: 10.1016/j.expneurol.2015.03.020. - DOI - PMC - PubMed
    1. Roome RB, et al. A reproducible Endothelin-1 model of forelimb motor cortex stroke in the mouse. J. Neurosci. Methods. 2014;233:34–44. doi: 10.1016/j.jneumeth.2014.05.014. - DOI - PubMed
    1. Abeysinghe HCS, Bokhari L, Dusting GJ, Roulston CL. Brain Remodelling following Endothelin-1 Induced Stroke in Conscious Rats. PLoS One. 2014;9:e97007. doi: 10.1371/journal.pone.0097007. - DOI - PMC - PubMed