. 2024 Feb 21;15(1):1571.
doi: 10.1038/s41467-024-45989-3.

Cortical astrocyte N-methyl-D-aspartate receptors influence whisker barrel activity and sensory discrimination in mice

Affiliations

Cortical astrocyte N-methyl-D-aspartate receptors influence whisker barrel activity and sensory discrimination in mice

Noushin Ahmadpour et al. Nat Commun. .

Abstract

Astrocytes express ionotropic receptors, including N-methyl-D-aspartate receptors (NMDARs). However, the contribution of NMDARs to astrocyte-neuron interactions, particularly in vivo, has not been elucidated. Here we show that a knockdown approach to selectively reduce NMDARs in mouse cortical astrocytes decreases astrocyte Ca2+ transients evoked by sensory stimulation. Astrocyte NMDAR knockdown also impairs nearby neuronal circuits by elevating spontaneous neuron activity and limiting neuronal recruitment, synchronization, and adaptation during sensory stimulation. Furthermore, this compromises the optimal processing of sensory information since the sensory acuity of the mice is reduced during a whisker-dependent tactile discrimination task. Lastly, we rescue the effects of astrocyte NMDAR knockdown on neurons and improve the tactile acuity of the animal by supplying exogenous ATP. Overall, our findings show that astrocytes can respond to nearby neuronal activity via their NMDAR, and that these receptors are an important component for purinergic signaling that regulate astrocyte-neuron interactions and cortical sensory discrimination in vivo.


Conflict of interest statement

The authors declare no competing interest.

Figures

Fig. 1
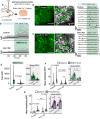
Fig. 1. Astrocyte-specific knockdown of Grin1, the gene for the essential subunit of NMDA receptors.
A Astrocyte-specific AAV9 constructs with three shRNAmir targeting Grin1 for knockdown or three non-silencing shRNAmir for control with membrane-tagged Lck-GCaMP6f. B AAVs were injected into the whisker barrel cortex and tissue was processed later after viral expression. C Lck-GCaMP6f (anti-GFP) from Grin1 KD AAV localized to astrocytes (anti-GFAP) by immunohistochemistry. Scale = 25 µm D Astrocytes (anti-GFAP) and not neurons (anti-NeuN) expressed the viral construct. Scale = 50 µm. E qPCR for Grin1 mRNA abundance from isolated astrocytes showed reduced expression in Grin1 KD. Mean ± SEM compared by Mann–Whitney–Wilcoxon (two-sided) test. n = 10 control, 9 Grin1 KD mice. F NMDA-receptor subunit abundance from RNA-seq in fragments per kilobase per million of mapped reads (FPKM) *P = 0.027, **P = 0.008. G Fold change of differential expression of NMDAR subunits from Grin1 KD vs control. n = 9 control, 7 Grin1 KD mice *P = 0.027, **P = 0.008. H, I Immunocytochemistry of glial cultures transduced with AAV constructs (control and Grin1 KD) and stained for GFAP, GFP (Lck-GCaMP6f), and GLUN1 (the protein of Grin1). GFP was used to make a mask for GLUN1 quantification (white outline). Scale bar = 20 μm. J The corrected total cell fluorescence (CTCF) for GLUN1 in control and Grin1 KD cultured astrocytes. n = 33 control cells from 3 cultures; 30 Grin1 KD cells from 3 cultures. K, L Immunohistochemistry of cortical astrocytes transduced with AAV constructs (control and Grin1 KD) and stained for GFAP, GFP (Lck-GCaMP6f), and GLUN1. GFAP was used to make a mask for GLUN1 quantification (white outline). These mice also had Grin1fl/fl genes and hSYN-Cre AAV virus injection to deplete GLUN1 in Cre-positive neurons. Scale bar = 15 μm. M The corrected total cell fluorescence (CTCF) for GLUN1 in control and Grin1 KD astrocytes in tissue depleted of neuronal GLUN1. n = 41 control cells from 3 mice; 46 Grin1 KD cells from 3 mice. All bars are mean ± SEM. Statistics for immunostaining were calculated using linear mixed models and Tukey post hoc tests. Source data are provided as a Source Data file.
Fig. 2
Fig. 2. A functional reduction of astrocyte Ca2+ responses to NMDAR agonists after Grin1 KD.
A Experimental schematic for Grin1 KD or control virus injections and brain slices. B, C Green fluorescent representative brain slice images of astrocytes transduced with control or Grin1 KD virus (Lck-GCaMP6f; Scale = 50 µm). Regions of interest (ROIs) with active Ca2+ events when NMDA (50 µM) + D-serine (10 µM) were applied in the presence of neuronal blockers are indicated as white and green shapes. Example Ca2+ traces from 10 ROIs highlighted in green in the middle image are shown. Green shaded area indicates when the NMDA agonists were applied. D Individual ROI Ca2+ traces (gray) from all brain slices with the mean Ca2+ response (black) to agonist application (green) in the presence of neuronal blockers (blue) from control and Grin1 KD slices. E Area under the curve (AUC) of Ca2+ traces from ROIs during NMDA + D-serine application. Violin plot width shows the frequency of data points in each region and the height shows the distribution of all ROIs. The mean and SEM error bars are also indicated. The bar graph is the average AUC per slice (dots). *P = 0.046. F Amplitude of Ca2+ peaks per ROI during NMDA + D-serine for all ROIs (violin plot) and average per slice (bar graph and dots). **P = 0.007. Control: n = 197 ROIs from 7 slices from 7 mice, Grin1 KD: n = 220 ROIs from 8 slices from 8 mice. G Amplitude of Ca2+ peaks per ROI during phenylephrine (10 µM) across all ROIs (violin plot) and averaged per slice (dots and bar graph). Control: n = 47 ROIs from 6 mice **P = 0.013, Grin1 KD: n = 87 ROIs from 5 mice **P = 0.016. All data are mean ± SEM. Statistics for violin plots were calculated using linear mixed models and Tukey post hoc tests. Stats for bar graphs were calculated using Kruskal–Wallis tests and pairwise Wilcoxon tests (two-sided) with Bonferroni correction. Source data are provided as a Source Data file.
Fig. 3
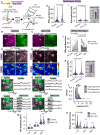
Fig. 3. Reduction of stimulation-evoked Ca2+ events in Grin1 KD astrocytes in vivo.
A Awake Ca2+ imaging of Grin1 KD or control astrocytes after AAV injection. B Example whisker barrel map through the cranial window during intrinsic optical imaging. Virus expression was localized within this area. C, D Example Lck-GCaMP6f (green) and SR101 (magenta) in L2/3 cortical astrocytes in vivo. Endfeet (yellow arrow) and somata (white arrow) were identified (Scale bar = 25 μm). E, F Single trial maps and multiple trial maps (4) of identified active astrocyte Ca2+ microdomains from trials with or without whisker stimulation (90 Hz, 8 s). The rainbow scale is the fraction of trials with a response. G Number of astrocyte microdomain ROIs with Ca2+ events per whisker barrel area was reduced in Grin1 KD during stimulation. Each gray line is a FOV; the mean ± SEM is indicated in color. H The mean astrocyte ROI Ca2+ amplitude was reduced in Grin1 KD during stimulation. Violin plots show the distribution of all ROIs with the mean and SEM error bars. The bar graph is the mean ± SEM for all ROIs in the violin plots ***P = 0.006. I The fraction of active astrocyte pixels per FOV was reduced during stimulation in Grin1 KD mice. J The fraction of astrocyte pixels active in two or more trials (repeated response score) increased with whisker stimulation in control but not Grin1 KD mice. Control: n = 1127 ROIs from 103 FOV in 8 mice, Grin1 KD: n = 448 ROIs from 97 FOV in 11 mice. K, L Example traces from no stim and whisker stimulation trials (gray shaded area) for subcellular compartments (S = somata, E = endfeet, and P = processes) with calcium events from cells in (E) & (F). More regions had peaks during the stimulation time in control astrocytes (Scale bar = 25 μm). M The number of astrocyte somata, endfeet, or process ROIs with Ca2+ events per whisker barrel area during whisker stimulation. Control: n = 24 FOV from 8 mice and KD: n = 25 FOV from 7 mice. Comparisons made by linear mixed models and Tukey post hoc tests. Source data are provided as a Source Data file.
Fig. 4
Fig. 4. Altered neuronal activity after astrocyte Grin1 KD in vivo.
A Awake neuronal Ca2+ imaging near Grin1 KD or control astrocytes. B, C Example RCaMP1.07 neurons (magenta) and Lck-GCaMP6f astrocytes (green) in L2/3 in vivo (Scale bar = 25 μm). D, E Single trial and multiple trial Ca2+ maps (4) of active neuronal ROIs near Grin1 KD vs. control astrocytes with or without whisker stimulation (90 Hz, 8 s). The color scale is the fraction of trials with a response in that area. F, G Traces from example neuron ROIs from (D) & (E) (Scale bar = 25 μm). H The number of spontaneous neuronal ROIs per barrel area increased in Grin1 KD mice. I ROI Ca2+ amplitude in spontaneous neurons increased in Grin1 KD mice. ***P = 0.0006. J Whisker stimulation failed to increase the number of active neuron ROIs per barrel area in Grin1 KD. Each gray line is a FOV; the mean ± SEM is indicated in color. K ROI Ca2+ amplitude was elevated during stimulation in Grin1 KD. Control: n = 1799 ROIs from 122 FOV in 8 mice, Grin1 KD: 1210 ROIs from 144 FOV in 11 mice *P = 0.0127. L Classification of neuron types: high-responding, mid-responding, and low-responding neurons based on amplitude percentiles, 88th (1.92 dF/F) and 98th (3.47 dF/F). M ROI Ca2+ amplitudes for each class of neuron. N Number of each neuronal type per barrel area during whisker stimulation. There were fewer low-amplitude neurons in Grin1 KD. High-responsive: n = 35 ROIs from 20 FOV (Control), 37 ROIs from 19 FOV (KD); Mid-responsive: n = 158 ROIs from 58 FOV (Control), 164 ROIs from 69 FOV (KD), Low-responsive: n = 1606 ROIs from 121 FOV (Control), 1009 ROIs from 141 FOV (KD); Mice: Control = 8, Grin1 KD = 11. Violin plots show the distribution of all ROIs or all FOVs with the mean and SEM error bars plotted on top. Bar graphs are the mean ± SEM for all ROIs in the violin plots. Comparisons made by linear mixed models and Tukey post hoc tests. Source data are provided as a Source Data file.
Fig. 5
Fig. 5. Alterations in neuronal synchronization and adaptation after astrocyte Grin1 KD.
A Neuronal synchronization was determined by Pearson’s correlation between pairs of neurons from the same field of view that were spontaneous or stimulation-activated (i.e., Ca2+ event during the stimulus period (8 s)) and that had a significant p-value during the correlation analysis. Neuronal synchrony increased with stimulation in control but not in Grin1 KD. Purple area is the mean ± SEM for all responding ROI pairs. Control: n = 4658 no stim and 16665 stim comparisons from 8 mice; Grin1 KD: n = 12825 no stim and 8436 stim comparisons from 12 mice ***P < 0.001. B Neuronal correlation showed that high-responsive neurons were less synchronized in Grin1 KD during whisker stimulation (Control, No Stim: n = 1175 comparisons from 15 ROIs, Stim 90 Hz: n = 222 comparisons from 31 ROIs, 8 mice). (Grin1 KD, No Stim: n = 3266 comparisons from 62 ROIs, Stim 90 Hz: n = 367 comparisons from 36 ROIs, 12 mice). C Prolonged electrical stimulation of the whisker pad (750 µA, 4 Hz for 30 s) resulted in robust neuronal Ca2+ events that quickly adapted (black arrows) for the duration of the stimulus. D The slope of the Ca2+ event decay was calculated from time 0.5–1 s after the start of the stimulus. The adaptation was slower in Grin1 KD mice. Control: n = 714 ROIs from 9 mice; Grin1 KD: n = 629 ROIs from 8 mice. Data represented as mean ± SEM ***P < 0.001. All statistics were calculated using linear mixed model and Tukey post hoc tests. Source data are provided as a Source Data file.
Fig. 6
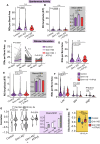
Fig. 6. Rapid and delayed-onset astrocyte Ca2+ microdomains are reduced in Grin1 KD.
A Onset latency is the earliest time point after the start of whisker stimulation at which the Ca2+ signal [dF/F] reached 2.5 SD of the baseline. X-axis = time (s). B The onset latency was not different between neurons in control and Grin1 KD neurons. Control: n = 1799 ROIs, 8 mice, Grin1 KD: n = 1210 ROIs, 11 mice. C Astrocyte Ca2+ microdomains (MDs) were classified as fast or delayed onset relative to the neuronal onset times. The number of fast-onset and delayed-onset MDs were reduced in Grin1 KD. Gray area is the mean ± SEM for all fields of view (FOV). Control, Delayed MDs: n = 796 ROIs from 103 FOV & Fast MDs: n = 331 ROIs from 76 FOV, from 8 mice; Grin1 KD, Delayed MDs: n = 240 ROIs from 78 FOV & Fast MDs: n = 193 ROIs from 56 FOV, from 11 mice. Data are represented as mean ± SEM. All statistics were calculated using linear mixed model and Tukey post hoc tests. *P < 0.05, ***P < 0.001. Source data are provided as a Source Data file.
Fig. 7
Fig. 7. Sensory discrimination of the animal was reduced after astrocyte Grin1 KD.
A Schematic of whisker-mediated novel texture recognition and novel object recognition tests. The ability of mice to discriminate between different grits of sandpaper or two distinct objects is reported as discrimination index (difference in novel – familiar texture exploration time/total exploration time) B The discrimination index for small grit difference (ΔG = 32 µm; 150 grit vs. 220 grit; Control mice n = 6, Grin1 KD mice n = 6), large grit difference (ΔG = 200 µm; 60 grit vs. 220 grit; Control mice n = 9, Grin1 KD mice n = 9) and the novel object recognition test(Control mice n = 5, Grin1 KD mice n = 5). Data is mean ± SEM and dots are individual animals. Comparisons were made with the Mann–Whitney–Wilcoxon test (two-sided). Source data are provided as a Source Data file.
Fig. 8
Fig. 8. ATPγS application on the cortex rescues the neuronal and behavioral effects of astrocyte Grin1 KD in vivo.
A ATPγS increased the number of spontaneous neuronal ROIs per barrel area in Grin1 KD mice. B ATPγS reduced the Ca2+ amplitude in spontaneous neurons in Grin1 KD mice. Gray area is the mean ± SEM for all ROIs ***P = 0.0006. C ATPγS increased the number of neuronal ROIs per barrel area responding to whisker stimulation compared to trials without stimulation in Grin1 KD. Each gray line is a FOV; the mean ± SEM is indicated in color. D The number of responding neurons during whisker stimulation in the ATPγS treated group was not different than controls. E ATPγS reduced the Ca2+ amplitude of Grin1 KD neurons during stimulation. Gray area is the mean ± SEM for all ROIs *P = 0.0127. F ATPγS treatment in Grin1 KD mice caused a redistribution of the neuronal population responding to whisker stimulation: The number of low-responsive neurons increased during whisker stimulation to a number similar to controls, while the number of mid-responsive and high-responsive neurons decreased. For Fig. 8 A–F, N = 54 FOVs from 10 mice in the ATPγS group; other groups from Fig. 4. G The correlation of Grin1 KD neurons improved with ATPγS, where the correlation between neurons in the same field of view was elevated, particularly during whisker stimulation. Grin1 KD + ATPγS n = 1555 no stim and 3661 stim comparisons from 10 mice. H The texture discrimination and sensory acuity of Grin1 KD mice during the novel texture recognition test was improved by ATPγS. Control mice n = 6, Grin1 KD mice n = 6, Grin1 KD + ATPγS mice = 9. Violin plots show the distribution of all ROIs or all FOVs with the mean and SEM error bars plotted on top. All statistics were calculated using linear mixed model and Tukey post hoc tests. ***P < 0.001. Source data are provided as a Source Data file.
Fig. 9
Fig. 9. Summary diagram of cortical alterations after astrocyte NMDA-receptor knockdown.
Under physiological conditions, astrocyte NMDA receptors (aNMDAR) may trigger purinergic release necessary for the balance of cortical excitation and inhibition that optimizes the acuity of sensory discrimination (as seen in a whisker-mediated discrimination task). Upon knockdown of Grin1, encoding NMDA-receptor subunit GLUN1, astrocyte Ca2+ signaling is reduced and may disrupt purinergic release. This elevates neuronal excitability at rest, while decreasing neuronal recruitment, synchronization, and adaptation during sensory stimulation. This loss of purinergic signaling also impairs the sensory perception of the animal. Supplying exogenous ATP is enough to rescue these knockdown-induced impairments (Fig. 8).

Similar articles

Cited by

References

    1. Adamsky A, et al. Astrocytic activation generates de novo neuronal potentiation and memory enhancement. Cell. 2018;174:59–71.e14. doi: 10.1016/j.cell.2018.05.002. - DOI - PubMed
    1. Yu X, et al. Reducing astrocyte calcium signaling in vivo alters striatal microcircuits and causes repetitive behavior. Neuron. 2018;99:1170–1187. doi: 10.1016/j.neuron.2018.08.015. - DOI - PMC - PubMed
    1. Kwak H, et al. Astrocytes control sensory acuity via tonic inhibition in the thalamus. Neuron. 2020;108:691–706.e10. doi: 10.1016/j.neuron.2020.08.013. - DOI - PubMed
    1. Nagai, J. et al. Specific and behaviorally consequential astrocyte Gq GPCR signaling attenuation in vivo with iβARK. Neuron109, 2256–2274.e9 (2021). - PMC - PubMed
    1. Araque A, et al. Gliotransmitters travel in time and space. Neuron. 2014;81:728–739. doi: 10.1016/j.neuron.2014.02.007. - DOI - PMC - PubMed

Substances

LinkOut - more resources