. 2024 Feb 21;15(1):1568.
doi: 10.1038/s41467-024-45693-2.

Meiotic protein SYCP2 confers resistance to DNA-damaging agents through R-loop-mediated DNA repair

Affiliations

Meiotic protein SYCP2 confers resistance to DNA-damaging agents through R-loop-mediated DNA repair

Yumin Wang et al. Nat Commun. .

Erratum in

Abstract

Drugs targeting the DNA damage response (DDR) are widely used in cancer therapy, but resistance to these drugs remains a major clinical challenge. Here, we show that SYCP2, a meiotic protein in the synaptonemal complex, is aberrantly and commonly expressed in breast and ovarian cancers and associated with broad resistance to DDR drugs. Mechanistically, SYCP2 enhances the repair of DNA double-strand breaks (DSBs) through transcription-coupled homologous recombination (TC-HR). SYCP2 promotes R-loop formation at DSBs and facilitates RAD51 recruitment independently of BRCA1. SYCP2 loss impairs RAD51 localization, reduces TC-HR, and renders tumors sensitive to PARP and topoisomerase I (TOP1) inhibitors. Furthermore, our studies of two clinical cohorts find that SYCP2 overexpression correlates with breast cancer resistance to antibody-conjugated TOP1 inhibitor and ovarian cancer resistance to platinum treatment. Collectively, our data suggest that SYCP2 confers cancer cell resistance to DNA-damaging agents by stimulating R-loop-mediated DSB repair, offering opportunities to improve DDR therapy.


Conflict of interest statement

The authors declare no competing interests.

Figures
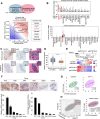
Fig. 1
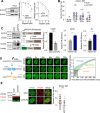
Fig. 1. SYCP2 expression in cancer associates with resistance to drugs targeting DDR pathways.
A Common hits of genes which are highly expressed in cancer and their high expression correlates with DDR drugs’ resistance. The X-axis indicates the median value expression of the correlated genes in breast cancer over normal. The Y-axis indicates the mean correlation r-value between IC50 to DDR drugs [Olaparib, a PARPi; CPT11, a TOP1i, Cisplatin, a crosslinking agent]. The comparison for the analysis is one-sided. r-values > 0.4 with significant p values by Pearson correlated analysis were used. B Upregulation of expression of SYCP2 in indicated types of tumors from CCLE and TCGA database, respectively. TPM was used for the normalization of gene expression. For box-plot, the minimum to maximum are shown with all data points labeled. C IHC of SYCP2, Ki67, and H&E staining in breast cancer and adjacent normal breast tissues (MGH patient #20006). Enlarged images are shown in upper right. D Expression of SYCP2 in breast cancer compared to normal breast tissues in TCGA database. For box-plot, the minimum to maximum are shown with all data points labeled. E Upper panel: Scheme of two loci (cg22214414 and cg07347645) of SYCP2 intron 1. The heatmap showed high SYCP2 expression correlates with low methylation at loci cg22214414 and cg07347645. The data was collected from TCGA (n = 309 samples). F The representative images of IHC staining of SYCP2 in breast cancer and para cancer tissues from breast cancer patients were shown on the top. The relative RNA expression levels and relative protein levels from tissues were quantified by qRT-PCR and IHC, respectively. SYCP2 mRNA from qRT-PCR were normalized to GAPDH (n = 3 experiments, Mean +/− SEM); the percentage of positive IHC staining of SYCP2 in tumor tissues were quantified. G The two-dimensional (2D) plot of correlation between SYCP2 expression and IC50 of Cisplatin and CPT11 in breast cancer cell lines. R-values are 0.51 and 0.41, respectively. H 3D and 2D plot of correlation between SYCP2 expression and IC50 of Olaparib, Rucaparib, and Telozoparib. R-values are 0.63, 0.51, and 0.40, respectively. Source data are provided as a Source Data file.
Fig. 2
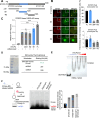
Fig. 2. SYCP2 is involved in DDR and is required for cell survival.
A Cell survival rate of HeLa cells with Olaparib and Cisplatin at the indicated dose via colony-forming assay. Three independent experiments were done (n = 3 experiments, Mean +/− SEM.). WB of siControl (siCtrl) and siSYCP2 in HeLa was shown. (p = 0.0245). B Quantification of ionizing radiation-induced foci (IRIF) of γH2AX after 2 Gy IR at indicated hours (hr) of recovery time (n = 200 cells, Mean +/− SEM) in HeLa cells. C WBs of SYCP2 KD and OE in U2OS cells was shown. Relative HR frequency in siCtrl or siSYCP2 (left), empty vector or SYCP2 overexpression (OE) in U2OS cells (middle), empty vector or SYCP2 OE in BJ cells (right) in the DR-GFP reporter assay were quantified. Three independent experiments were done (n = 3 experiments, Mean +/− SEM). (p < 0.0001, p = 0.003, p = 0.0160). D Kinetics and representative images of GFP-NBS1, -RPA, and -SYCP2 recruitment in U2OS cells from 0-300 seconds (s) after laser microirradiation. The fold increase of mean intensity (sites of irradiation/nucleus background) was quantified (n = 10 cells, Mean +/−SEM). Scale Bar = 10 μm. E The numbers of RAD51 IRIF in siCtrl and siSYCP2 treated U2OS cells 1 h after 2 Gy IR were quantified (n = 200 cells, Mean +/− SEM). WB of SYCP2 and RAD51 and the representative images of RAD51 and γH2AX IRIF were shown on the left. Scale Bar = 10 μm Statistical analysis was done with the unpaired two-tailed Student-t-test, ****p < 0.0001. Source data are provided as a Source Data file.
Fig. 3
Fig. 3. SYCP2 plays an essential role in transcription-coupled homologous recombination (TC-HR).
A Scheme of tet-DR-GFP HR reporter for measuring TC-HR efficiency was shown on top. Relative HR frequency was measured when the transcription is on or off by qRT-PCR in siCtrl or siSYCP2 treated cells. Mean frequency of the HR (qPCR) compared to the siCtrl group at transcription off is shown. Three independent experiments were done (n = 3 experiments, Mean +/− SEM). (p = 0.0002). B Scheme of damage induction via KillerRed (KR) at transcribed or non-transcribed region of the genome in the DART assay (left). U2OS-TRE cells were transfected with GFP-SYCP2 and TA-KR/tetRKR/TA-cherry/tetR-cherry. For light activation of KR in all below experiments in the DART assay, cells were light-activated for 20 min and recovered for 30 min. γH2AX foci were stained and are positive at sites of KR but not cherry. SYCP2 is preferentially recruited to sites of TA-KR. Representative images and quantification of recruitment of SYCP2 at the indicated site were shown. Mean intensity of SYCP2 at TA-KR /mean intensity of background was shown (n = 10 cells, Mean +/− SEM). Experiments were repeated 3 times. C SYCP2 foci frequency at I-SCEI endonuclease-induced damage sites marked by TA-Cherry in U2OS-TRE cells treated 24 h with or without I-SCEI transfection. Three independent experiments were done (n = 3 experiments, Mean +/− SEM). D U2OS-TRE cells transfected with TA-KR and siCtrl/siSYCP2 were light-activated, recovered for 30 min, fixed, and stained with anti-RAD51. Fold increase of RAD51 foci at sites of KR compared to background was quantified (n = 25 cells for siCtrl and n = 16 cells for siSYCP2, Mean +/− SEM). Experiments were repeated 3 times. E U2OS-TRE cells transfected with TA-KR and siCtrl/siSYCP2 with or without light-activation were recovered at 4 h and 24 h, then fixed and stained with anti-S9.6. Frequency of S9.6 foci positive cells at TA-KR was counted. Three experiments were done (n = 3 experiments, Mean +/− SEM), 100–200 individual cells were quantified per group. Statistical analysis was done with the unpaired two-tailed Student-t-test, ****p < 0.0001. Scale Bar = 10 μm. Source data are provided as a Source Data file.
Fig. 4
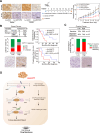
Fig. 4. SYCP2-M1 domain facilitates R-loop formation.
A Scheme of SYCP2 deletion and truncation constructs ∆M1, M1, and M2. B U2OS-TRE cells transfected with TA-KR and SYCP2-full length (FL), M1, ∆M1, and M2 were light-activated and recovered for 30 min. Frequency of SYCP2 foci positive cells at TA-KR (n = 3 experiments, Mean +/− SEM) and Fold increase of SYCP2 foci at sites of KR compared to background was quantified (n = 20 cells, Mean +/− SEM). The represented images of the protein recruitments at TA-KR foci were shown. C Relative HR frequency using CRISPR-based LMNA reporter assay in U2OS cells with or without indicated fragments of SYCP2 overexpression (n = 3 experiments, Mean +/− SEM). D 80 ng purified M1 protein was loaded for the SDS-PAGE analysis followed by Coomassie staining. Summary of the binding Kd value of 10 nM labeled SYCP2-M1 protein with 0.5 µM nucleic acid substrates measured with Microscale thermophoresis (MST). E The binding of purified SYCP2-M1 protein (at 5.3, 8.9,12.4 µM) with 0.1 µM DNA-RNA hybrids was analyzed in EMSA. The experiments were repeated three times with similar results. F Scheme of In Vitro R-loop formation assay is shown on left. 2.6 µM labeled ssRNA and 30 nM pBSK+ plasmid was incubated with or without 0.15 µM Purified SYCP2-M1 protein or 0.15 µM Rad51AP1 for 20 min, and the formation of R-loops was analyzed with 1% TAE agarose gel. The relative intensity of the band intensity in each group compared to empty control was measured. Statistical analysis was done with the unpaired two-tailed Student-t-test, ****p < 0.0001. Scale Bar = 10 μm. Source data are provided as a Source Data file.
Fig. 5
Fig. 5. Lysine(K)/Arginine(R) motif in the SYCP2 M1 domain is required for R-loop stabilization and TC-HR.
A Schematic of SYCP2 mutants by replacing Lysine(K)/Arginine(R) with Alanine(A) in the M1 domain of SYCP2. B Relative HR frequency using CRISPR-based LMNA reporter assay with overexpression of indicated SYCP2 and SYCP2 mutants (n = 3 experiments, Mean +/− SEM). (p = 0.0177). C Schematic and WB of siSYCP2 and siSYCP2#2 were shown. The experiments were repeated three times with similar results. D Fold increase of intensity of SYCP2 (Left) or RAD51 (right) at TA-KR sites in siSYCP2#2 pretreated U2OS cells with or without expression of SYCP2 or its mutant as indicated (n = 6 cells and n = 11 cells, Mean +/− SEM). EG The numbers of SYCP2 and RAD51 IRIF (n = 200 cells, +/− SEM) (E); relative HR frequency in CRISPR-based LMNA HR assay (F) (n = 3 experiments, Mean +/− SEM), and relative TC-HR frequency (G) (n = 3 experiments, Mean +/− SEM) in indicated cells were shown. Mean frequency of the HR (FACs) compared to the siSYCP2 is shown. (p = 0.0001, p = 0.0002). H siSYCP2#2 pretreated U2OS-TRE cells transfected with TA-KR were light-activated and recovered at 4 hr and stained with anti-S9.6. The frequency of positively stained S9.6 foci at TA-KR was quantified (n = 3 experiments, Mean +/− SEM). Mean frequency of quantity of the positive staining of S9.6 at TA-KR is shown. Statistical analysis was done with the unpaired two-tailed Student-t-test, ****p < 0.0001. Source data are provided as a Source Data file.
Fig. 6
Fig. 6. SYCP2 promotes TC-HR independently of BRCA1.
A Plot of correlation between SYCP2 expression and IC50 of Olaparib, Cisplatin, and CPT11 in groups of BRCA WT vs. mutant cells (left), high BRCA1 vs. low BRCA1 (right). B siBRCA1 or siCtrl pretreated U2OSTRE cells transfected with GFP-SYCP2 and TA-KR were light-activated and recovered for 30 min. The frequency of foci-positive cells was quantified (n = 3 experiments, Mean +/− SEM). Fold increase of SYCP2 at TA-KR sites was quantified (n = 10 cells, Mean +/− SEM). C Comparison of SYCP2 RNA expression from CCLE database in BRCA1/2 mutant or proficient breast cancer cell lines (n = 6 samples, n = 65 samples, n = 15 samples, n = 59 samples). The analysis was normalized to Fragments Per Kilobase Million (FPKM). D IRIF of RAD51 1 hr after 2 Gy IR with or without siSYCP2 were quantified in HCC1954 and HCC1937 cells (n = 200 cells, Mean +/− SEM). Mean quantity of IRIF foci per cell is shown. WB of SYCP2, BRCA2, BRCA1 and RAD51 in HCC1937 and HCC1954 in siCtrl or siSYCP2 treated cells was shown. E IRIF of RAD51 1 hr after 2 Gy IR in HCC1954 and HCC1937 cells with empty vector or SYCP2 OE were quantified (n = 200 cells, Mean +/− SEM). Mean quantity of IRIF foci per cell is shown. F Cell survival rate of HeLa cells with siCtrl, siBRCA1, siSYCP2, or siBRCA1+siSYCP2 via colony-forming assay with the treatment of CPT11 at indicated dose (n = 3 experiments, Mean +/− SEM). (p = 0.0026, p = 0.0383, p = 0.0011) Statistical analysis was done with the unpaired two-tailed Student-t-test, ****p < 0.0001. Scale Bar = 10 μm. Source data are provided as a Source Data file.
Fig. 7
Fig. 7. SYCP2 is a predictive biomarker for drug response in patients.
A MD-MBA-231 cells infected with lentiviruses (LV) expressing siSYCP2 or siCtrl were injected intraperitoneally into mice. Mice were given Saline and 50 mg/kg Olaparib. The representative images of IHC staining of SYCP2 of tumor tissues in the tested mice groups were shown (left). Tumor volume was measured over 23 days (right). (p = 0.0005). Created with BioRender.com. B Summarization of subtypes of breast cancer patients in a TOP1i [Sacituzumab Govitecan (IMMU-132)]-treated group. Patients were divided into the SYCP2high group and the SYCP2low group. The cutoff 12 value is the median. Representative images of IHC staining of SYCP2 were shown in each group. Numbers of patients’ responses as Partial Response (PR) or Stable Disease (SD) in the SYCP2high group and SYCP2low group were shown, Kaplan-Meier curves of patients’ overall survival and progression-free survival were shown on the right. The analysis was done in one-sided comparison. C Summarization of retrospective study in SYCP2 expression in ovarian cancer patients. Patients were divided into the SYCP2high group and the SYCP2low group based on the SYCP2 staining results. Representative images of IHC staining of SYCP2 were shown in each group. Numbers of patients’ responses to Platinum Sensitive or Platinum-Resistant/Refractory tumor in the SYCP2high group and SYCP2low group were shown. D The scheme of the role of SYCP2 in contributing to HR and drug resistance in cancer. Source data are provided as a Source Data file.

Similar articles

Cited by

References

    1. Bookman MA. Standard treatment in advanced ovarian cancer in 2005: the state of the art. Int. J. Gynecol. Cancer. 2005;15:212–220. doi: 10.1111/j.1525-1438.2005.00444.x. - DOI - PubMed
    1. Sekine M, Enomoto T. Precision medicine for hereditary tumors in gynecologic malignancies. J. Obstet Gynaecol. Res. 2021;47:2597–2606. doi: 10.1111/jog.14861. - DOI - PubMed
    1. Gokduman K. Strategies Targeting DNA Topoisomerase I in Cancer Chemotherapy: Camptothecins, Nanocarriers for Camptothecins, Organic Non-Camptothecin Compounds and Metal Complexes. Curr. Drug Targets. 2016;17:1928–1939. doi: 10.2174/1389450117666160502151707. - DOI - PubMed
    1. Pommier Y, Nussenzweig A, Takeda S, Austin C. Human topoisomerases and their roles in genome stability and organization. Nat. Rev. Mol. Cell Biol. 2022;23:407–427. doi: 10.1038/s41580-022-00452-3. - DOI - PMC - PubMed
    1. Khanna KK, Jackson SP. DNA double-strand breaks: signaling, repair and the cancer connection. Nat. Genet. 2001;27:247–254. doi: 10.1038/85798. - DOI - PubMed