. 2024 Feb 21;15(1):1597.
doi: 10.1038/s41467-024-45568-6.

Intestinal IL-22RA1 signaling regulates intrinsic and systemic lipid and glucose metabolism to alleviate obesity-associated disorders

Affiliations

Intestinal IL-22RA1 signaling regulates intrinsic and systemic lipid and glucose metabolism to alleviate obesity-associated disorders

Stephen J Gaudino et al. Nat Commun. .

Abstract

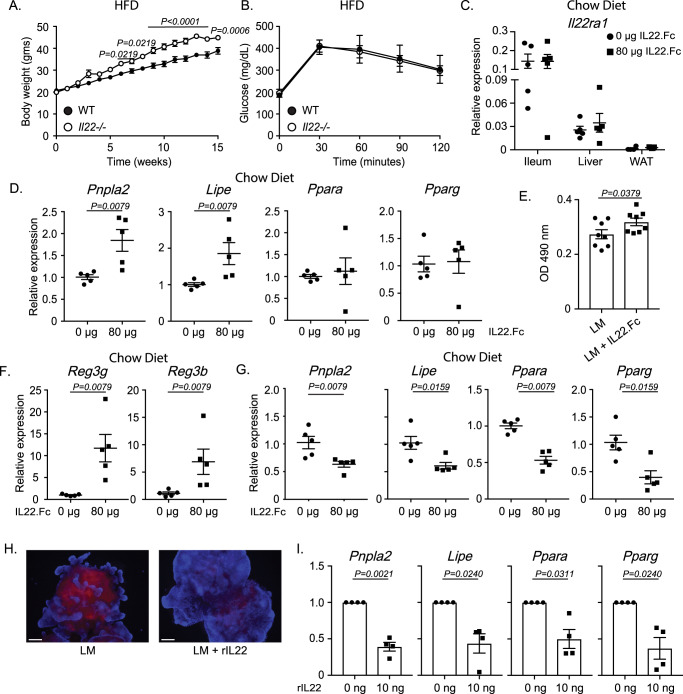
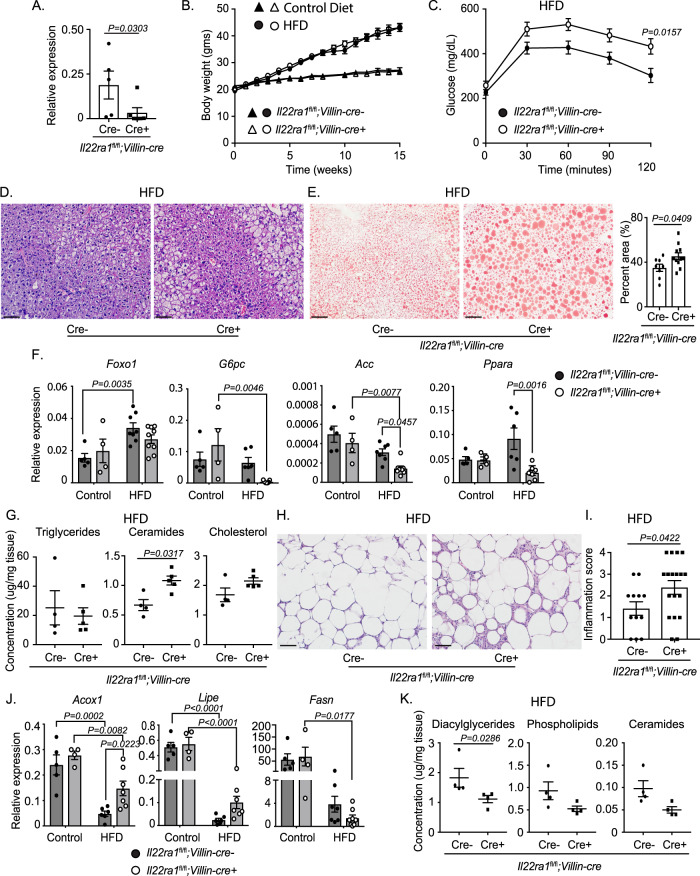
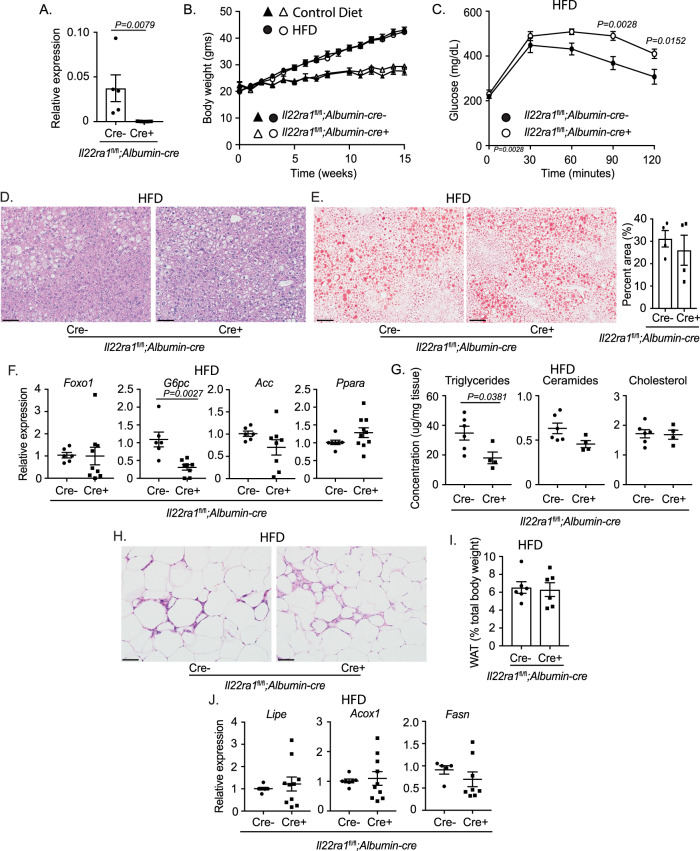
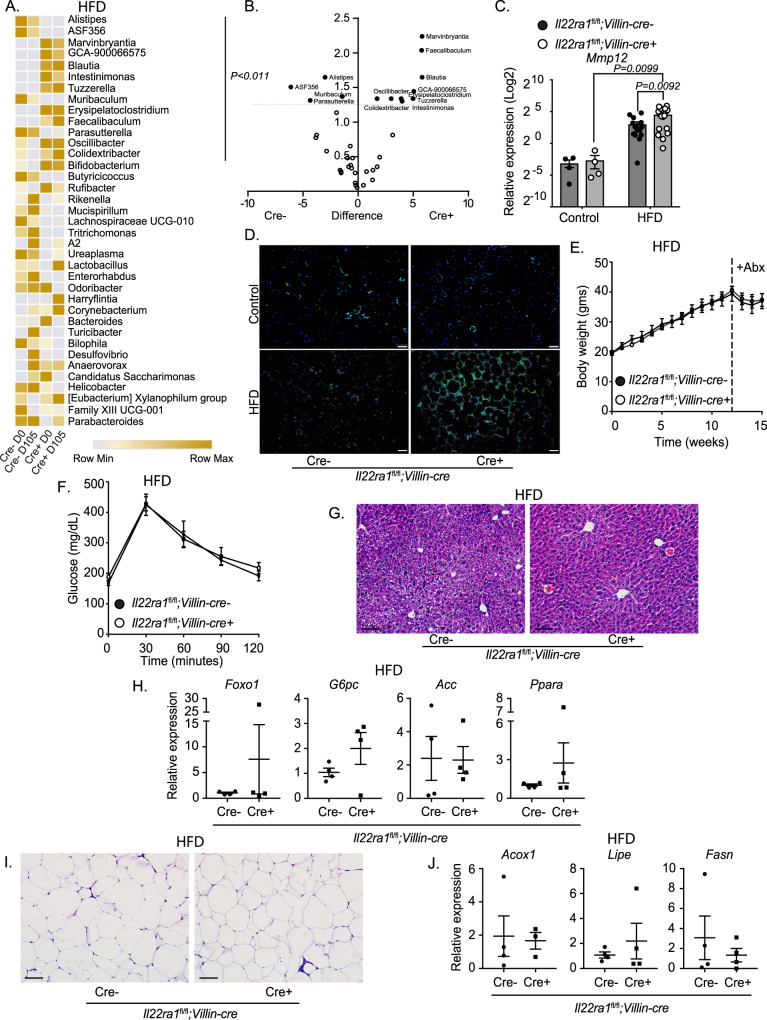
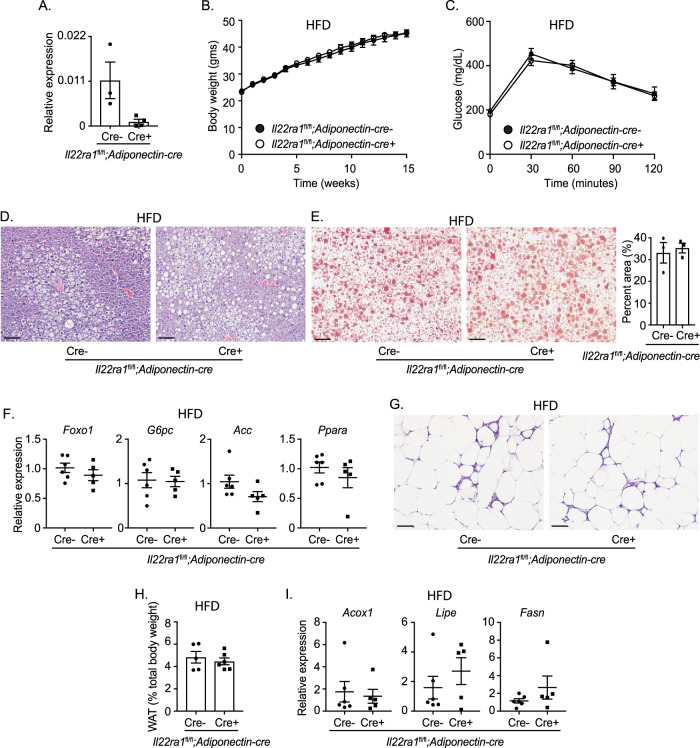
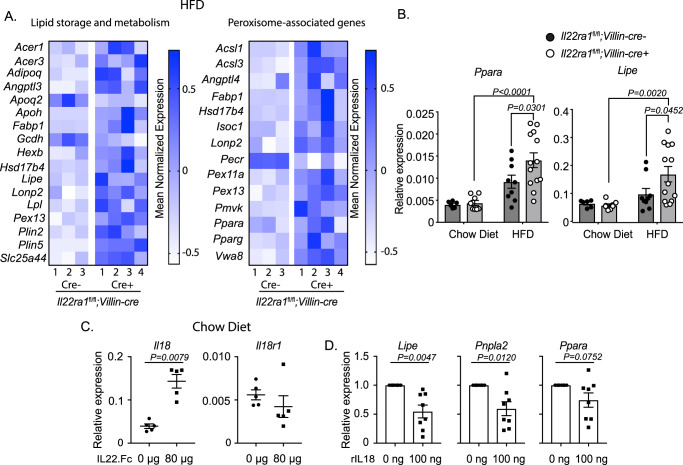
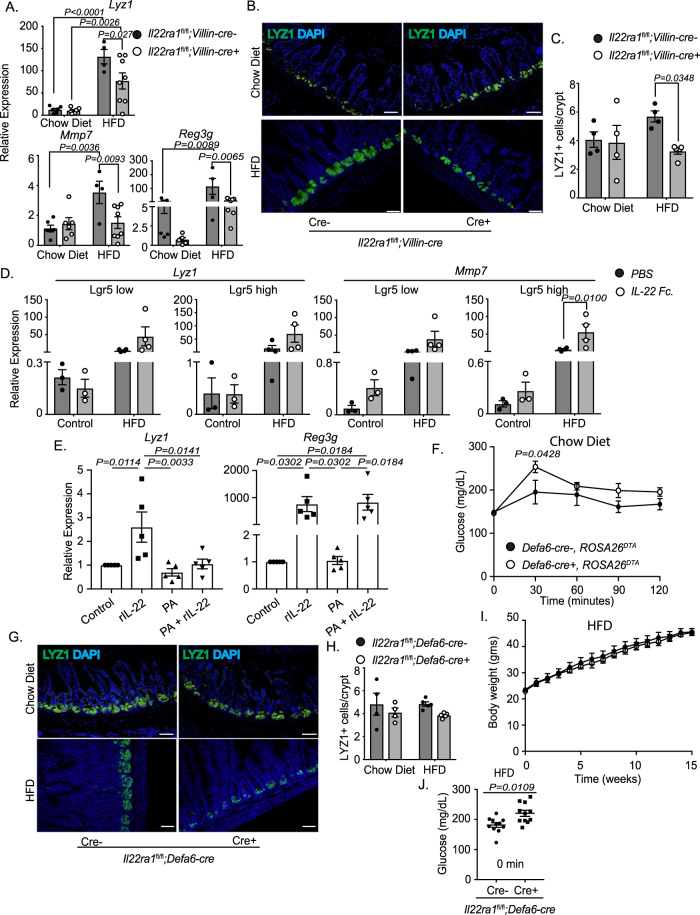
IL-22 is critical for ameliorating obesity-induced metabolic disorders. However, it is unknown where IL-22 acts to mediate these outcomes. Here we examine the importance of tissue-specific IL-22RA1 signaling in mediating long-term high fat diet (HFD) driven metabolic disorders. To do so, we generated intestinal epithelium-, liver-, and white adipose tissue (WAT)-specific Il22ra1 knockout and littermate control mice. Intestinal epithelium- and liver-specific IL-22RA1 signaling upregulated systemic glucose metabolism. Intestinal IL-22RA1 signaling also mediated liver and WAT metabolism in a microbiota-dependent manner. We identified an association between Oscillibacter and elevated WAT inflammation, likely induced by Mmp12 expressing macrophages. Mechanistically, transcription of intestinal lipid metabolism genes is regulated by IL-22 and potentially IL-22-induced IL-18. Lastly, we show that Paneth cell-specific IL-22RA1 signaling, in part, mediates systemic glucose metabolism after HFD. Overall, these results elucidate a key role of intestinal epithelium-specific IL-22RA1 signaling in regulating intestinal metabolism and alleviating systemic obesity-associated disorders.


Conflict of interest statement

The authors declare no competing interests.

Figures

Fig. 1
Fig. 1. IL-22 differentially regulates systemic lipid metabolism.
A Weight gain from a high-fat diet (HFD) fed wildtype (WT) and Il22−/− mice. B Glucose tolerance test (GTT) from HFD-fed Il22−/− mice. C RT-PCR analysis of Il22ra1 expression from wildtype mice injected with either 0 or 80 μg IL-22.Fc. D Expression of lipid metabolism genes from liver tissues of wildtype mice fed a chow diet and treated with or without IL-22.Fc. E Quantification of ORO staining from HepG2 cells treated with either 4% lipid mixture (LM) or 4% LM and 80 ng IL-22.Fc. Data depict OD 490 nm values. F Expression of antimicrobial genes from ileal tissues of wildtype mice fed a chow diet and treated with or without IL-22.Fc. G Expression of lipid metabolism genes from ileal tissues of wildtype mice treated with or without IL-22.Fc. H Representative image of small intestinal organoids treated with 4% LM or 4% LM and 5 ng rIL-22. I RT-PCR analysis of lipid metabolism genes from small intestinal organoids treated with 0 or 10 ng rIL-22. Figure 1A–I was generated from 2–3 independent experiments. N = 6 WT and 5 knockout mice for Fig. 1A. N = 7 WT and 5 knockout mice for Fig. 1B. Figure 1H is representative of 3 mice. N = 5 mice in each group for Fig. 1C. N = 5 mice in each group for Figs. 1D, F, and G. N = 8 replicates in Fig. 1E. N = 4 mice in Fig. 1I. Data are presented as mean ± SEM in all graphs. Mann–Whitney test, two-tailed in 1DG, 1I; 2-way ANOVA with Sidak multiple comparisons in 1AC. Scale bar = 100 μm.
Fig. 2
Fig. 2. Systemic metabolism (but not weight gain) is regulated by intestinal-epithelium- and liver-specific IL-22RA1 signaling.
A RT-PCR analysis of ileal Il22ra1 expression from Il22ra1fl/fl;Villin-cre mice. B Weight gain from Il22ra1fl/fl;Villin-cre mice. C GTT from HFD-fed Il22ra1fl/fl;Villin-cre mice. D Representative H&E images of liver tissue from HFD-fed Il22ra1fl/fl;Villin-cre mice. E Representative Oil Red O (ORO) images with quantification from HFD-fed Il22ra1fl/fl;Villin-cre mice. F RT-PCR analysis of hepatic glucose and lipid metabolism genes from HFD-fed Il22ra1fl/fl;Villin-cre mice. G Gas chromatography of total hepatic triglycerides, ceramides, and cholesterol from HFD-fed Il22ra1fl/fl;Villin-cre mice. H Representative H&E images of epididymal WAT from HFD-fed Il22ra1fl/fl;Villin-cre mice. I Scoring of tissues from Fig. 2H. J RT-PCR analysis of lipid metabolism genes from the epididymal WAT of Il22ra1fl/fl;Villin-cre mice. K Gas chromatography of diacylglycerides, phospholipids, and ceramides from epidydimal WAT of HFD-fed Il22ra1fl/fl;Villin-cre mice. Figure 2A represents 5 cre- and 6 cre+ mice. Figure 2B triangles represent control diet and circles represent HFD. Figure 2B represents at least 2 independent experiments for HFD (N = 6 cre- and 4 cre+) and control diet (N = 9 cre- and 8 cre+) mice. Figure 2C represents N = 4 cre- and 6 cre+ mice from 2 independent experiments. Figure 2D represents N = 4 cre- and 6 cre+ mice from 2 independent experiments. Figure 2E represents N = 8 cre- and 11 cre+ mice from 5 independent experiments. Figures 2F and J represent N = 5 (control, cre-), 4 (control, cre+), 6–8 (HFD, cre-), and 7–9 (HFD, cre+) mice per group and 2 (control diet) or 3 (HFD) independent experiments. Figure 2G (N = 4 cre- and 5 cre+ mice) and 2K (N = 4 cre- and 4 cre+ mice) are representative of 2 independent experiments. Figure 2H–I represent N = 12 cre- and 18 cre+ mice and 5 independent experiments. Data are presented as mean ± SEM in all graphs. 2-way ANOVA with Sidak multiple comparisons in 2B, C, 2F, 2J; Mann–Whitney test, two-tailed in 2A, 2E [right], 2G, 2I, and 2K. Scale bar = 50 μm.
Fig. 3
Fig. 3. Liver-specific IL-22RA1 signaling regulates systemic glucose metabolism.
A RT-PCR analysis of Il22ra1 expression from liver tissues of Il22ra1fl/fl;Albumin-cre mice. B Weight gain from HFD-fed Il22ra1fl/fl;Albumin-cre mice. C GTT from HFD-fed Il22ra1fl/fl;Albumin-cre mice. D Representative H&E images of liver tissue from HFD-fed Il22ra1fl/fl;Albumin-cre mice. E Representative ORO images (left) and quantification (right) of liver tissue from HFD-fed Il22ra1fl/fl;Albumin-cre mice. F RT-PCR analysis of glucose (Foxo1, G6pc) and lipid (Acc, Ppara) metabolism genes from the liver of HFD-fed Il22ra1fl/fl;Albumin-cre mice. G Concentration of total triglycerides, ceramides, and cholesterol from liver tissues of HFD-fed Il22ra1fl/fl;Albumin-cre mice determined by gas chromatography. H Representative H&E images of epididymal WAT from HFD-fed Il22ra1fl/fl;Albumin-cre mice. I Epidydimal WAT fat pad mass after HFD. J RT-PCR analysis of lipid metabolism genes from the epididymal WAT of HFD-fed Il22ra1fl/fl;Albumin-cre mice. Figure 3A is generated from 5 cre- and 5 cre+ mice. Figure 3B triangles represent control diet and circles represent HFD. Figure 3B is representative of at least 3 independent experiments for HFD (N = 7 cre- and 7 cre+) and control diet (N = 5 cre- and 6 cre+) mice. Figure 3C is generated from N = 7 cre- and 7 cre+ mice and 3 independent experiments. Figure 3D is representative of 6 cre- and 10 cre+ mice. Figure 3E is representative of N = 4 cre- and 4 cre+ mice from 2 independent experiments. Figures 3F and 3J are generated from N = 5–7 cre- and 8–10 cre+ mice per group. Figure 3H is representative of N = 6 cre- and 8 cre+ mice. Figures 3C, D, F, H, J are representative of 4 independent experiments. Figure 3G, I are generated from 3 independent experiments. Data are presented as mean ± SEM in all graphs. 2-way ANOVA with Sidak multiple comparisons in 3B, C, 3F, 3J; Mann–Whitney test, two-tailed in 3A, 3E (right)–G, 3I, 3K. Scale bar = 50 μm.
Fig. 4
Fig. 4. Intestinal IL-22RA1-mediated alterations in microbiota composition regulate systemic metabolism and inflammation.
A Genus-level heatmap based on Euclidian distance with average linkage using Hierarchical clustering of 16S rRNA sequencing data derived from fecal DNA of Il22ra1fl/fl;Villin-cre mice before (day 0) and after (day 105) HFD. B Volcano plot displaying a differential expression of bacterial genera from Il22ra1fl/fl;Villin-cre mice after HFD. C RT-PCR analysis of epididymal WAT Mmp12 expression from Il22ra1fl/fl;Villin-cre mice fed a control diet or HFD for 16 weeks. D Representative immunofluorescence image of MMP12 staining of epididymal WAT from HFD-fed Il22ra1fl/fl;Villin-cre mice. E Weight gain of HFD-fed Il22ra1fl/fl;Villin-cre mice after 4 weeks of antibiotics treatment starting at week 12 (indicated by dotted line). F GTT from HFD-fed Il22ra1fl/fl;Villin-cre mice after antibiotics treatment. G Representative H&E images of liver tissue from antibiotics treated and HFD-fed Il22ra1fl/fl;Villin-cre mice. H RT-PCR analysis of glucose (Foxo1, G6pc) and lipid (Acc, Ppara) metabolism genes from the liver of antibiotics treated and HFD-fed Il22ra1fl/fl;Villin-cre mice. I Representative H&E images of epididymal WAT from antibiotics treated and HFD-fed Il22ra1fl/fl;Villin-cre mice. J RT-PCR analysis of lipid metabolism genes from the epidydimal WAT of antibiotics-treated and HFD-fed Il22ra1fl/fl;Villin-cre mice. Figures 4A–B, 4E–J are representative of 2 independent experiments. Figure 4A, B are representative of N = 6 cre- and 5 cre+ mice. Figure 4C is representative of N = 4 (control, cre-), 4 (control, cre+), 14 (HFD, cre-), and 17 (HFD, cre+) mice from 2 (control) or 9 (HFD) independent experiments. Figure 4D is representative of N = 4 cre- and 3 cre+ control diet-fed mice, N = 4 cre- and 5 cre+ HFD-fed mice, and 2 (control diet) and 3 (HFD) independent experiments. Figure 4E–J are representative of N = 4 cre- and 4 cre+ mice. Data are presented as mean ± SEM in all graphs. 2-way ANOVA with Sidak multiple comparisons in 4C, 4E, F; Unpaired t-test, one-tailed in B; Mann–Whitney test, two-tailed in H, J. Scale bar = 50 μm.
Fig. 5
Fig. 5. WAT-specific IL-22RA1 signaling does not ameliorate HFD-induced metabolic disorders.
A RT-PCR analysis of Il22ra1 expression from epididymal WAT of Il22ra1fl/fl;Adiponectin-cre mice. B Weight gain from HFD-fed Il22ra1fl/fl;Adiponectin-cre mice. C GTT from HFD-fed Il22ra1fl/fl;Adiponectin-cre mice. D Representative H&E images of liver tissue from HFD-fed Il22ra1fl/fl;Adiponectin-cre mice. E Representative ORO images (left) and quantification (right) of liver tissue from HFD-fed Il22ra1fl/fl;Adiponectin-cre mice. F RT-PCR analysis of glucose and lipid metabolism genes from the liver of HFD-fed Il22ra1fl/fl;Adiponectin-cre mice. G Representative H&E images of epididymal WAT from HFD-fed Il22ra1fl/fl;Adiponectin-cre mice. H Epidydimal WAT fat pad mass after long-term HFD. I RT-PCR analysis of lipid metabolism genes from the epididymal WAT of HFD-fed Il22ra1fl/fl;Adiponectin-cre mice. Figure 5A is generated from 3 cre- and 4 cre+ mice. Figure 5B, C are generated from N = 8 cre- and 8 cre+ mice from 4 independent experiments. Figure 5D, G are generated from N = 6 cre- and 5 cre+ mice from 2 independent experiments. Figure 5E is generated from N = 3 cre- and 3 cre+ mice. Figure 5F, I are generated from N = 6 cre- and 5 cre+ mice from 2 independent experiments. Figure 5H is generated from N = 5 cre- and 6 cre+ mice from 3 independent experiments. Mann–Whitney test, two-tailed in 5A, 5E (right), 5F, 5H, I; 2-way ANOVA with Sidak multiple comparisons in 5B, C. Scale bar = 50 μm.
Fig. 6
Fig. 6. Intestinal IL-22RA1 signaling downregulates the expression of lipid metabolism but not ISC- or progenitor cell-associated markers after HFD.
A RNA-seq analysis of ileal tissue from Il22ra1fl/fl;Villin-cre mice fed 16 weeks of HFD. Heatmaps of genes associated with lipid storage and metabolism (left) and peroxisome-associated genes (right) are shown. B RT-PCR analysis of lipid metabolism genes from ileal tissue of Il22ra1fl/fl;Villin-cre mice fed 16 weeks of chow diet or HFD. C RT-PCR analysis of Il18 and Il18r1 from the ileum of wildtype mice treated with or without IL22.Fc. D RT-PCR analysis of lipid metabolism genes from small intestinal C57BL6/J organoids treated with or without rIL18. Figure 6A is generated from N = 3 cre- and 4 cre+ mice from 3 independent experiments. Figure 6B is generated from N = 6 (chow diet, cre-), 8 (chow diet, cre+), 9 (HFD, cre-), and 13 (HFD, cre+) mice from 2 (chow) or 4 (HFD) independent experiments. Figure 6C is generated from N = 5 cre- and 5 cre+ mice from 2 independent experiments. Figure 6D is generated from N = 8 mice from 3 independent experiments. Data are presented as mean ± SEM in all graphs. Mann–Whitney test, two-tailed in 6 C, D; 2-way ANOVA with Sidak multiple comparisons in 6B.
Fig. 7
Fig. 7. Paneth cell-specific IL-22RA1 signaling mediates their antimicrobial functions and systemic fasting glucose metabolism after HFD.
A RT-PCR analysis of Paneth cell-associated antimicrobial genes from ileal tissues of Il22ra1fl/fl;Villin-cre mice. B Representative immunofluorescence images of LYZ1 staining from Il22ra1fl/fl;Villin-cre mice. C Average number of LYZ1+ cells/crypt for each mouse from Fig. 7B. D RT-PCR analysis of Paneth cell-associated genes from sorted Lgr5-GFPhigh (ISC) and Lgr5-GFPlow (progenitor) cells from Lgr5 reporter mice. E RT-PCR analysis of organoids cultured with pure media, rIL-22, palmitic acid (PA), or PA and rIL-22. Data depict the fold change of the treated groups. F GTTs from chow diet-fed Defa6-cre-/+, ROSA26DTA mice. G Representative immunofluorescence images of LYZ1 staining from Il22ra1fl/fl;Defa6-cre mice. H Average number of LYZ1+ cells/crypt from Fig. 7G. I Weight gain of HFD-fed Il22ra1fl/fl;Defa6-cre mice. J Glucose values from Il22ra1fl/fl;Defa6-cre mice after fasting. Figure 7A represents N = 5–6 (chow diet, cre-), 5–6 (chow diet, cre+), 4 (HFD, cre-), and 8 (HFD, cre+) mice per group and 3 independent experiments. Figure 7B, C represent N = 4 (chow diet, cre-), 4 (chow diet, cre+), 4 (HFD, cre-), and 5 (HFD, cre+) mice from 2 independent experiments. Figure 7D represents N = 3 control diet-fed mice and 4 HFD-fed mice from 2 independent experiments. Figure 7E represents N = 5 mice from 2 independent experiments. Figure 7F represents N = 3 cre- and 4 cre+ mice from 2 independent experiments. Figure 7G, H represent N = 4 (chow diet, cre-), 4 (chow diet, cre+), 5 (HFD, cre-), and 5 (HFD, cre+) mice from 1 (chow) or 3 (HFD) independent experiments. Figure 7I represents N = 5 cre- and 7 cre+ mice from 4 independent experiments. Figure 7J represents N = 11 cre- and cre+ mice from 4 independent experiments. Data are presented as mean ± SEM in all graphs. Mann–Whitney test, two-tailed in 7J; 1-way ANOVA with Tukey multiple comparisons in 7E; 2-way ANOVA with Sidak multiple comparisons in 7A, 7C, 7D, 7F, 7H, 7I. Scale bar = 20 μm.

Similar articles

Cited by

References

    1. Keir ME, Yi T, Lu TT, Ghilardi N. The role of IL-22 in intestinal health and disease. J. Exp. Med. 2020;217:e20192195. doi: 10.1084/jem.20192195. - DOI - PMC - PubMed
    1. Parks OB, Pociask DA, Hodzic Z, Kolls JK, Good M. Interleukin-22 signaling in the regulation of intestinal health and disease. Front. Cell Dev. Biol. 2016;3:85. doi: 10.3389/fcell.2015.00085. - DOI - PMC - PubMed
    1. Sugimoto, K. et al. IL-22 ameliorates intestinal inflammation in a mouse model of ulcerative colitis. J. Clin. Investig.10.1172/JCI33194 (2008). - PMC - PubMed
    1. Wang X, et al. Interleukin-22 alleviates metabolic disorders and restores mucosal immunity in diabetes. Nature. 2014;514:237–241. doi: 10.1038/nature13564. - DOI - PubMed
    1. Zenewicz LA, et al. Innate and adaptive interleukin-22 protects mice from inflammatory bowel disease. Immunity. 2008;29:947–957. doi: 10.1016/j.immuni.2008.11.003. - DOI - PMC - PubMed