. 2024 Feb 21;15(1):1570.
doi: 10.1038/s41467-024-45971-z.

Heterogeneity of synaptic connectivity in the fly visual system

Affiliations

Heterogeneity of synaptic connectivity in the fly visual system

Jacqueline Cornean et al. Nat Commun. .

Abstract

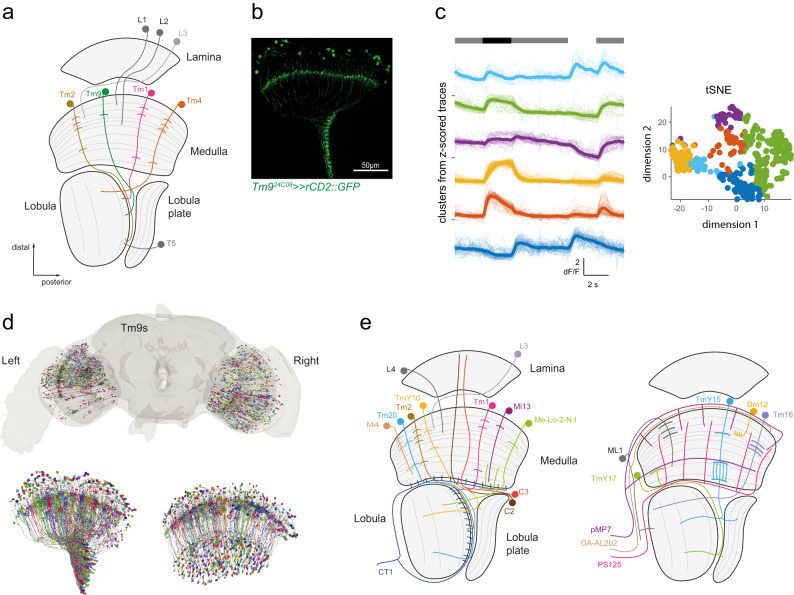
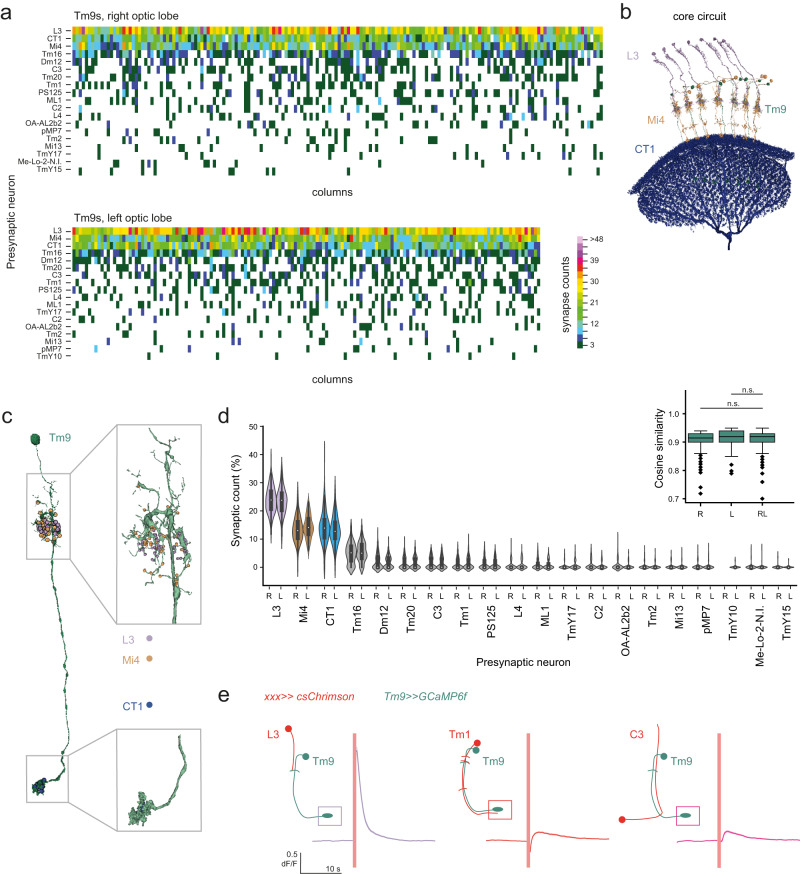
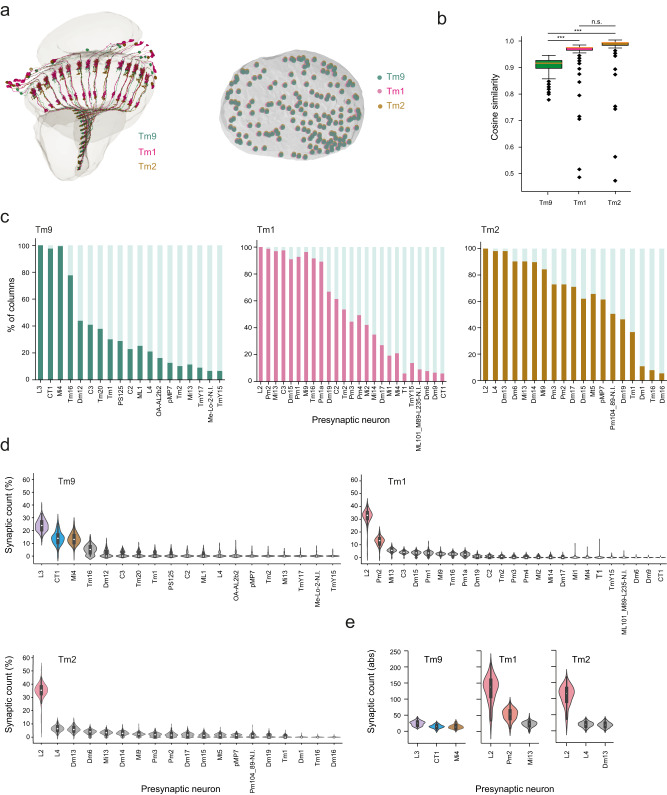
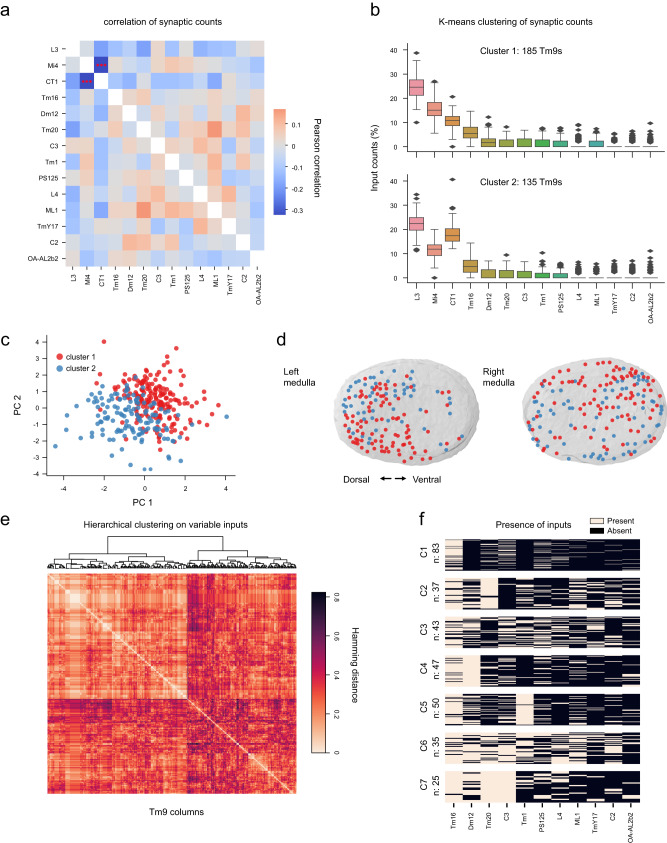
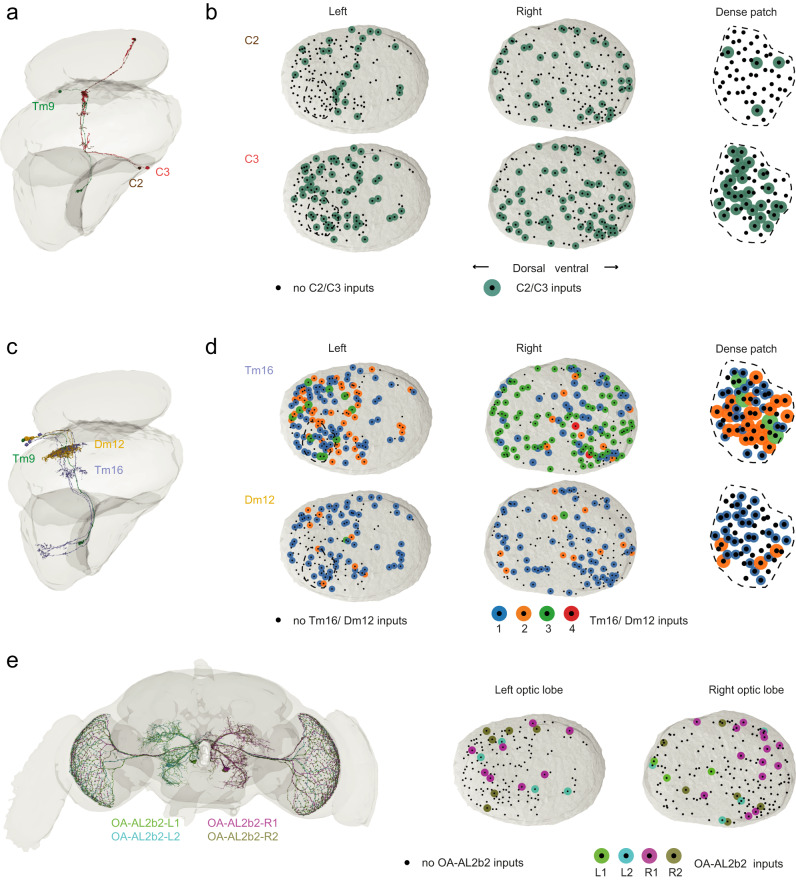
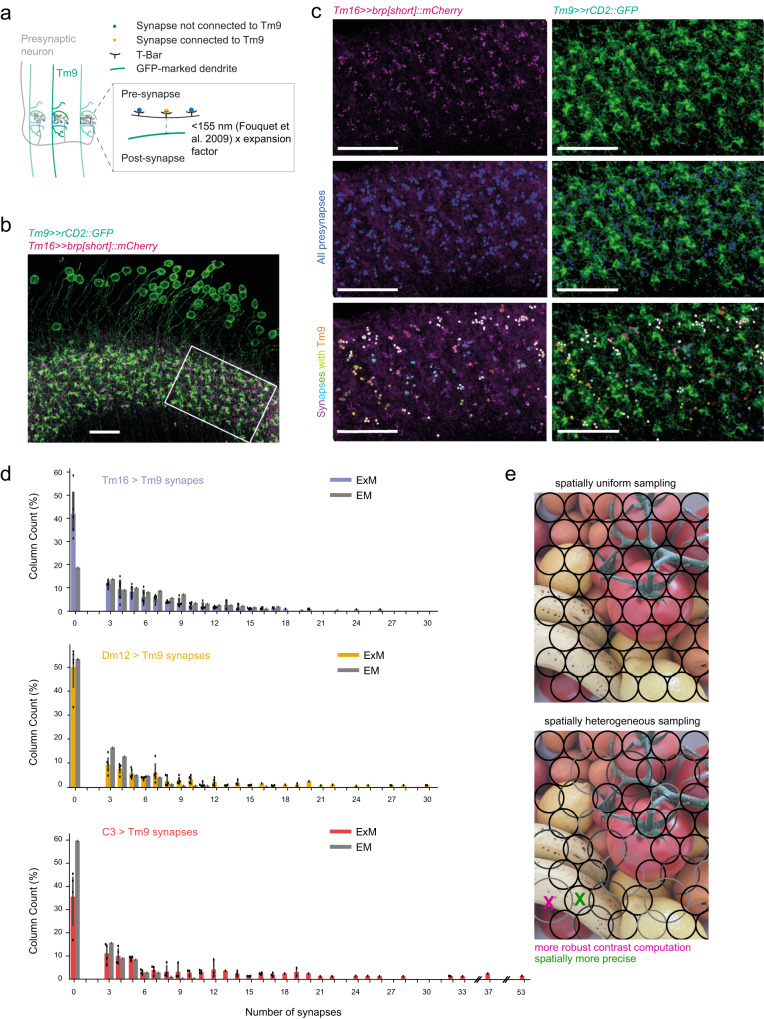
Visual systems are homogeneous structures, where repeating columnar units retinotopically cover the visual field. Each of these columns contain many of the same neuron types that are distinguished by anatomic, genetic and - generally - by functional properties. However, there are exceptions to this rule. In the 800 columns of the Drosophila eye, there is an anatomically and genetically identifiable cell type with variable functional properties, Tm9. Since anatomical connectivity shapes functional neuronal properties, we identified the presynaptic inputs of several hundred Tm9s across both optic lobes using the full adult female fly brain (FAFB) electron microscopic dataset and FlyWire connectome. Our work shows that Tm9 has three major and many sparsely distributed inputs. This differs from the presynaptic connectivity of other Tm neurons, which have only one major, and more stereotypic inputs than Tm9. Genetic synapse labeling showed that the heterogeneous wiring exists across individuals. Together, our data argue that the visual system uses heterogeneous, distributed circuit properties to achieve robust visual processing.


Conflict of interest statement

The authors declare no competing interests.

Figures

Fig. 1
Fig. 1. Mapping all presynaptic inputs to Tm9 in FlyWire.
a Schematic of the fly visual system, including core circuitry of the OFF pathway. b Confocal image of a visual system in which a Tm9-specific Gal4 line drives expression of GFP (green). Representative example of n = 7 brains imaged. The scale bar is 50 µm. c In vivo calcium signals in Tm9 in response to ON-OFF-fullfield flashes. Shown are time traces (all individual traces and the mean, n = 20) and tSNE analysis of Z-scored traces, color-coded upon k-means clustering (6 clusters). d Overview of all 320 Tm9 neurons of the FAFB dataset analyzed in FlyWire (top), two views of all Tm9s analyzed in the right optic lobe (bottom). e Schematic displaying the 20 input partners identified in this analysis to be present in at least 5% of all columns analyzed.
Fig. 2
Fig. 2. Analysis of heterogeneous Tm9 inputs.
a Matrices showing synaptic counts of presynaptic inputs to Tm9 neurons of 170 columns and 150 columns of the right and left optic lobes respectively, as long as they are present in >5% of columns. b Tm9s (green) and their common presynaptic inputs L3 (purple), Mi4 (brown), and CT1 (blue). c Spatial locations of the presynapses of L3 (purple) and Mi4 (brown) on the Tm9 dendrites, and CT1 (blue) synapses on the Tm9 axon terminal. d Violin plots of the relative synaptic counts of Tm9 inputs, showing the median (white dot), the interquartile range (thick gray bar), 1.5x interquartile range (thin gray line), and outliers. Neurons with >10% contribution to synapse count are color-coded. The inset shows cosine similarity between right (R) or left (L) Tm9s and a mixed (LR) set. Box plots show the median (center line), upper and lower quartiles (box limits), the extent of the distribution (whiskers), and outliers (points). n.s. non-significant (p > 0.05), tested using a two-sided Kruskal–Wallis test, followed by pairwise comparisons with Dunn–Bonferroni correction for multiple comparisons. n = 170 columns and 150 columns of the right and left optic lobes, respectively. P values for pairwise comparisons: R-RL = 0.1829, L-RL = 0.1462. e In vivo calcium signals recorded in Tm9 neurons expressing GCaMP6f upon optogenetic activation of csChrimson expressed in L3 (n = 569 ROIs, N = 8 flies), Tm1 (n = 154 ROIs, N = 2 flies), or C3 (n = 658 ROIs, N = 8 flies), imaged in a norpA mutant background. The red line denotes the time of activation. Traces show mean ± sem.
Fig. 3
Fig. 3. Tm9 has more heterogeneous input partners than other Tm neurons.
a Left: Some example Tm9, Tm1, and Tm2 neurons from the same columns. Right: Top view of the medulla, each green/magenta/brown dot depicts one Tm9/Tm1/Tm2 analyzed. b Cosine similarity within Tm9, Tm1, or Tm2 datasets. Box plots show the median (center line), upper and lower quartiles (box limits), the extent of the distribution (whiskers), and outliers (points). Statistical testing was done using a two-sided Kruskal–Wallis test, followed by pairwise comparisons with Dunn–Bonferroni correction for multiple comparisons. ***p < 0.001, n.s. non-significant (p > 0.05). Kruskal–Wallis p value = 2.542 e-64. P values for pairwise comparisons: Tm9-Tm1 = 3.7629e-55, Tm9-Tm2 = 5.3286e-42, Tm1-Tm2 = 0,1239. c Bar graphs illustrating the % of columns in which a presynaptic input is present for Tm9, Tm1, and Tm2. d, e Violin plots of the relative synaptic counts of Tm inputs (d), and of the absolute synaptic counts of the first three major inputs to Tm neurons (e), showing the median (white dot), the interquartile range (thick gray bar), 1.5x interquartile range (thin gray line) and outliers. Neurons with more than 10% contribution of all synapse counts are color-coded. n = 166 Tm9/Tm1/Tm2 (from the same columns).
Fig. 4
Fig. 4. Circuit motifs in presynaptic Tm9 connectivity.
a Heatmap of the Pearson correlation between Tm9 input neuron counts. Statistical testing was done using a two-sided Student’s t-test, ***p < 0.001, followed by Bonferonni correction for multiple comparisons. b Input counts of Tm9 neurons upon K-means clustering of input connectivity with a cluster number of two. Box plots show the median (center line), upper and lower quartiles (box limits), standard deviation (whiskers), and outliers (points). Data from n = 320 columns. c Tm9 input connectivity projected onto PC1 and PC2 with labels representing clusters from K-means (cluster 1, red; cluster 2, blue). d The location of the analyzed Tm9 neurons in the medulla, colored to represent the K-means clusters. e Heatmap showing the Hamming distances between Tm9 columns ordered based on the dendrogram upon hierarchical clustering considering only the variable inputs (excluding L3, Mi4, CT1). f Input motifs from the clustering approach in (e). Each row of the binary image represents a Tm9 neuron (n = 320), the binary color code indicates the presence or absence of input neurons within each cluster. Seven clusters were chosen based on the silhouette coefficient after clustering with different numbers of neurons (n, given to the left of the plot).
Fig. 5
Fig. 5. Different types of cells connect to Tm9.
a Illustrations of one Tm9 (green) with its input partners C2 (brown) and C3 (red). b Top view of the medulla with each black dot depicting one Tm9 neuron analyzed, green dots show the presence of C2 (top) or C3 (bottom) as an input partner to these Tm9s for the left and right optic lobes. The same is shown for the dense patch, a region in the left optic lobe (dashed lines) in which Tm9s were analyzed in each column. c Illustrations of one Tm9 (green) getting input from two Dm12s (yellow) and three Tm16s (blue). d Same as in (b) for Tm16 and Dm12, only that the color of the dots additionally represents the number of cells of one type connected to Tm9 in that column. e Image of all four OA-AL2b2 cells (left) as well as their individual connectivity to Tm9.
Fig. 6
Fig. 6. Expansion microscopy (ExM) confirms heterogeneity of presynaptic inputs across flies.
a Schematic of the experiment. b Confocal image of a medulla in which Tm9 dendrites are marked with rCD2::GFP (green) and Tm16 presynapses with Brp[short]::mCherry (magenta). c Confocal images showing the boxed area in (b). All presynapses are identified (blue, middle), and the ones in close proximity to Tm9 dendrites are sorted into columns (different colors, bottom). All scale bars are 20 μm. d Barplots showing the percent columns in which a specific presynaptic neuron (Tm16, Dm12, and C3) makes a certain number of connections with Tm9. Bar graphs of ExM data show mean, 95% confidence interval and all individual data points. Tm16 n = 5, Dm12 n = 5, and C3 n = 4 flies. e A visual scene as sampled by a columnar visual neuron with uniform spatial receptive fields (top) or by a columnar visual neuron with spatial receptive fields of various sizes (bottom). Small receptive fields are spatially more precise (green), whereas bigger receptive fields can contribute to more robust contrast computation (green).

Similar articles

Cited by

  • Neuronal wiring diagram of an adult brain.
    Dorkenwald S, Matsliah A, Sterling AR, Schlegel P, Yu SC, McKellar CE, Lin A, Costa M, Eichler K, Yin Y, Silversmith W, Schneider-Mizell C, Jordan CS, Brittain D, Halageri A, Kuehner K, Ogedengbe O, Morey R, Gager J, Kruk K, Perlman E, Yang R, Deutsch D, Bland D, Sorek M, Lu R, Macrina T, Lee K, Bae JA, Mu S, Nehoran B, Mitchell E, Popovych S, Wu J, Jia Z, Castro MA, Kemnitz N, Ih D, Bates AS, Eckstein N, Funke J, Collman F, Bock DD, Jefferis GSXE, Seung HS, Murthy M; FlyWire Consortium. Dorkenwald S, et al. Nature. 2024 Oct;634(8032):124-138. doi: 10.1038/s41586-024-07558-y. Epub 2024 Oct 2. Nature. 2024. PMID: 39358518 Free PMC article.
  • Disentangling how the brain is wired.
    Sprecher SG. Sprecher SG. Fly (Austin). 2025 Dec;19(1):2440950. doi: 10.1080/19336934.2024.2440950. Epub 2024 Dec 31. Fly (Austin). 2025. PMID: 39737740 Free PMC article. No abstract available.
  • Neural pathways and computations that achieve stable contrast processing tuned to natural scenes.
    Gür B, Ramirez L, Cornean J, Thurn F, Molina-Obando S, Ramos-Traslosheros G, Silies M. Gür B, et al. Nat Commun. 2024 Oct 3;15(1):8580. doi: 10.1038/s41467-024-52724-5. Nat Commun. 2024. PMID: 39362859 Free PMC article.
  • Wiring up for controlled flight.
    Cardona A. Cardona A. Elife. 2024 Mar 4;13:e95989. doi: 10.7554/eLife.95989. Elife. 2024. PMID: 38436656 Free PMC article.
  • Connectome-driven neural inventory of a complete visual system.
    Nern A, Loesche F, Takemura SY, Burnett LE, Dreher M, Gruntman E, Hoeller J, Huang GB, Januszewski M, Klapoetke NC, Koskela S, Longden KD, Lu Z, Preibisch S, Qiu W, Rogers EM, Seenivasan P, Zhao A, Bogovic J, Canino BS, Clements J, Cook M, Finley-May S, Flynn MA, Hameed I, Fragniere AMC, Hayworth KJ, Hopkins GP, Hubbard PM, Katz WT, Kovalyak J, Lauchie SA, Leonard M, Lohff A, Maldonado CA, Mooney C, Okeoma N, Olbris DJ, Ordish C, Paterson T, Phillips EM, Pietzsch T, Salinas JR, Rivlin PK, Schlegel P, Scott AL, Scuderi LA, Takemura S, Talebi I, Thomson A, Trautman ET, Umayam L, Walsh C, Walsh JJ, Xu CS, Yakal EA, Yang T, Zhao T, Funke J, George R, Hess HF, Jefferis GSXE, Knecht C, Korff W, Plaza SM, Romani S, Saalfeld S, Scheffer LK, Berg S, Rubin GM, Reiser MB. Nern A, et al. Nature. 2025 May;641(8065):1225-1237. doi: 10.1038/s41586-025-08746-0. Epub 2025 Mar 26. Nature. 2025. PMID: 40140576 Free PMC article.

References

    1. Nassi JJ, Callaway EM. Parallel processing strategies of the primate visual system. Nat. Rev. Neurosci. 2009;10:360–372. doi: 10.1038/nrn2619. - DOI - PMC - PubMed
    1. Currier TA, Pang MM, Clandinin TR. Visual processing in the fly, from photoreceptors to behavior. Genetics. 2023;224:iyad064. doi: 10.1093/genetics/iyad064. - DOI - PMC - PubMed
    1. Silies M, Gohl DM, Clandinin TR. Motion-detecting circuits in flies: coming into view. Annu. Rev. Neurosci. 2014;37:307–327. doi: 10.1146/annurev-neuro-071013-013931. - DOI - PubMed
    1. Masland RH. The neuronal organization of the retina. Neuron. 2012;76:266–280. doi: 10.1016/j.neuron.2012.10.002. - DOI - PMC - PubMed
    1. Fischbach, K.-F & Dittrich, A. P. M. The optic lobe of Drosophila melanogaster. I. A Golgi analysis of wild-type structure. Cell Tissue Res. 258, 441–475 (1989).

LinkOut - more resources