

Heatwaves in Peninsular Malaysia: a spatiotemporal analysis
- PMID: 38383678
- PMCID: PMC10882015
- DOI: 10.1038/s41598-024-53960-x
Heatwaves in Peninsular Malaysia: a spatiotemporal analysis
Abstract
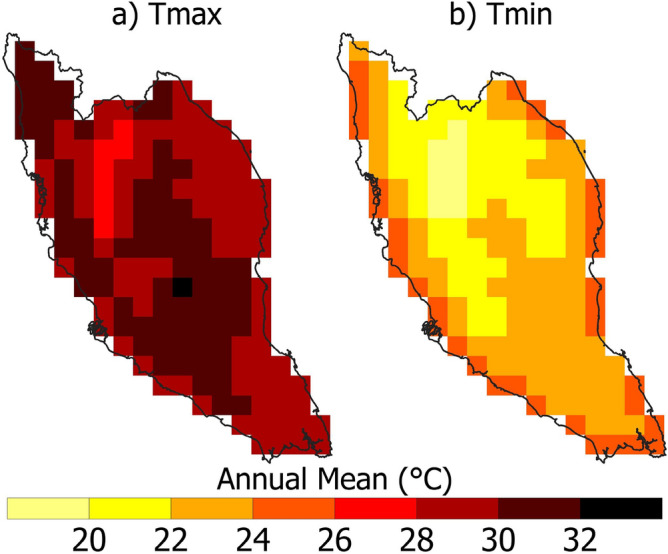
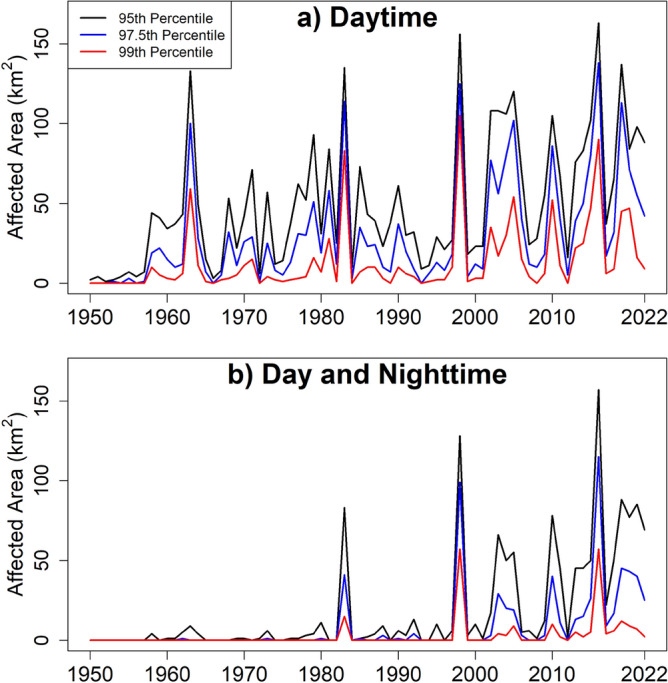
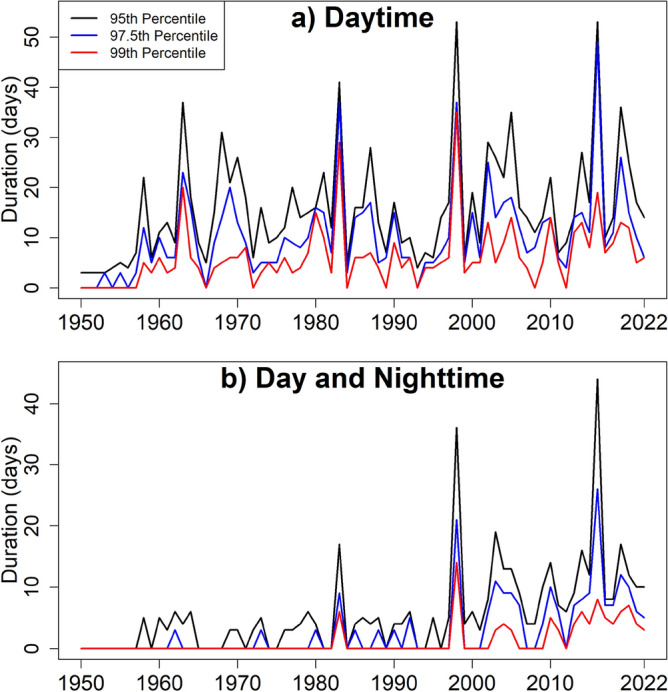
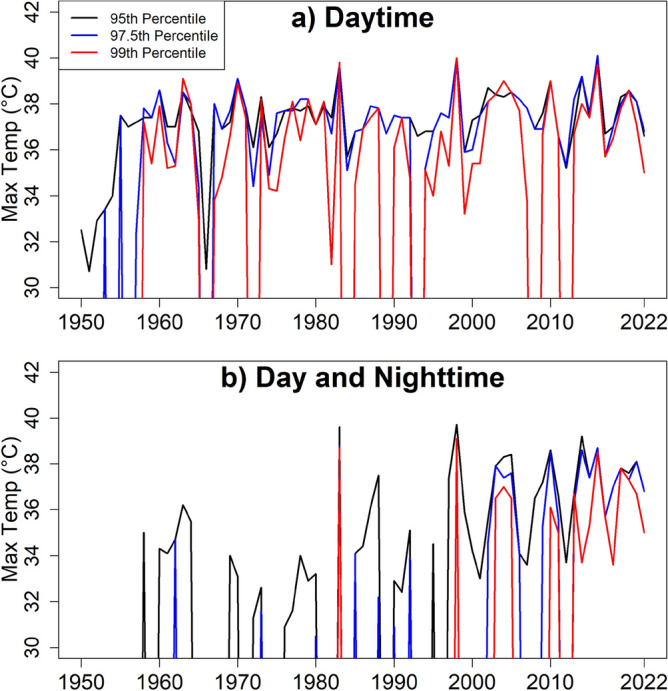
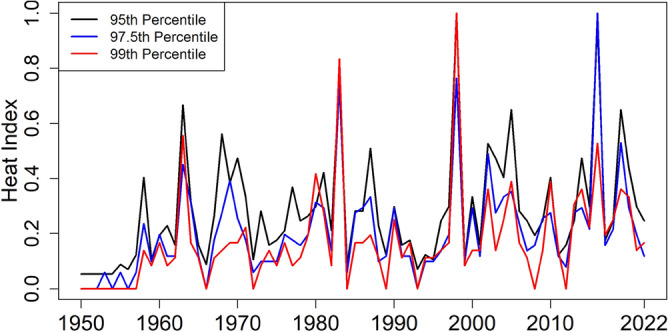
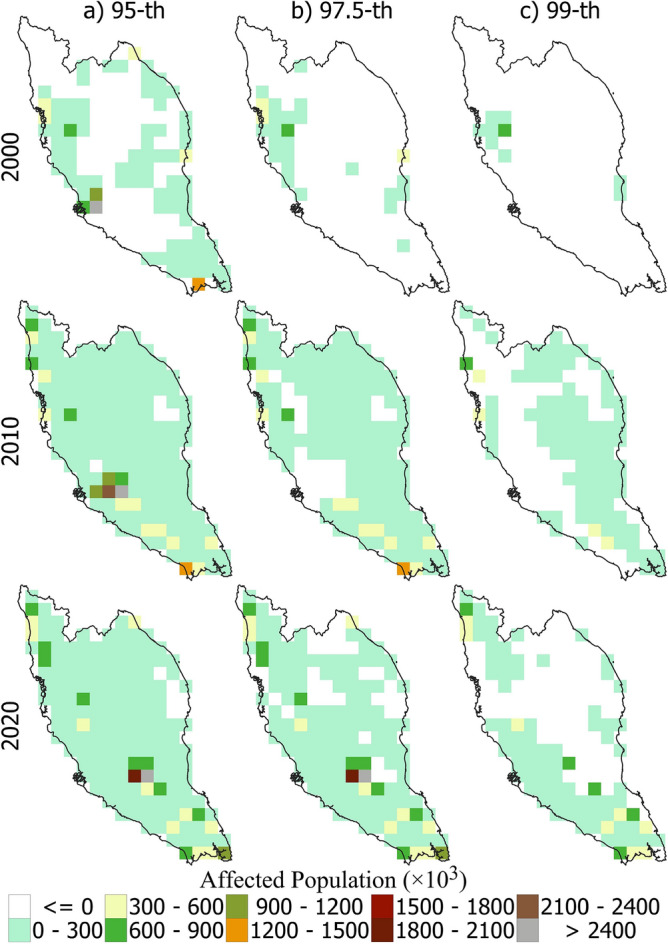
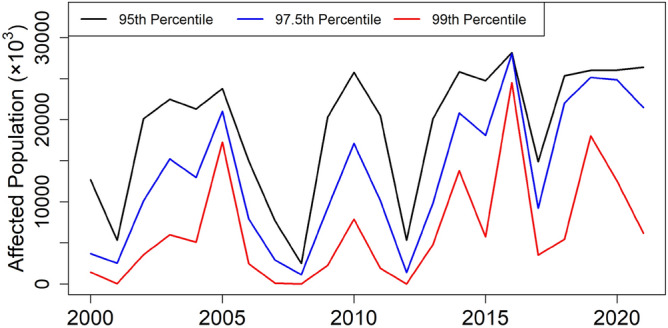
One of the direct and unavoidable consequences of global warming-induced rising temperatures is the more recurrent and severe heatwaves. In recent years, even countries like Malaysia seldom had some mild to severe heatwaves. As the Earth's average temperature continues to rise, heatwaves in Malaysia will undoubtedly worsen in the future. It is crucial to characterize and monitor heat events across time to effectively prepare for and implement preventative actions to lessen heatwave's social and economic effects. This study proposes heatwave-related indices that take into account both daily maximum (Tmax) and daily lowest (Tmin) temperatures to evaluate shifts in heatwave features in Peninsular Malaysia (PM). Daily ERA5 temperature dataset with a geographical resolution of 0.25° for the period 1950-2022 was used to analyze the changes in the frequency and severity of heat waves across PM, while the LandScan gridded population data from 2000 to 2020 was used to calculate the affected population to the heatwaves. This study also utilized Sen's slope for trend analysis of heatwave characteristics, which separates multi-decadal oscillatory fluctuations from secular trends. The findings demonstrated that the geographical pattern of heatwaves in PM could be reconstructed if daily Tmax is more than the 95th percentile for 3 or more days. The data indicated that the southwest was more prone to severe heatwaves. The PM experienced more heatwaves after 2000 than before. Overall, the heatwave-affected area in PM has increased by 8.98 km2/decade and its duration by 1.54 days/decade. The highest population affected was located in the central south region of PM. These findings provide valuable insights into the heatwaves pattern and impact.
Keywords: Hot extremes; LandScan population; Peninsular Malaysia; Reanalysis data; Tropical region.
© 2024. Crown.
Conflict of interest statement
The authors declare no competing interests.
Figures


References
-
- Nijsse FJ, Cox PM, Huntingford C, Williamson MS. Decadal global temperature variability increases strongly with climate sensitivity. Nat. Clim. Chang. 2019;9:598–601. doi: 10.1038/s41558-019-0527-4. - DOI
-
- Hamed MM, Nashwan MS, Shahid S. Projected changes in thermal bioclimatic indicators over the Middle East and North Africa under Paris climate agreement. Stoch. Env. Res. Risk Assess. 2022 doi: 10.1007/s00477-022-02275-2. - DOI
-
- Wang P, et al. Heat waves in China: Definitions, leading patterns, and connections to large-scale atmospheric circulation and SSTs. J. Geophys. Res. Atmosph. 2017;122(10):679–610,699.
Grants and funding
LinkOut - more resources
Full Text Sources
Research Materials
