

Hepa-ToxMOA: a pathway-screening method for evaluating cellular stress and hepatic metabolic-dependent toxicity of natural products
- PMID: 38383711
- PMCID: PMC10881971
- DOI: 10.1038/s41598-024-54634-4
Hepa-ToxMOA: a pathway-screening method for evaluating cellular stress and hepatic metabolic-dependent toxicity of natural products
Abstract
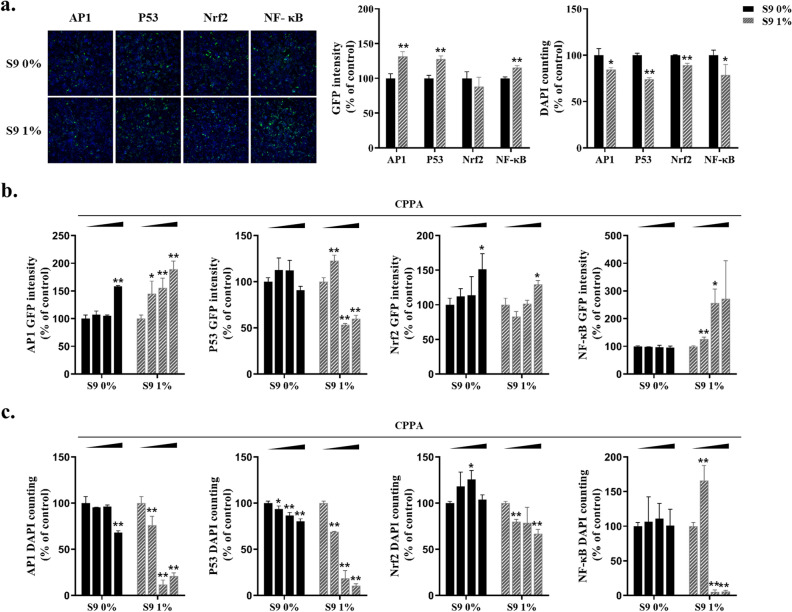
In the field of drug discovery, natural products have emerged as therapeutic agents for diseases such as cancer. However, their potential toxicity poses significant obstacles in the developing effective drug candidates. To overcome this limitation, we propose a pathway-screening method based on imaging analysis to evaluate cellular stress caused by natural products. We have established a cellular stress sensing system, named Hepa-ToxMOA, which utilizes HepG2 cells expressing green fluorescent protein (GFP) fluorescence under the control of transcription factor response elements (TREs) for transcription factors (AP1, P53, Nrf2, and NF-κB). Additionally, to augment the drug metabolic activity of the HepG2 cell line, we evaluated the cytotoxicity of 40 natural products with and without S9 fraction-based metabolic activity. Our finding revealed different activities of Hepa-ToxMOA depending on metabolic or non-metabolic activity, highlighting the involvement of specific cellular stress pathways. Our results suggest that developing a Hepa-ToxMOA system based on activity of drug metabolizing enzyme provides crucial insights into the molecular mechanisms initiating cellular stress during liver toxicity screening for natural products. The pathway-screening method addresses challenges related to the potential toxicity of natural products, advancing their translation into viable therapeutic agents.
© 2024. The Author(s).
Conflict of interest statement
The authors declare no competing interests.
Figures


Similar articles
-
Activation of the Nrf2 response by intrinsic hepatotoxic drugs correlates with suppression of NF-κB activation and sensitizes toward TNFα-induced cytotoxicity.Arch Toxicol. 2016 May;90(5):1163-79. doi: 10.1007/s00204-015-1536-3. Epub 2015 May 31. Arch Toxicol. 2016. PMID: 26026609 Free PMC article.
-
A systematic analysis of Nrf2 pathway activation dynamics during repeated xenobiotic exposure.Arch Toxicol. 2019 Feb;93(2):435-451. doi: 10.1007/s00204-018-2353-2. Epub 2018 Nov 20. Arch Toxicol. 2019. PMID: 30456486
-
Quercetin modulates OTA-induced oxidative stress and redox signalling in HepG2 cells - up regulation of Nrf2 expression and down regulation of NF-κB and COX-2.Biochim Biophys Acta. 2014 Jan;1840(1):681-92. doi: 10.1016/j.bbagen.2013.10.024. Epub 2013 Oct 24. Biochim Biophys Acta. 2014. PMID: 24161694
-
Dissecting molecular cross-talk between Nrf2 and NF-κB response pathways.Biochem Soc Trans. 2015 Aug;43(4):621-6. doi: 10.1042/BST20150014. Epub 2015 Aug 3. Biochem Soc Trans. 2015. PMID: 26551702 Free PMC article. Review.
-
[Nrf2-NF-κB pathway axes, epigenetic regulation and traditional Chinese medicine (natural medicine) to treat type 2 diabetes].Zhongguo Zhong Yao Za Zhi. 2016 Dec;41(23):4314-4319. doi: 10.4268/cjcmm20162304. Zhongguo Zhong Yao Za Zhi. 2016. PMID: 28933105 Review. Chinese.
References
-
- Grabley S, Thiericke R. Bioactive agents from natural sources: Trends in discovery and application. Adv. Biochem. Eng. Biotchnol. 1999;64:101–154. - PubMed
MeSH terms
Substances
LinkOut - more resources
Full Text Sources
Research Materials
Miscellaneous
