

Inhibition of epigenetic and cell cycle-related targets in glioblastoma cell lines reveals that onametostat reduces proliferation and viability in both normoxic and hypoxic conditions
- PMID: 38383756
- PMCID: PMC10881536
- DOI: 10.1038/s41598-024-54707-4
Inhibition of epigenetic and cell cycle-related targets in glioblastoma cell lines reveals that onametostat reduces proliferation and viability in both normoxic and hypoxic conditions
Abstract
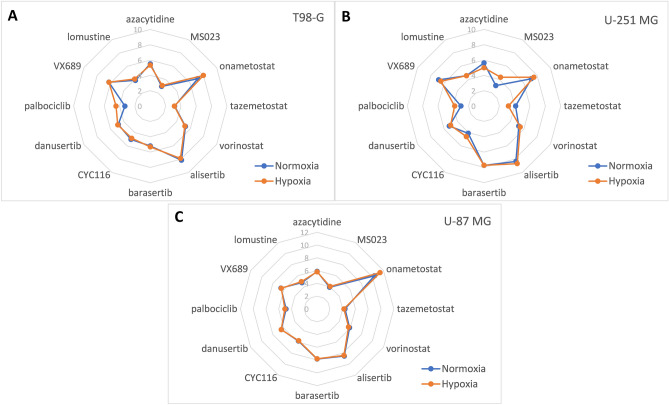
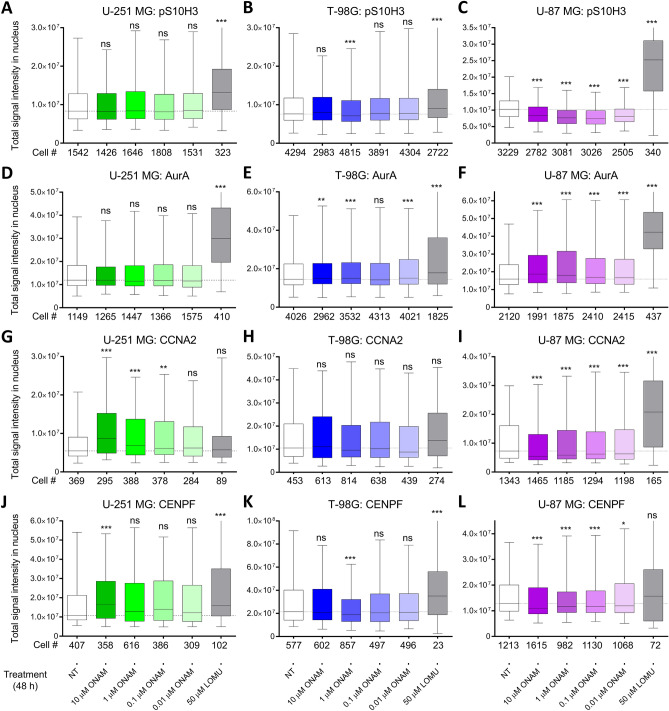
The choice of targeted therapies for treatment of glioblastoma patients is currently limited, and most glioblastoma patients die from the disease recurrence. Thus, systematic studies in simplified model systems are required to pinpoint the choice of targets for further exploration in clinical settings. Here, we report screening of 5 compounds targeting epigenetic writers or erasers and 6 compounds targeting cell cycle-regulating protein kinases against 3 glioblastoma cell lines following incubation under normoxic or hypoxic conditions. The viability/proliferation assay indicated that PRMT5 inhibitor onametostat was endowed with high potency under both normoxic and hypoxic conditions in cell lines that are strongly MGMT-positive (T98-G), weakly MGMT-positive (U-251 MG), or MGMT-negative (U-87 MG). In U-251 MG and U-87 MG cells, onametostat also affected the spheroid formation at concentrations lower than the currently used chemotherapeutic drug lomustine. In T98-G cell line, treatment with onametostat led to dramatic changes in the transcriptome profile by inducing the cell cycle arrest, suppressing RNA splicing, and down-regulating several major glioblastoma cell survival pathways. Further validation by immunostaining in three cell lines confirmed that onametostat affects cell cycle and causes reduction in nucleolar protein levels. In this way, inhibition of epigenetic targets might represent a viable strategy for glioblastoma treatment even in the case of decreased chemo- and radiation sensitivity, although further studies in clinically more relevant models are required.
© 2024. The Author(s).
Conflict of interest statement
The authors declare no competing interests.
Figures


Similar articles
-
Viability fingerprint of glioblastoma cell lines: roles of mitotic, proliferative, and epigenetic targets.Sci Rep. 2021 Oct 13;11(1):20338. doi: 10.1038/s41598-021-99630-0. Sci Rep. 2021. PMID: 34645858 Free PMC article.
-
Genetic validation of the protein arginine methyltransferase PRMT5 as a candidate therapeutic target in glioblastoma.Cancer Res. 2014 Mar 15;74(6):1752-65. doi: 10.1158/0008-5472.CAN-13-0884. Epub 2014 Jan 22. Cancer Res. 2014. PMID: 24453002 Free PMC article.
-
Pulsed and Discontinuous Electromagnetic Field Exposure Decreases Temozolomide Resistance in Glioblastoma by Modulating the Expression of O6-Methylguanine-DNA Methyltransferase, Cyclin-D1, and p53.Cancer Biother Radiopharm. 2021 Sep;36(7):579-587. doi: 10.1089/cbr.2020.3851. Epub 2020 Jul 9. Cancer Biother Radiopharm. 2021. PMID: 32644826
-
Therapeutic potential of natural products in glioblastoma treatment: targeting key glioblastoma signaling pathways and epigenetic alterations.Clin Transl Oncol. 2020 Jul;22(7):963-977. doi: 10.1007/s12094-019-02227-3. Epub 2019 Oct 19. Clin Transl Oncol. 2020. PMID: 31630356 Review.
-
Integrative analysis of cell adhesion molecules in glioblastoma identified prostaglandin F2 receptor inhibitor (PTGFRN) as an essential gene.BMC Cancer. 2022 Jun 11;22(1):642. doi: 10.1186/s12885-022-09682-2. BMC Cancer. 2022. PMID: 35690717 Free PMC article. Review.
Cited by
-
The Complexity of Malignant Glioma Treatment.Cancers (Basel). 2025 Mar 4;17(5):879. doi: 10.3390/cancers17050879. Cancers (Basel). 2025. PMID: 40075726 Free PMC article. Review.
-
Proteome changes associated with effect of high dose single-fractionation radiation on lung adenocarcinoma cell lines.Sci Rep. 2025 Jul 7;15(1):24245. doi: 10.1038/s41598-025-09285-4. Sci Rep. 2025. PMID: 40624183 Free PMC article.
References
MeSH terms
Substances
Grants and funding
- PRG454/Estonian Ministry of Education and Research and the Estonian Research Council
- PUT1077/Estonian Ministry of Education and Research and the Estonian Research Council
- PRG1076/Estonian Ministry of Education and Research and the Estonian Research Council
- 2014-2020.4.01.15-0012/European Regional Development Fund
- ERIN, grant no. EU952516/Horizon 2020 innovation grant
LinkOut - more resources
Full Text Sources
Medical
Molecular Biology Databases
Research Materials
