. 2024 Apr;21(4):374-392.
doi: 10.1038/s41423-024-01133-1. Epub 2024 Feb 21.

CD4+ T cells produce IFN-I to license cDC1s for induction of cytotoxic T-cell activity in human tumors

Affiliations

CD4+ T cells produce IFN-I to license cDC1s for induction of cytotoxic T-cell activity in human tumors

Xin Lei et al. Cell Mol Immunol. 2024 Apr.

Abstract

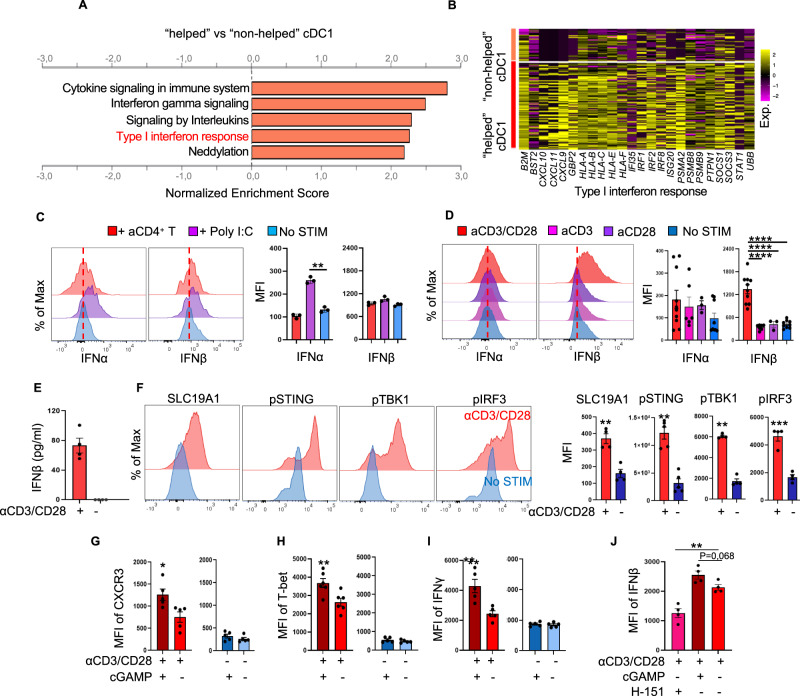
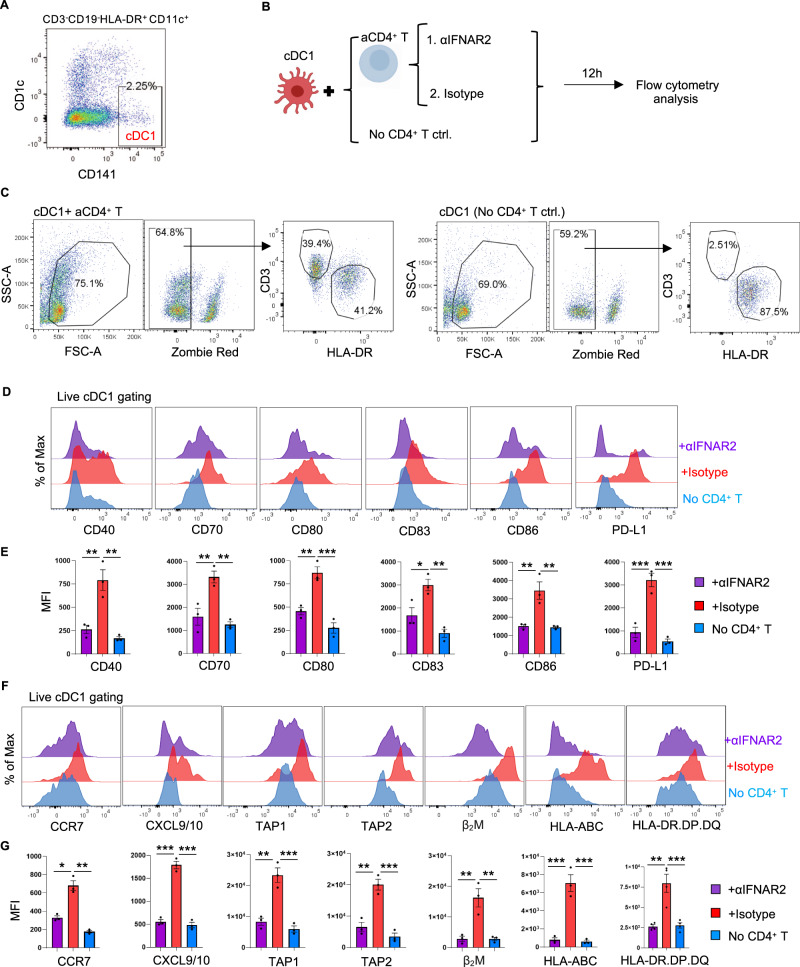
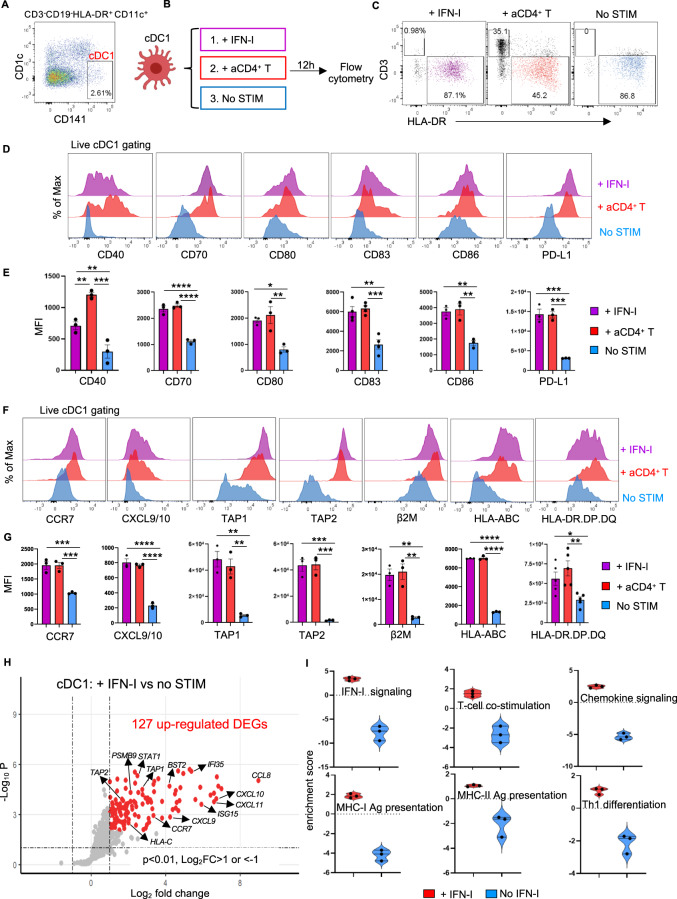
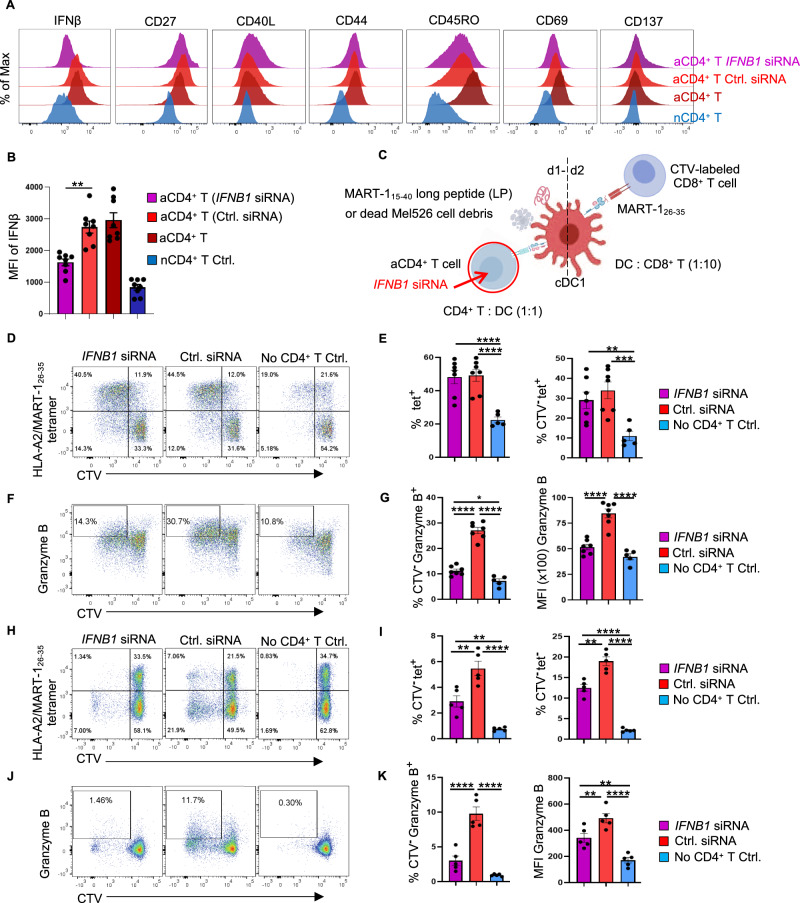
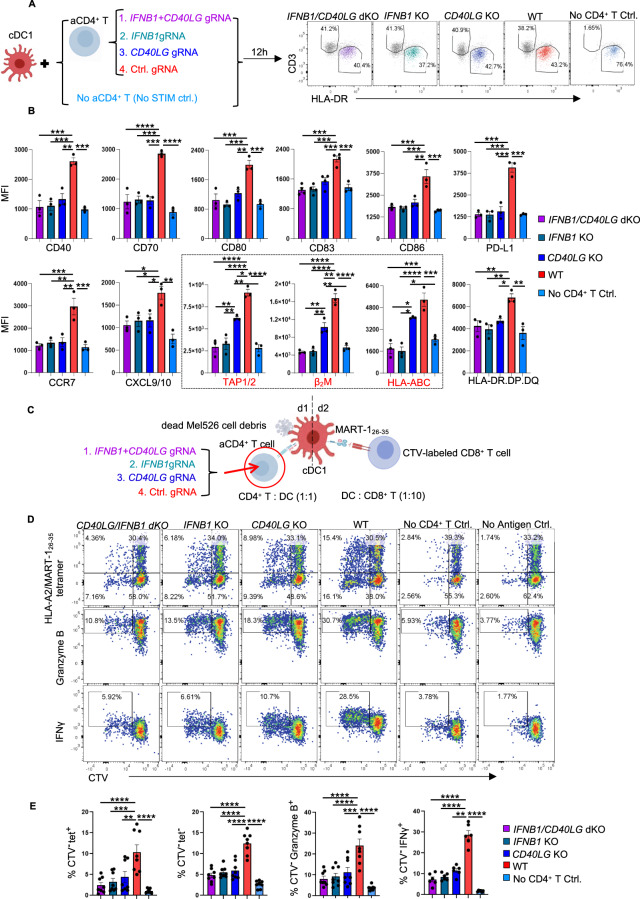
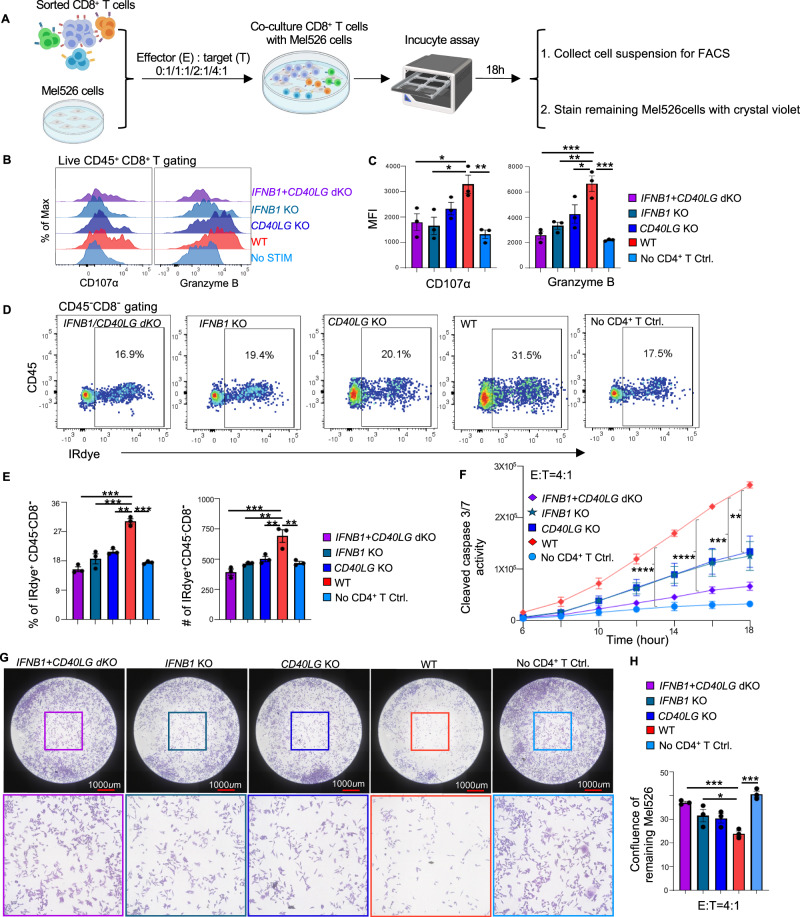
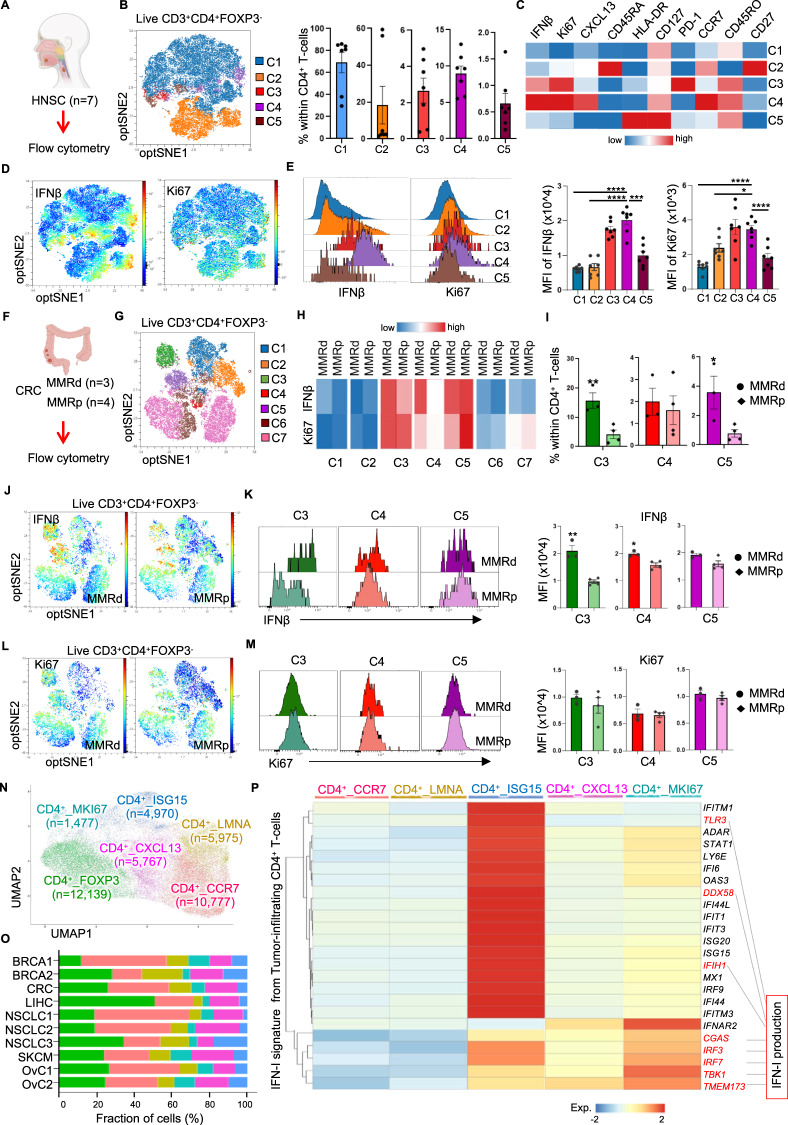
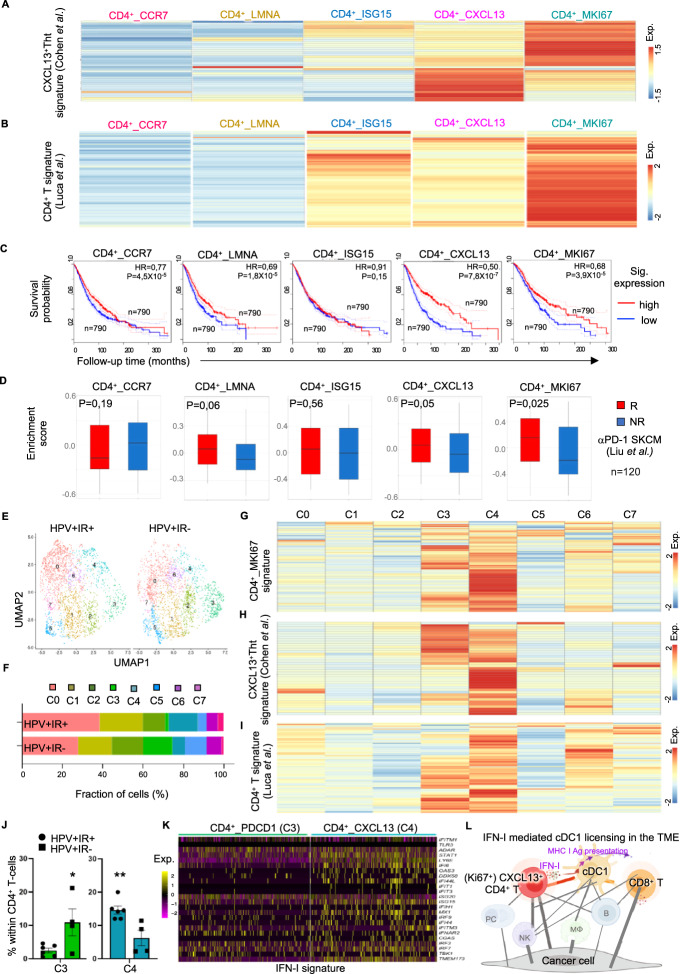
CD4+ T cells can "help" or "license" conventional type 1 dendritic cells (cDC1s) to induce CD8+ cytotoxic T lymphocyte (CTL) anticancer responses, as proven in mouse models. We recently identified cDC1s with a transcriptomic imprint of CD4+ T-cell help, specifically in T-cell-infiltrated human cancers, and these cells were associated with a good prognosis and response to PD-1-targeting immunotherapy. Here, we delineate the mechanism of cDC1 licensing by CD4+ T cells in humans. Activated CD4+ T cells produce IFNβ via the STING pathway, which promotes MHC-I antigen (cross-)presentation by cDC1s and thereby improves their ability to induce CTL anticancer responses. In cooperation with CD40 ligand (L), IFNβ also optimizes the costimulatory and other functions of cDC1s required for CTL response induction. IFN-I-producing CD4+ T cells are present in diverse T-cell-infiltrated cancers and likely deliver "help" signals to CTLs locally, according to their transcriptomic profile and colocalization with "helped/licensed" cDCs and tumor-reactive CD8+ T cells. In agreement with this scenario, the presence of IFN-I-producing CD4+ T cells in the TME is associated with overall survival and the response to PD-1 checkpoint blockade in cancer patients.

Keywords: (cross-)presentation; CD4+ T-cell help; CD40 costimulation; CTL priming; IFN-I signaling; Tumor control; cDC1 licensing.


Conflict of interest statement

The authors declare no competing interests.

Figures

Fig. 1
Fig. 1
CD3/CD28-activated CD4+ T cells produce IFNβ via STING pathway activation, which induces an IFN-I response in “helped” cDC1s. A, B Purified cDC1s were cocultured with activated (“helped”) or naive (“non-helped”) CD4+ T cells and then subjected to 10X Genomics hashtag single-cell (sc) mRNA-seq analysis [6]. A Gene set enrichment analysis (GSEA) of the 577 DEGs in the cDC1 “help” signature denoting enrichment of the indicated pathways (FDR < 0.05) using the Reactome database. B Heatmap depicting scaled expression values of the genes involved in the “helped” cDC1-enriched IFN-I response pathway. CJ Purified cDC1s were stimulated with anti-CD3/CD28-activated CD4+ T cells or poly (I:C). Naive CD4+ T cells were stimulated with anti-CD3/CD28 antibodies alone or in combination as indicated for 4872 h. A STING inhibitor (H-151) or STING agonist (2′3′-cGAMP) was added for the last 8 h of culture where indicated. The cells were analyzed by flow cytometry. Histograms and median fluorescence index (MFI) values of intracellular IFNα and IFNβ expression in cDC1s (C) and CD4+ T cells (D) under the indicated conditions. E The supernatant concentration of IFNβ protein produced by CD4+ T cells under the indicated conditions was measured via ELISA. F Histograms and MFI values of intracellular SLC19A1, phospho-STING, phospho-TBK1 and phospho-IRF3 protein levels in CD4+ T cells under the indicated conditions. MFI values of CXCR3 (G), T-bet (H), IFNγ (I) and IFNβ (J) in CD4+ T cells under the indicated conditions. The data were pooled from multiple independent experiments per donor (n = 3 in C; n = 47 in D; n = 4 in E, F and G; and n = 5 in HJ). P < 0.05*, P < 0.01**, P < 0.001***, P < 0.0001**** (one-way ANOVA for C, D and G; two-tailed Mann‒Whitney U test for E, HJ). The data are shown as the means ± standard errors of the mean (SEMs)
Fig. 2
Fig. 2
The response of cDC1s to CD4+ T-cell help is significantly compromised upon IFNAR2 blockade. Purified cDC1s were stimulated with or without CD3/CD28-activated CD4+ T cells. An anti-IFNAR2 blocking antibody (5 μg/ml) or IgG2A isotype control was added as indicated. The expression of key molecules in the cDC1 “help” signature [6] was analyzed via flow cytometry. A Gating strategy for cDC1 sorting. B Schematic illustration of the cDC1-CD4+ T-cell coculture system. C Gating strategies for flow cytometric analysis of cDC1s after coculture with CD4+ T cells. D, F Histograms depicting the expression of the indicated cDC1 “help” signature markers under the indicated conditions. E, G MFI values for the expression of the indicated cDC1 “help” signature markers under the indicated conditions. The data were pooled from three (n = 3) independent experiments in E, G. P < 0.05*, P < 0.01**, P < 0.001*** (one-way ANOVA). The data are shown as the means ± SEMs
Fig. 3
Fig. 3
IFN-I-stimulated cDC1s share many features with “helped” cDC1s. A–G Purified cDC1s were stimulated with IFN-I (100 U/ml IFNα + 150 pg/ml IFNβ) or with CD3/CD28-activated CD4+ T cells. The expression of key molecules in the cDC1 “help” signature [6] was analyzed by flow cytometry. A Gating strategy for cDC1 sorting. B Schematic illustration of the experimental procedure. C Gating strategies for flow cytometric analysis of cDC1s after stimulation. D, F Histograms depicting the expression of the indicated cDC1 “help” signature markers under the indicated conditions. E, G MFI values for the expression of the indicated cDC1 “help” signature markers under the indicated conditions. H, I Purified cDC1s cultured with or without IFN-I were subjected to NanoString nCounter analysis. H Volcano plot depicting the DEGs between cDC1s with and without IFN-I stimulation. The genes indicated in red are significantly differentially expressed, with a p value < 0.01 and a log2-fold change (FC)>1. I Violin plots depicting pathway annotations of adaptive immune response genes enriched in IFN-I-stimulated cDC1s. The data were pooled from three (n = 3) independent experiments in (E, G). The data were obtained from three (n = 3) independent biological samples in (H, I). P < 0.05*, P < 0.01**, P < 0.001***, P < 0.0001**** (one-way ANOVA). The data are shown as the means ± SEMs
Fig. 4
Fig. 4
IFN-I produced by activated CD4+ T cells is important for the cDC1-mediated CTL response to cell-associated tumor antigens. A tumor antigen-specific CTL priming system [6] was used to investigate the impact of IFN-I produced by activated CD4+ T cells on the cross-presentation and cross-priming abilities of cDC1s. IFNβ expression was downregulated in CD4+ T cells by siRNA. A Flow cytometry histograms depicting intracellular IFNβ expression and the surface expression of the indicated markers identifying effector T cells under the indicated conditions. B MFI values for intracellular IFNβ expression under the indicated conditions. C Schematic illustration of the tumor antigen-specific CTL priming system. D CD8+ T-cell proliferation induced by MART-11540 long peptide (LP) based on CTV dilution. E Percentages of MART-12635/HLA-A2-specific (tetpostive) cells among CD8+ T cells or CTVnegative CD8+ T cells in the MART-115-40 LP setting. F CTL response to MART-11540 LP based on intracellular Granzyme B staining. G Percentages of Granzyme B+ cells among CTVnegative CD8+ T cells and MFI values of Granzyme B in the MART-115-40 LP setting. H CD8+ T-cell proliferation in response to dead Mel526 cell debris based on CTV dilution. I Percentages of MART-126-35/HLA-A2-specific (tetpositive) cells and tetnegative cells among CTVnegative CD8+ T cells in the dead Mel526 cell debris setting. J CTL response to dead Mel526 cell debris based on intracellular Granzyme B staining. K Percentages of Granzyme B+ cells among CTVnegative CD8+ T cells and MFI values of Granzyme B in the dead Mel526 cell debris setting. The data were pooled from eight (n = 8 in B), seven (n = 7 in E, G) or five (n = 5 in I, K) independent experiments. P < 0.05*, P < 0.01**, P < 0.001***, P < 0.0001**** (one-way ANOVA). The data are shown as the means ± SEMs
Fig. 5
Fig. 5
CD4+ T-cell help provided via IFNβ rather than via CD40 signaling promotes MHC-I antigen cross-presentation in cDC1s. Purified naive CD4+ T cells were transfected with Cas9/ctrl. gRNA, Cas9/IFNB1 gRNA, Cas9/CD40LG gRNA or the Cas9/IFNB1+CD40LG gRNA ribonucleoprotein (RNP) complex were subsequently stimulated with anti-CD3/CD28 antibodies. A Schematic illustration of the cDC1-CD4+ T-cell coculture system and the gating strategies for flow cytometric analysis of the cDC1 response. B MFI values for the expression of the indicated cDC1 “help” signature markers under the indicated conditions. The black box highlights the molecules involved in MHC-I antigen presentation. CE The tumor antigen-specific CTL priming system [6] was used to investigate the impact of IFN-I and CD40L produced by CD4+ T cells on cDC1-mediated CTL priming. Dead Mel526 cell debris was used as an antigen source. C Schematic illustration of the experimental procedures. (D) CD8+ T-cell proliferation based on CTV dilution and the CTL response based on intracellular Granzyme B and IFNγ staining. E Percentages of MART-126-35/HLA-A2-specific (tet+) cells, tet(-) cells, and Granzyme B+ or IFNγ+ cells among CTV(-)CD8+ T cells. The data were pooled from three (n = 3 in B) or 8 (n =  8 in E) independent experiments. P < 0.05*, P < 0.01**, P < 0.001*** (one-way ANOVA). The data are shown as the means ± SEMs
Fig. 6
Fig. 6
Loss of CD40L and IFNβ in CD4+ T cells significantly impairs the cDC1-mediated tumoricidal capacity of helped CTLs. A cytotoxicity assay was performed using live MART-1-specific CD8+ T cells purified from the CTL priming system and Mel526 tumor cells cultured at different effector/target (E/T) ratios for 18 h, and the data were analyzed by IncuCyte S3 software. At the end of the assay, the cell suspensions were pooled and analyzed via flow cytometry. The remaining Mel526 cells in each well were fixed and stained with crystal violet. A Schematic illustration of the cytotoxicity assay procedures. B, C Histograms and MFI values for the expression of the indicated markers in CD8+ T cells after the cytotoxicity assay. D Flow cytometric plots depicting total and dead Mel526 cells, as indicated by the CD45CD8 and IRdye+CD45CD8 populations, respectively, under the indicated conditions. E Percentage and number (#) of dead tumor cells in the cell suspension. F Caspase 3/7 activity in tumor cells during the cytotoxicity assay under the indicated conditions at an E/T ratio of 4/1. G Representative CCD micrographs depicting the Mel526 cells remaining in the plate 18 h post coculture under the indicated conditions at an E/T ratio of 4/1. H Confluence of the remaining Mel526 cells cultured under the indicated conditions at an E/T ratio of 4/1. The data were pooled from three (n = 3) independent experiments, each with technical duplicates. One-way ANOVA in (C, E, H). One-way repeated measures ANOVA in (F). P < 0.05*, P < 0.01**, P < 0.001***, P < 0.0001****. The data are shown as the means ± SEMs
Fig. 7
Fig. 7
Tumor-infiltrating Ki67+CXCL13+CD4+ T cells express IFN-I across multiple tumor types. A Schematic illustration of the experimental procedure using head and neck cancer samples (HNSC, n = 7). B OptSNE plot of the five clusters identified and the percentage of each cluster among tumor-infiltrating FOXP3CD4+ T cells. C Heatmap depicting the median expression values of the indicated markers in the five CD4+ T-cell clusters. D OptSNE plots, E histograms and MFI values for the expression of IFNβ and Ki67 in the five CD4+ T-cell clusters. F Schematic illustration of the experimental procedure using mismatch repair-deficient (MMRd, n = 3) and MMR-proficient (MMRp, n = 4) colorectal cancer (CRC) samples. G OptSNE plot of the seven clusters identified among tumor-infiltrating FOXP3-CD4+ T cells. H Heatmap depicting the median expression values of IFNβ and Ki67 in the seven CD4+ T-cell clusters. I Percentages of cluster 3-5 cells among CD4+ T-cells. OptSNE plots of (J) IFNβ and (L) Ki67 expression in FOXP3-CD4+ T cells. Histograms and MFI values for (K) IFNβ and (M) Ki67 expression in clusters 3-5. N UMAP plot of the tumor-infiltrating CD4+ T-cell clusters identified across ten scRNA-seq studies. O Compositions of the tumor-infiltrating CD4+ T-cell clusters identified in the ten scRNA-seq studies. The color scheme is shown in (N). P Heatmap of scRNA-seq data depicting the average expression values of the IFN-I signature [37] in CD4+ T cells across multiple tumor types. IFN-I production-related genes are indicated. P < 0.05*, P < 0.01**, P < 0.001***, P < 0.0001**** (one-way ANOVA for E; two-tailed Mann‒Whitney U-test for I, K, M). The data are shown as the means ± SEMs
Fig. 8
Fig. 8
Tumor-infiltrating Ki67+CXCL13+CD4+ T cells enriched with the IFN-I signature are associated with better clinical outcomes in cancer patients. Tumor-infiltrating Ki67+CXCL13+CD4+ T cells enriched with the IFN-I signature are associated with better clinical outcomes in cancer patients. A, B Heatmaps depicting the average expression values of signature genes of the A CXCL13+ T-helper tumor-specific cell (Tht) signature [40] and the B tumor-infiltrating CD4+ T cells in CE9 [19] in the five tumor-infiltrating FOXP3-CD4+ T-cell clusters that we identified. C Kaplan–Meier curves revealing the prognostic value of the tumor-infiltrating CD4+ T-cell clusters that we identified for overall patient survival in the BRCA, COAD, LIHC, LUAD, OV, READ and SKCM cohorts from the TCGA database (n = 3156). The high and low metagene expression subgroups of patients were identified based on a threshold of the quartile expression level. D Box plots depicting the enrichment scores of tumor-infiltrating CD4+ T-cell clusters in responders (R) and nonresponders (NR) to anti-PD-1 immunotherapy [42]. EK ScRNAseq data of tumor-infiltrating FOXP3CD4+ T cells from HPV+ OPSCC patients (n = 43) were analyzed. The patients were stratified into the immune response-positive (IR+, n = 6) and immune response-negative (IR, n = 4) groups based on the presence or absence, respectively, of tumor-specific T-cell infiltration. E, F UMAP plot and compositions of the eight clusters identified in the IR+ and IR groups. Heatmaps depicting the average expression values of G the tumor-infiltrating CD4+_MKI67 signature that we identified, H the CXCL13+ Tht signature [40] and (I) the tumor-infiltrating CD4+ T-cell signature in CE9 [19] in each cluster. J Percentages of cluster 3 and 4 cells among CD4+ T-cells from patients in the IR+ and IR groups. K Heatmaps depicting the expression of the IFN-I signature in tumor-infiltrating CD4+ T cells in clusters 3 and 4. L Schematic illustration depicting the mechanism of cDC1 licensing mediated by IFN-I-producing CXCL13+CD4+ T cells in the proinflammatory TME (CE9) [19]. P < 0.05*, P < 0.01** (log-rank test/Mantel–Cox test in C; Mann–Whitney U-test for J). The data are shown as the means ± SEM

References

    1. Wu R, Murphy KM. DCs at the center of help: origins and evolution of the three-cell-type hypothesis. J Exp Med. 2022;219:e20211519. doi: 10.1084/jem.20211519. - DOI - PMC - PubMed
    1. Borst J, Ahrends T, Bąbała N, Melief CJM, Kastenmüller W. CD4+ T cell help in cancer immunology and immunotherapy. Nat Rev Immunol. 2018;18:635–47. doi: 10.1038/s41577-018-0044-0. - DOI - PubMed
    1. Ahrends T, Busselaar J, Severson TM, Bąbała N, de Vries E, Bovens A, et al. CD4+ T cell help creates memory CD8+ T cells with innate and help-independent recall capacities. Nat Commun. 2018;10:5531. doi: 10.1038/s41467-019-13438-1. - DOI - PMC - PubMed
    1. Ahrends T, Spanjaard A, Pilzecker B, Bąbała N, Bovens A, Xiao Y, et al. CD4+ T cell help confers a cytotoxic T cell effector program including coinhibitory receptor downregulation and increased tissue invasiveness. Immunity. 2017;47:848–861.e5. doi: 10.1016/j.immuni.2017.10.009. - DOI - PubMed
    1. Ferris ST, Durai V, Wu R, Theisen DJ, Ward JP, Bern MD, et al. cDC1 prime and are licensed by CD4+ T cells to induce anti-tumour immunity. Nature. 2020;584:624–9. doi: 10.1038/s41586-020-2611-3. - DOI - PMC - PubMed

Substances